ColumnMember-Only
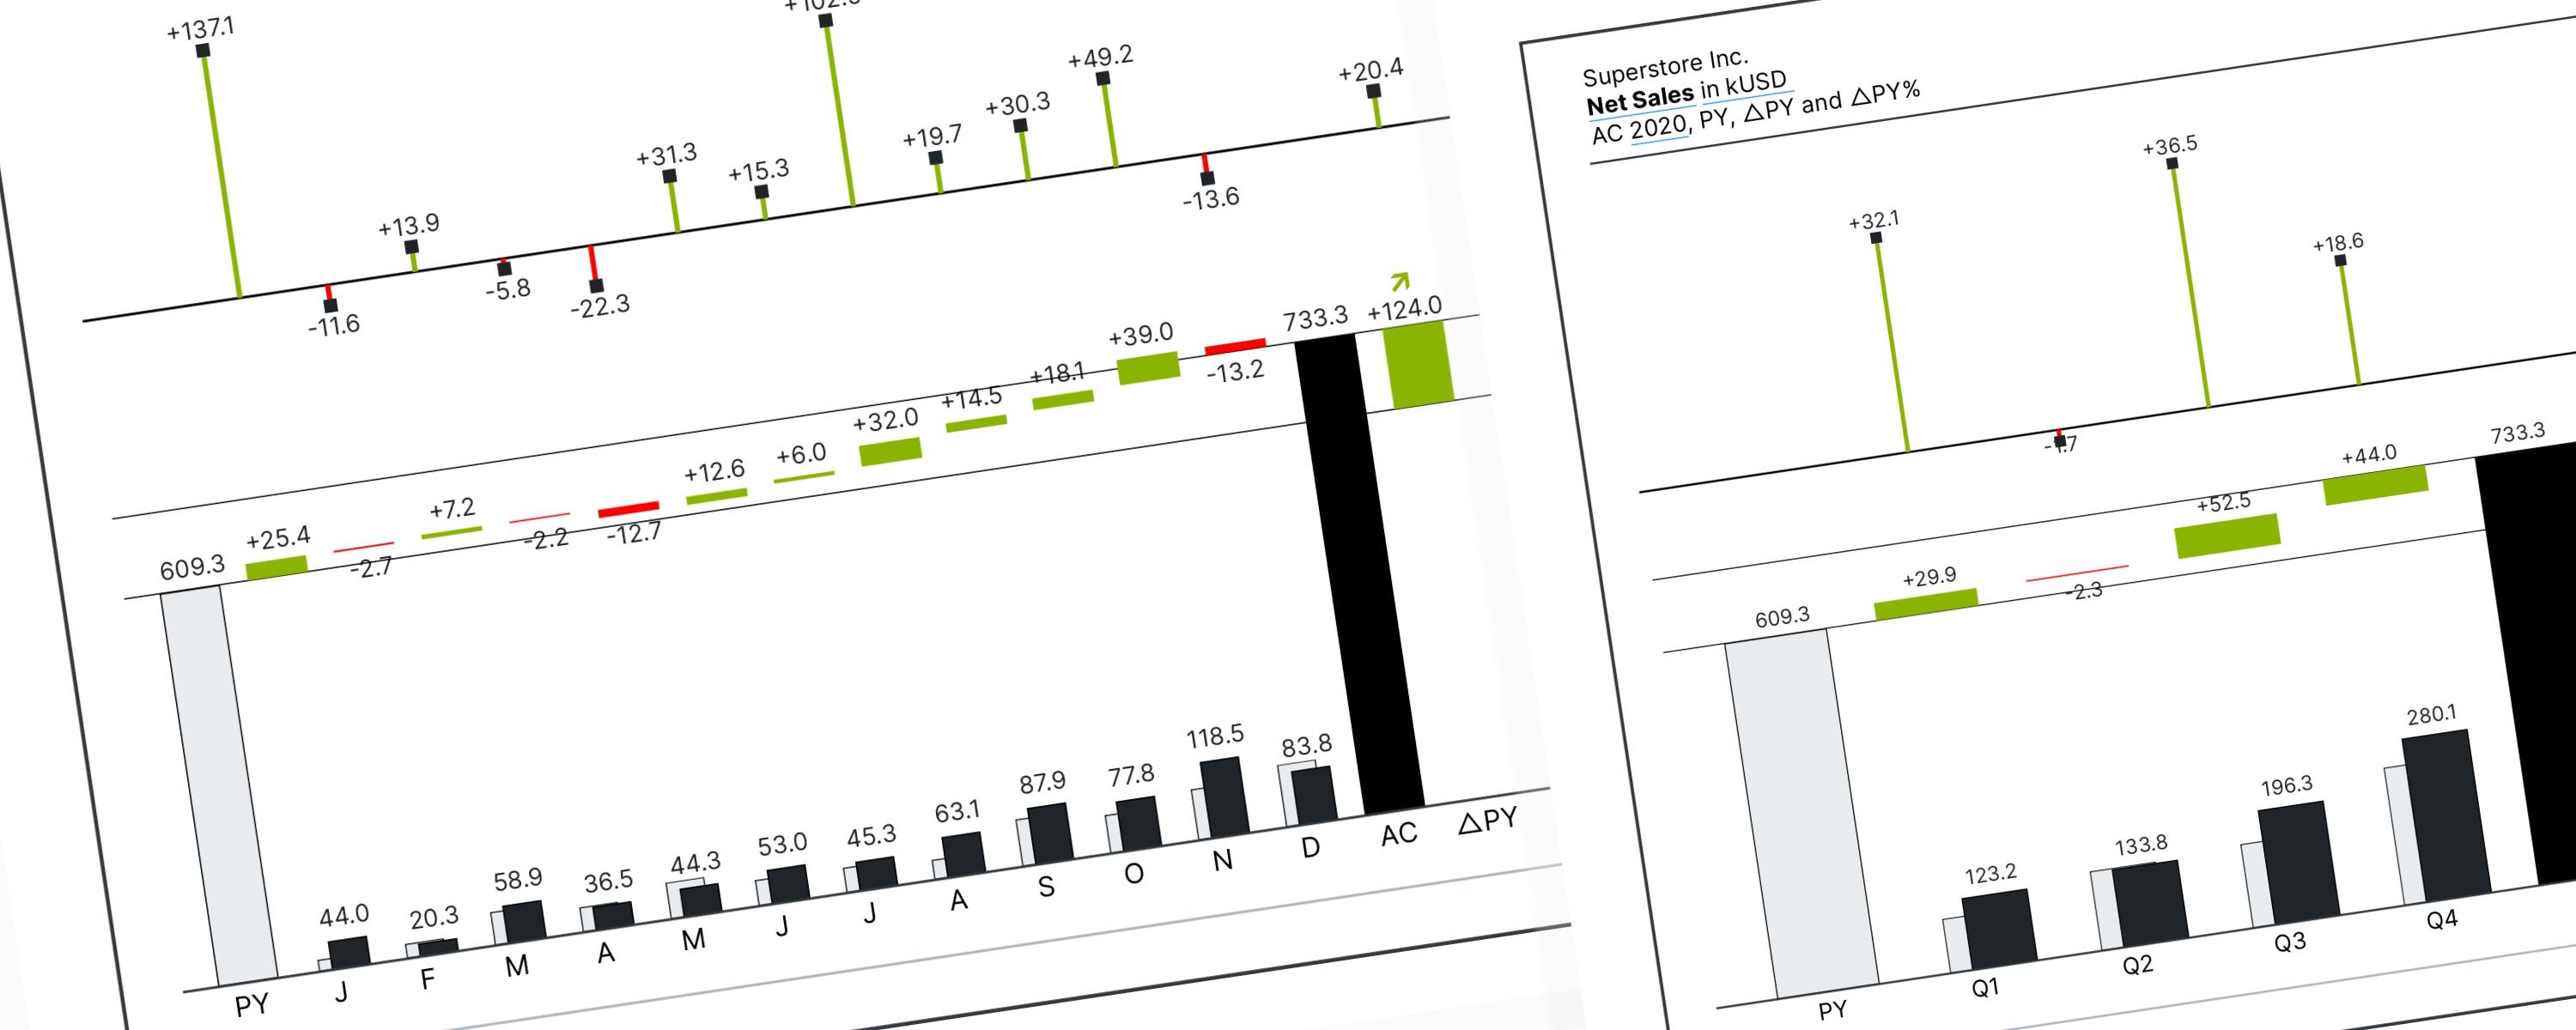
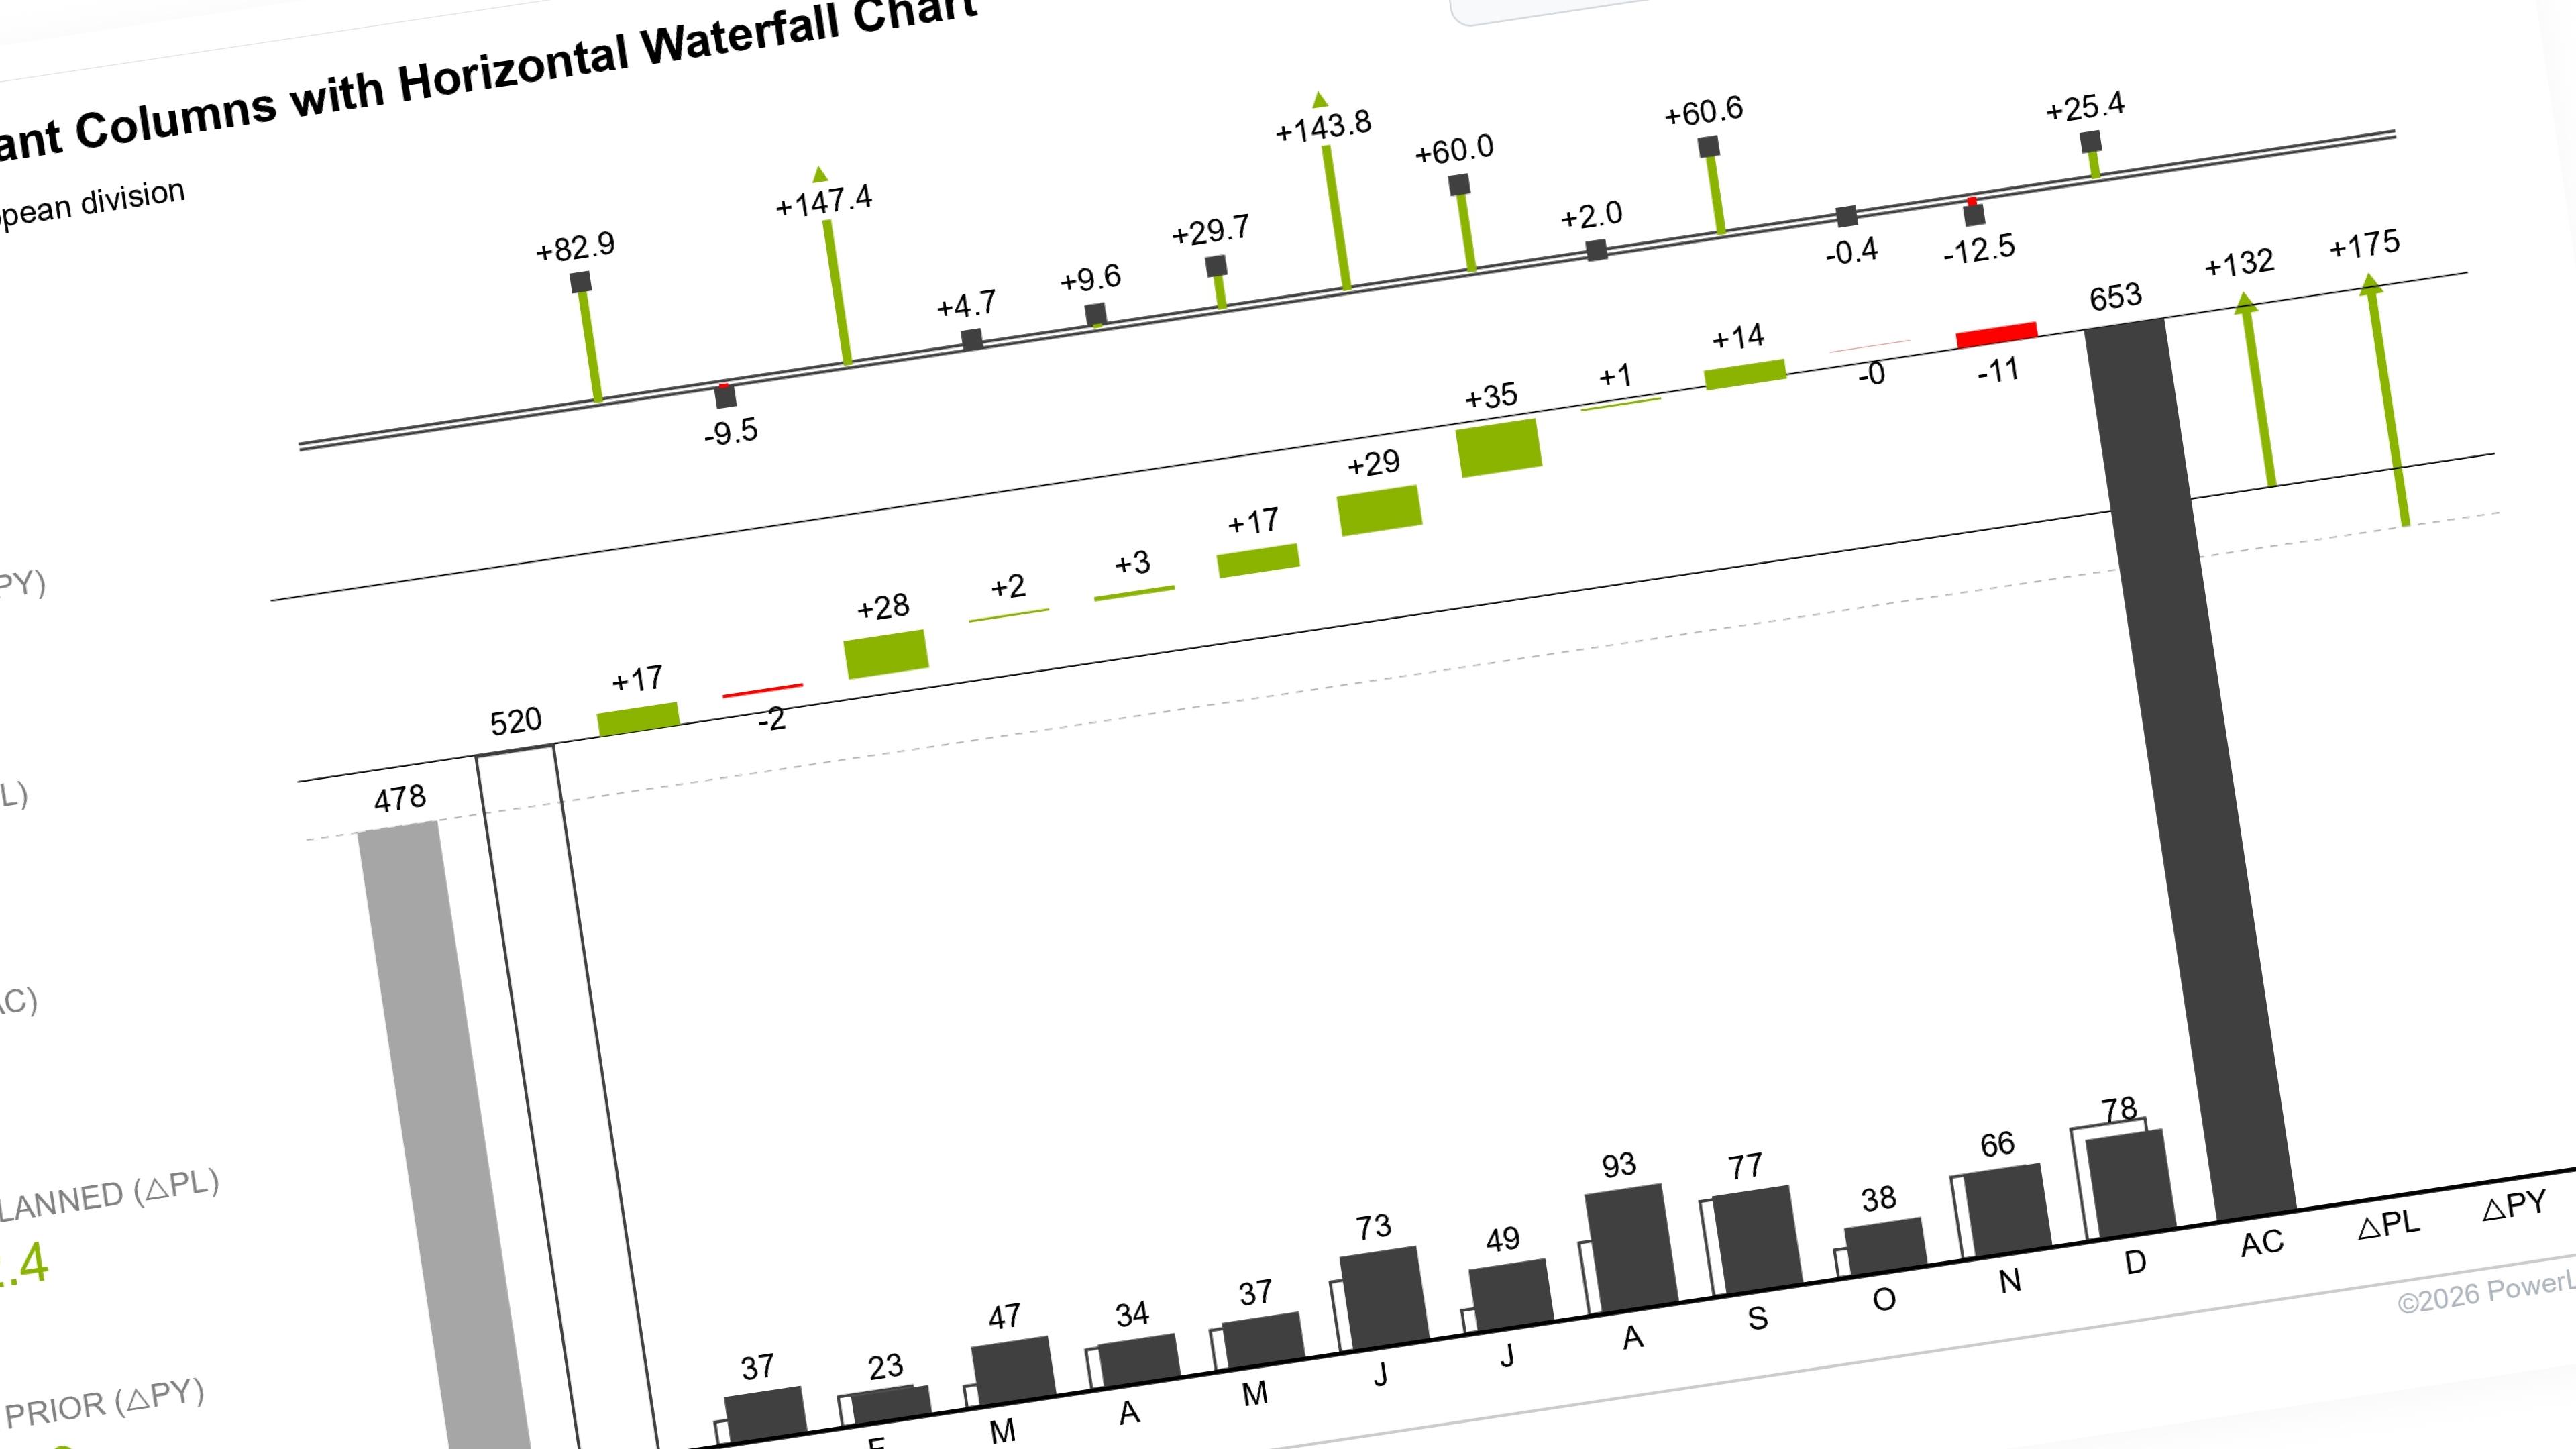
Building Three-Scenario IBCS-Compliant Columns Horizontal with Waterfall Chart (Without UDFs)
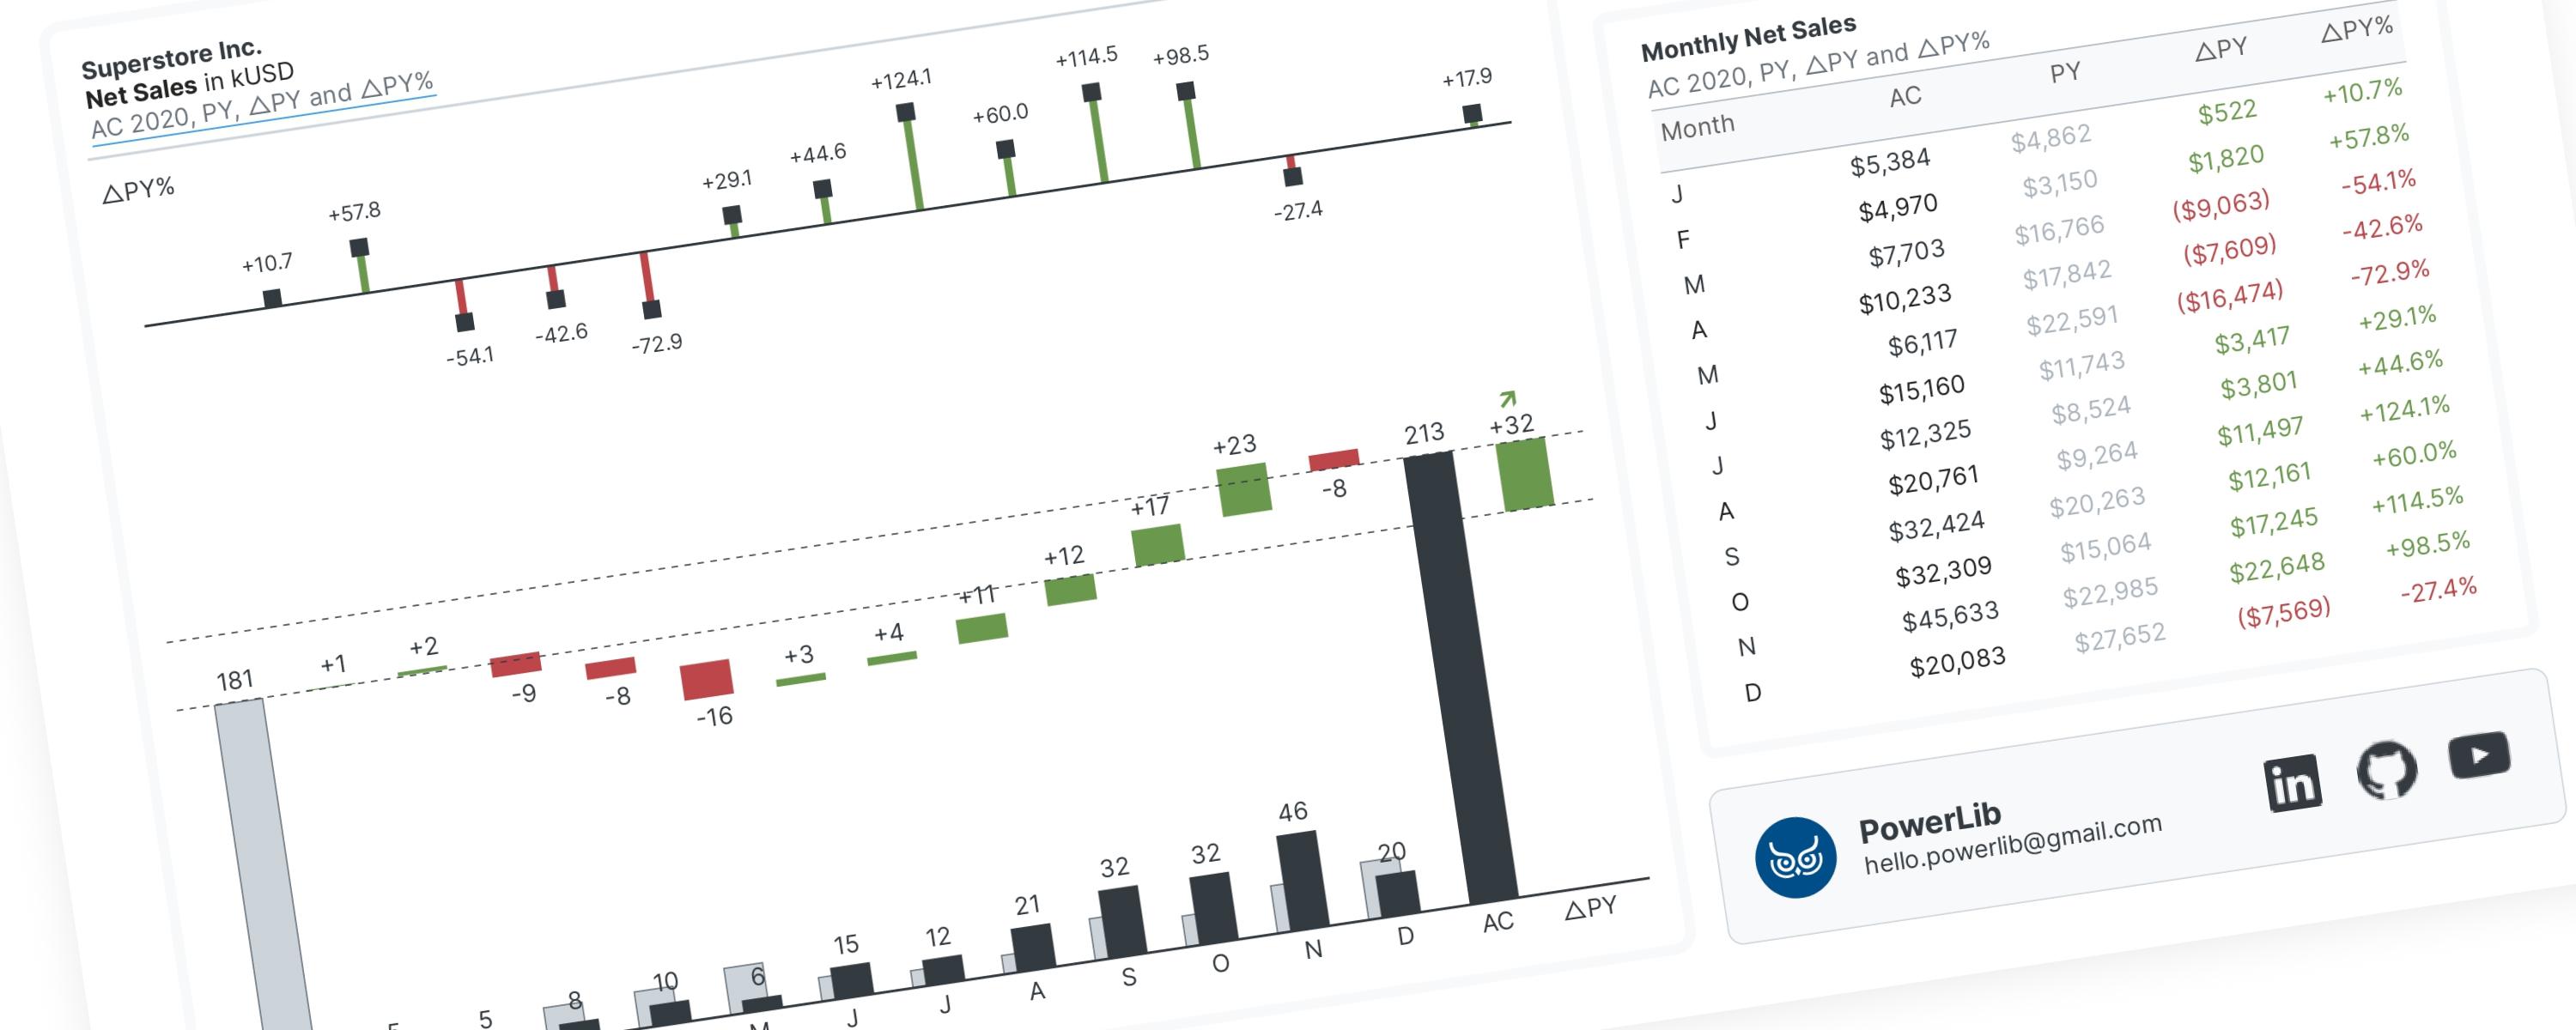
This documentation builds upon the IBCS-compliant Columns with Waterfall Chart, moving from a dual-scenario comparison (Actual vs.
Documented Power BI techniques — the model change, the DAX, and the exact visual settings. Most are free to read; the rest come with the model files for members.

ColumnMember-Only
This documentation builds upon the IBCS-compliant Columns with Waterfall Chart, moving from a dual-scenario comparison (Actual vs.

LineMember-Only
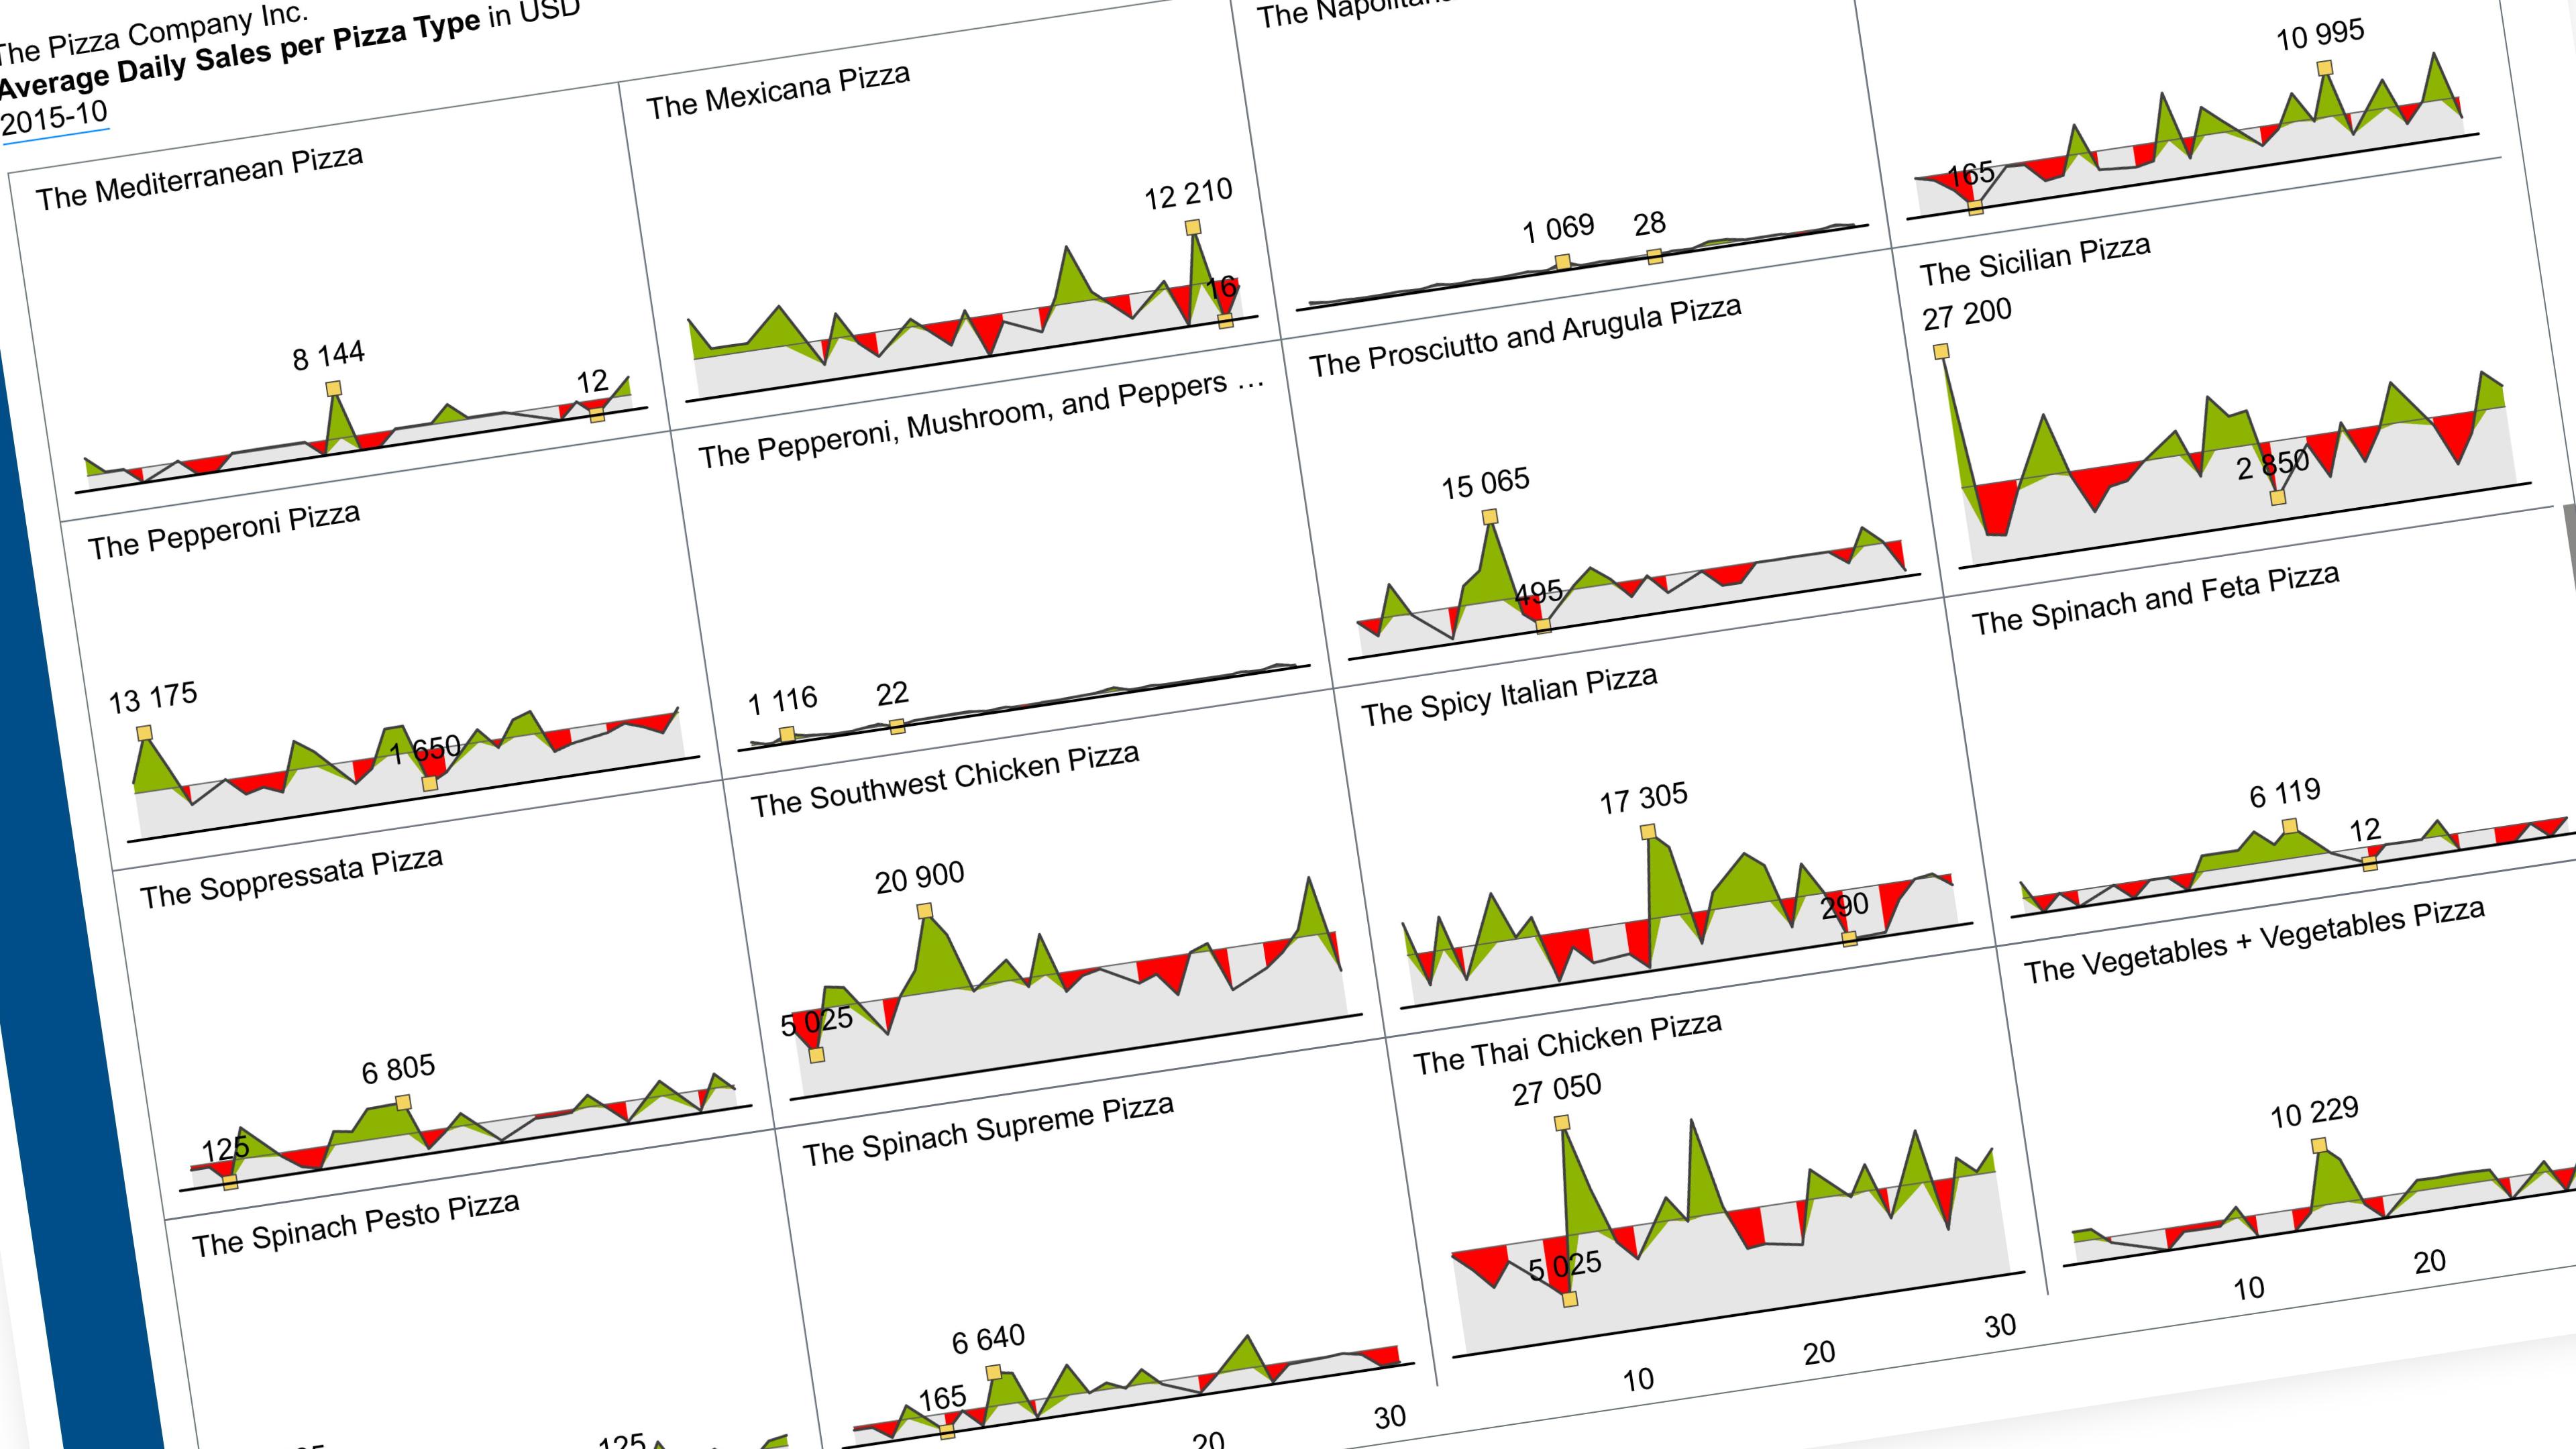
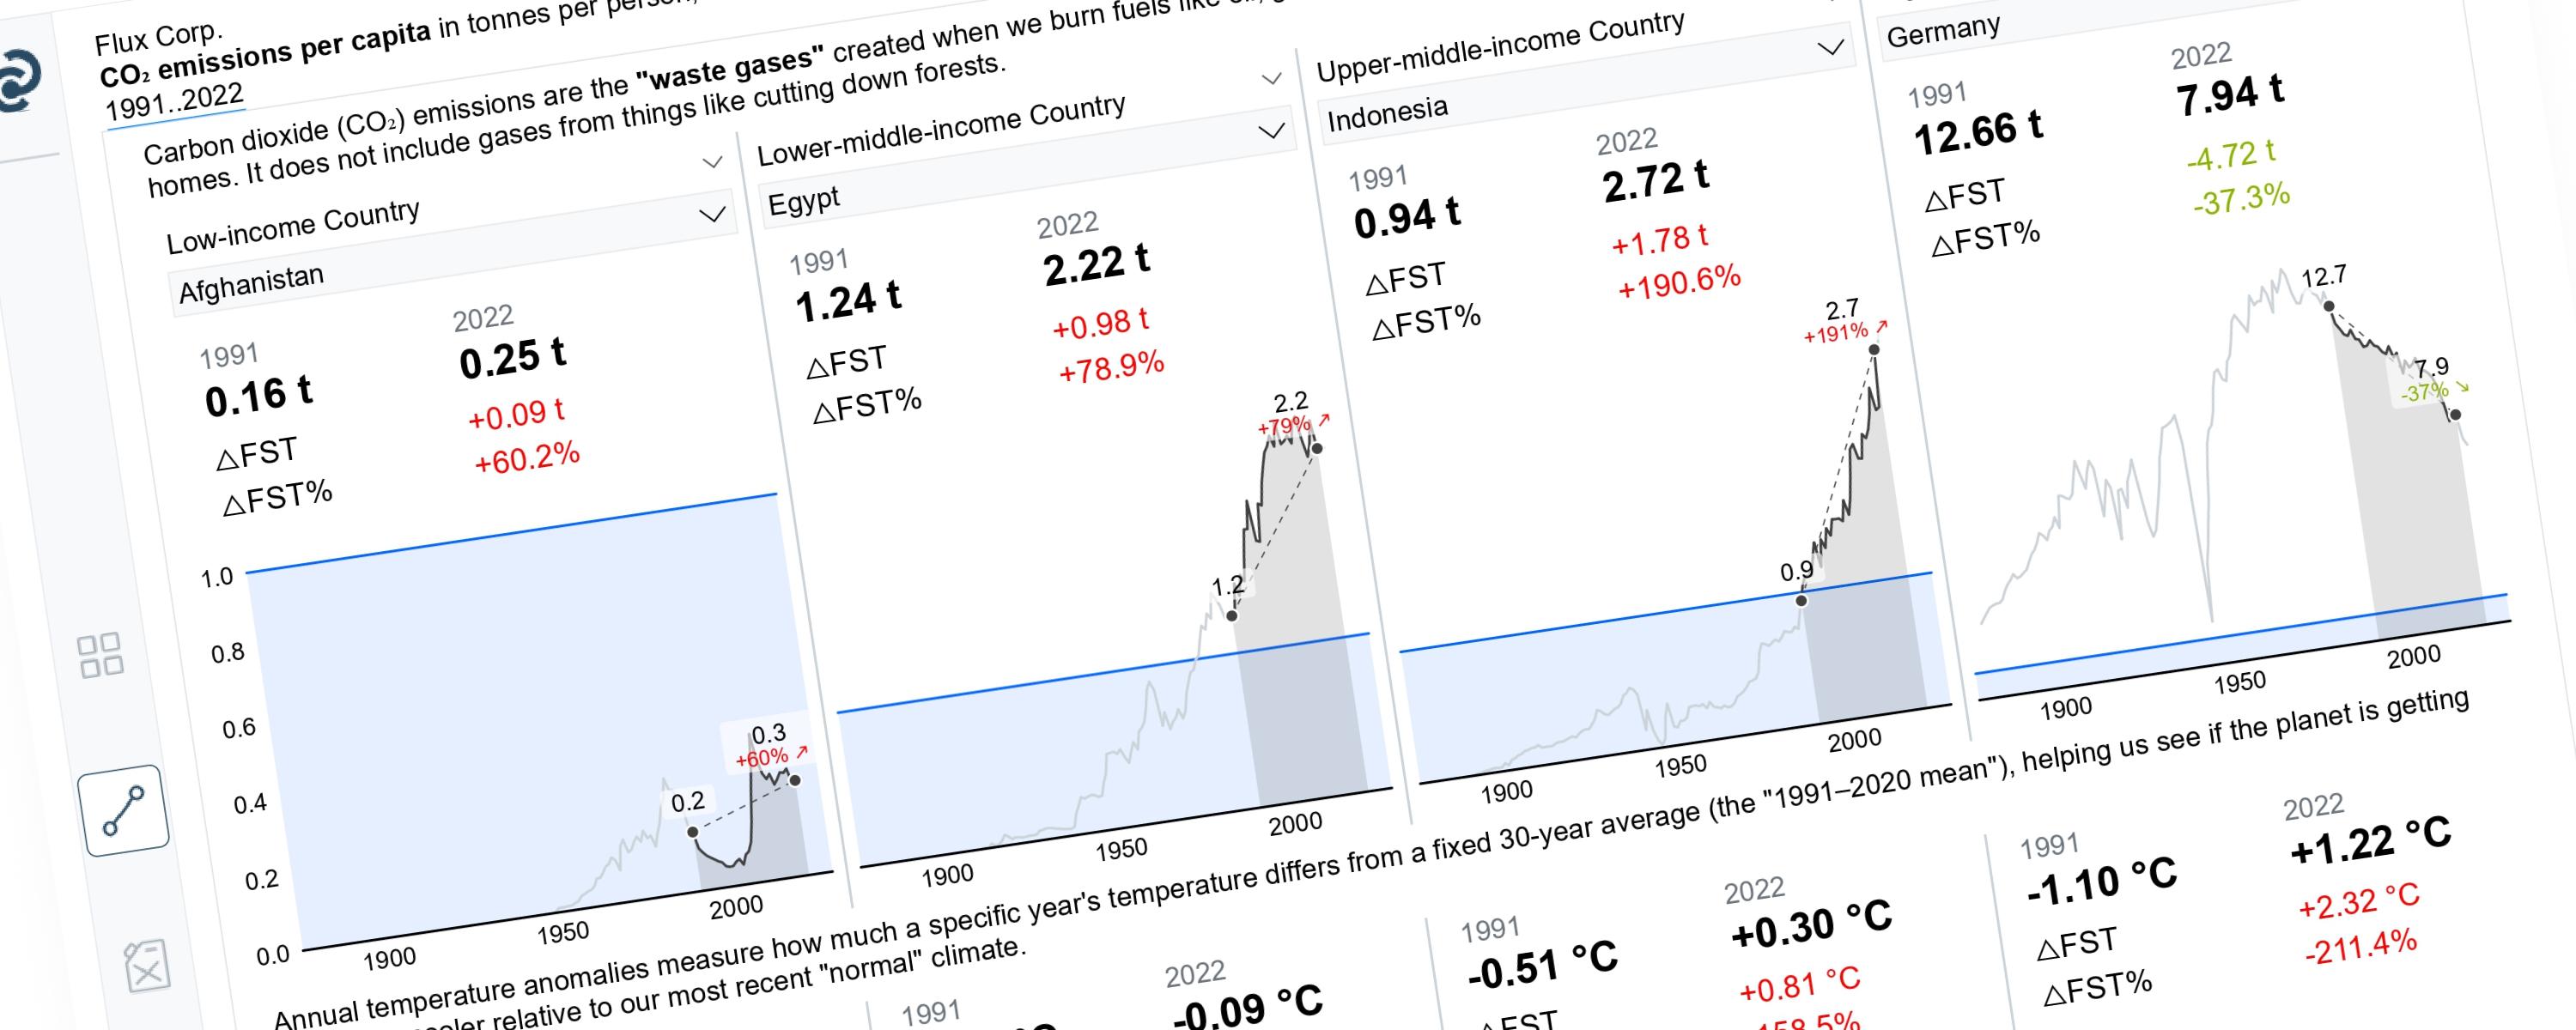
Show one metric’s daily trend, one small chart per category, all on the same scale.

ColumnFree
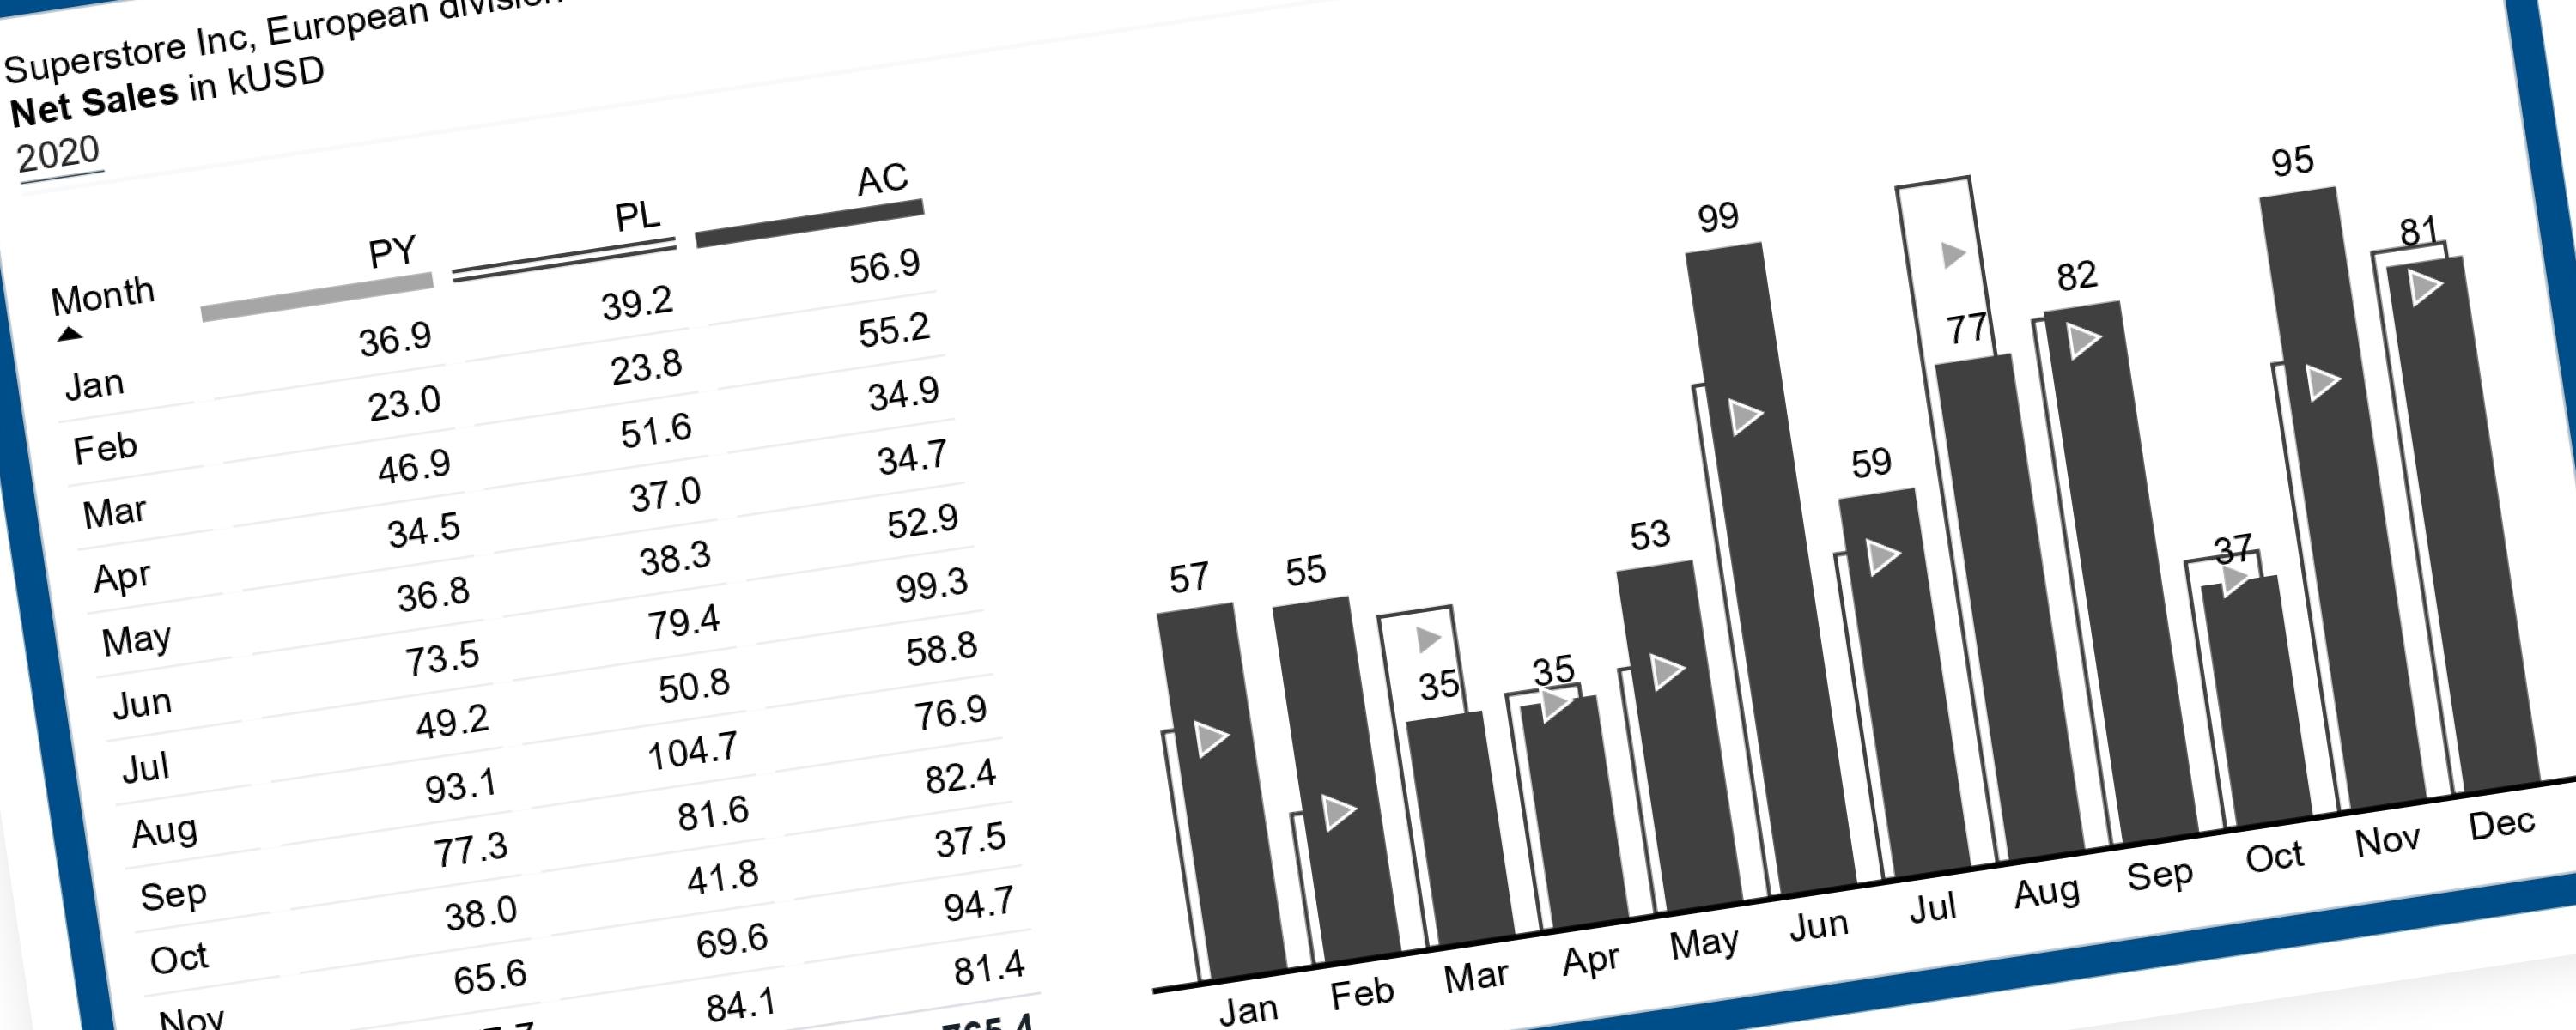
This guide walks you through building a scenario-comparison column chart in Power BI that follows IBCS (International Business Communication Standards) — a set of rules that make…

ColumnMember-Only
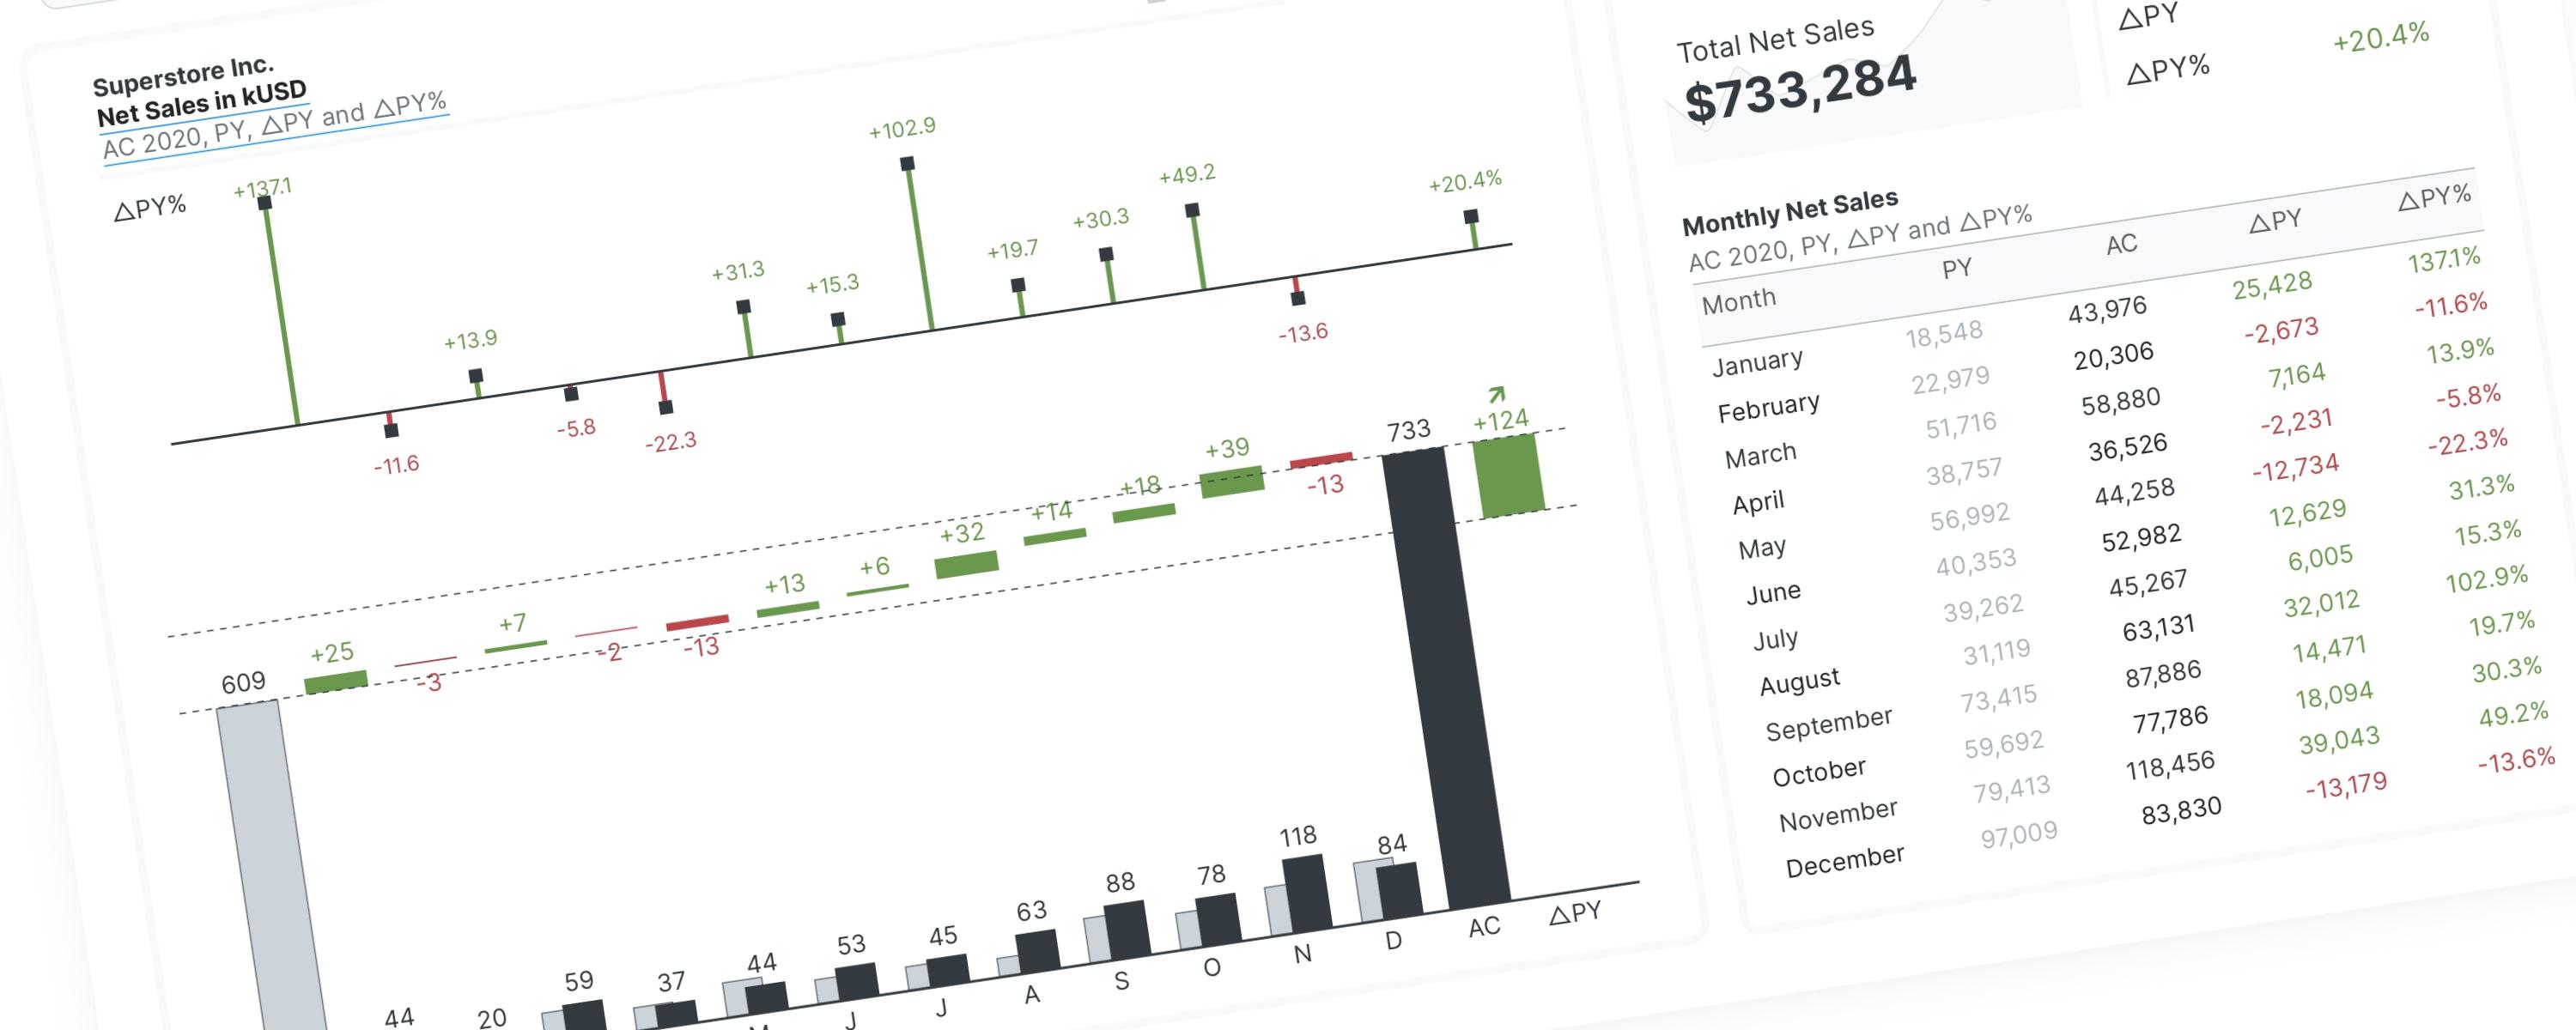
When using a waterfall chart, visual direction determines its purpose: Vertical charts break down data by categories or factors (non-time series), while Horizontal charts track…

Scatter PlotFree
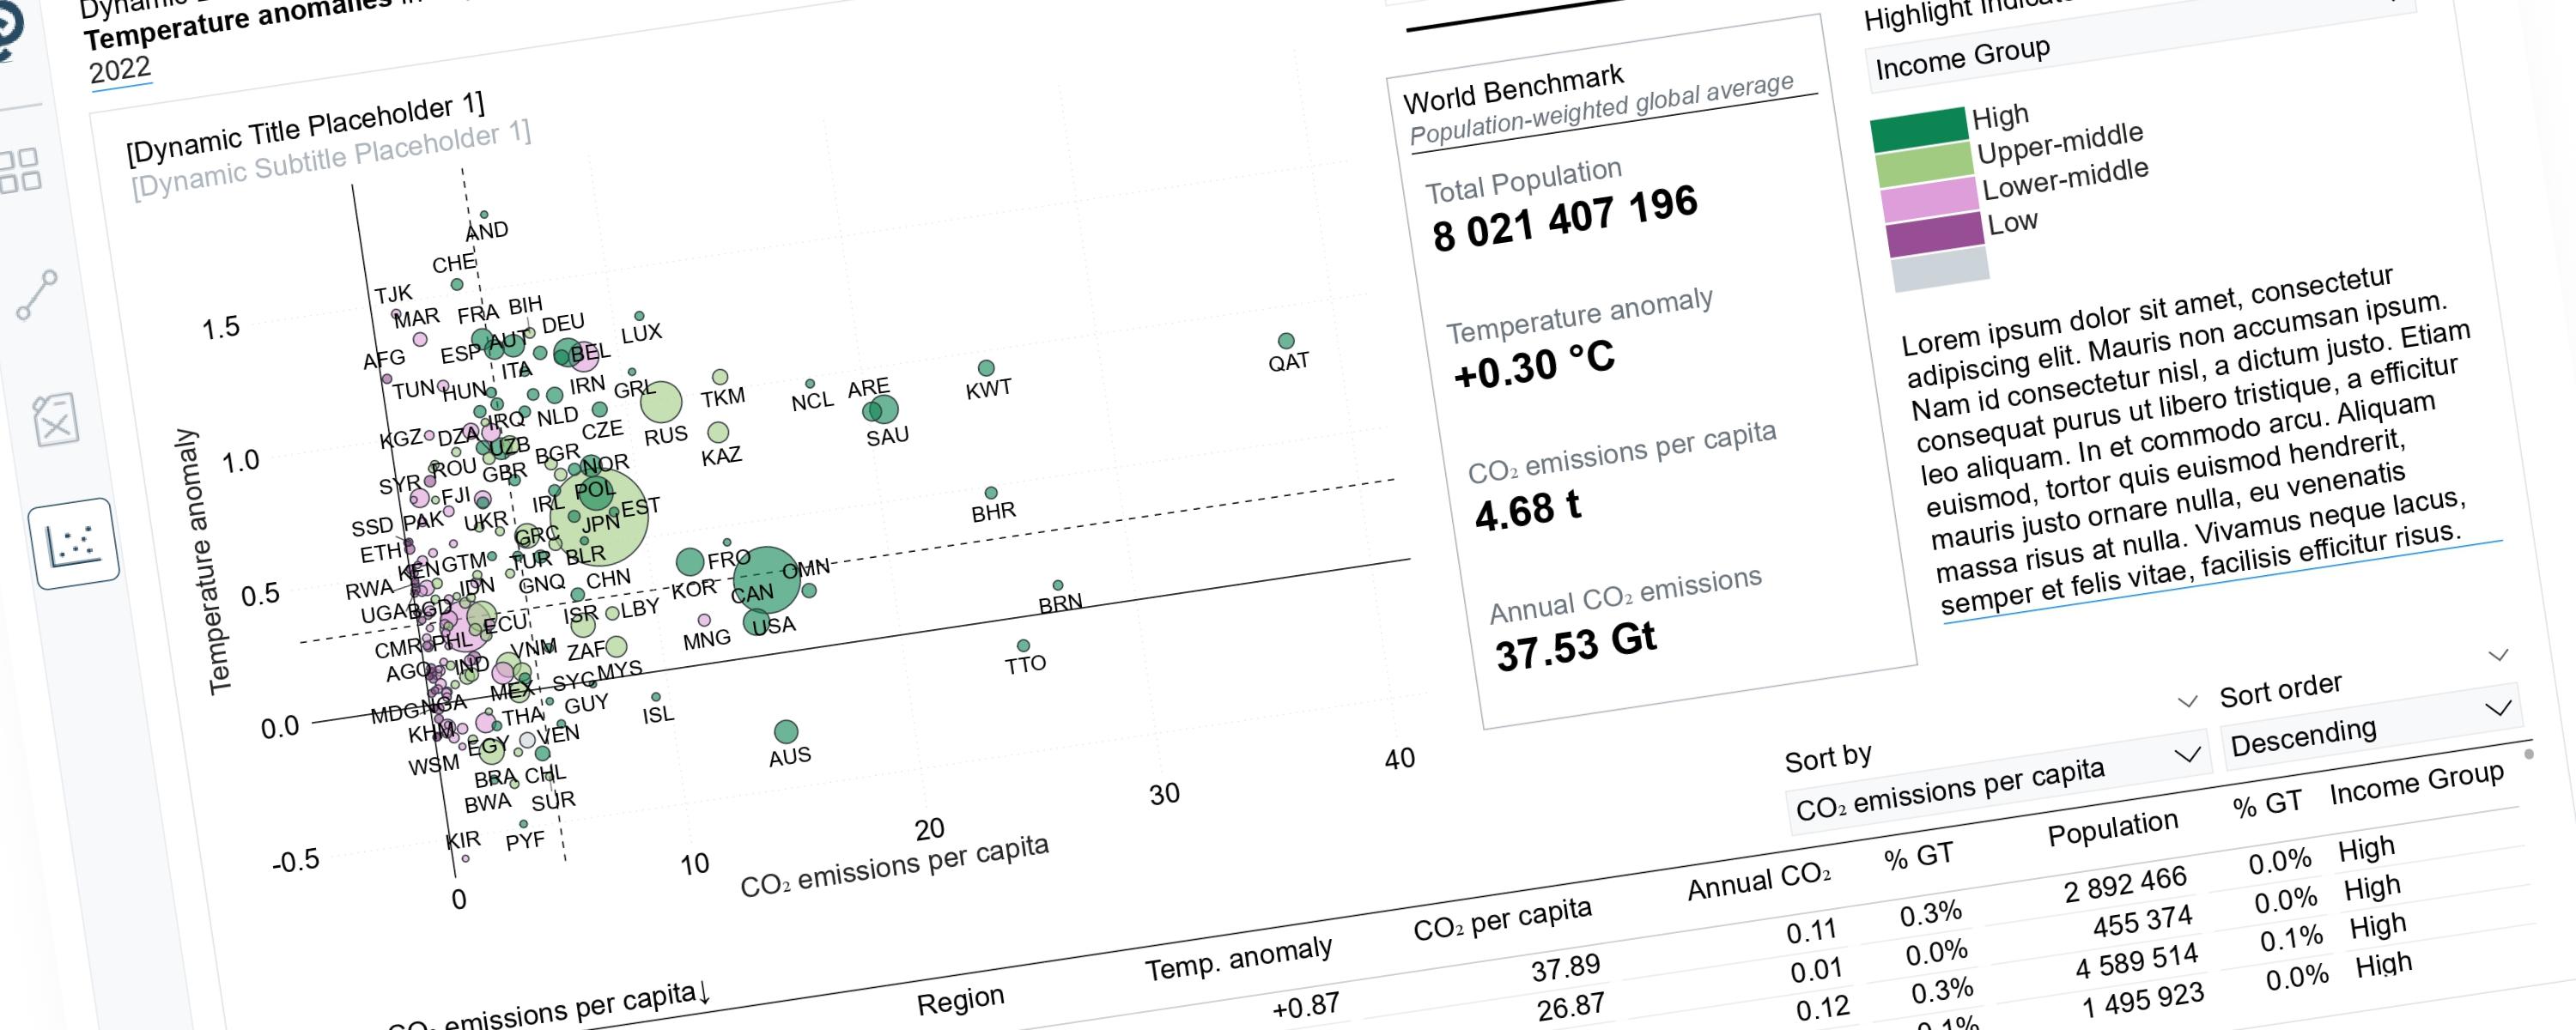
Scatterplots can tell very different stories depending on the perspective we choose to highlight.

LineFree
This article demonstrates how to build a Power BI line chart that dynamically highlights a selected year range while greying out the rest.

LineFree
Field parameters are a powerful feature in Power BI. When combined with the SWITCH() function, these tools allow us to tell a compelling data story by dynamically highlighting…

LineFree
A waterfall chart is a special type of bar chart that shows you the story behind how a number changed from one point to another.

LineMember-Only
You can find my explanation of the IBCS horizontal waterfall chart's construction logic in Power BI on LinkedIn: