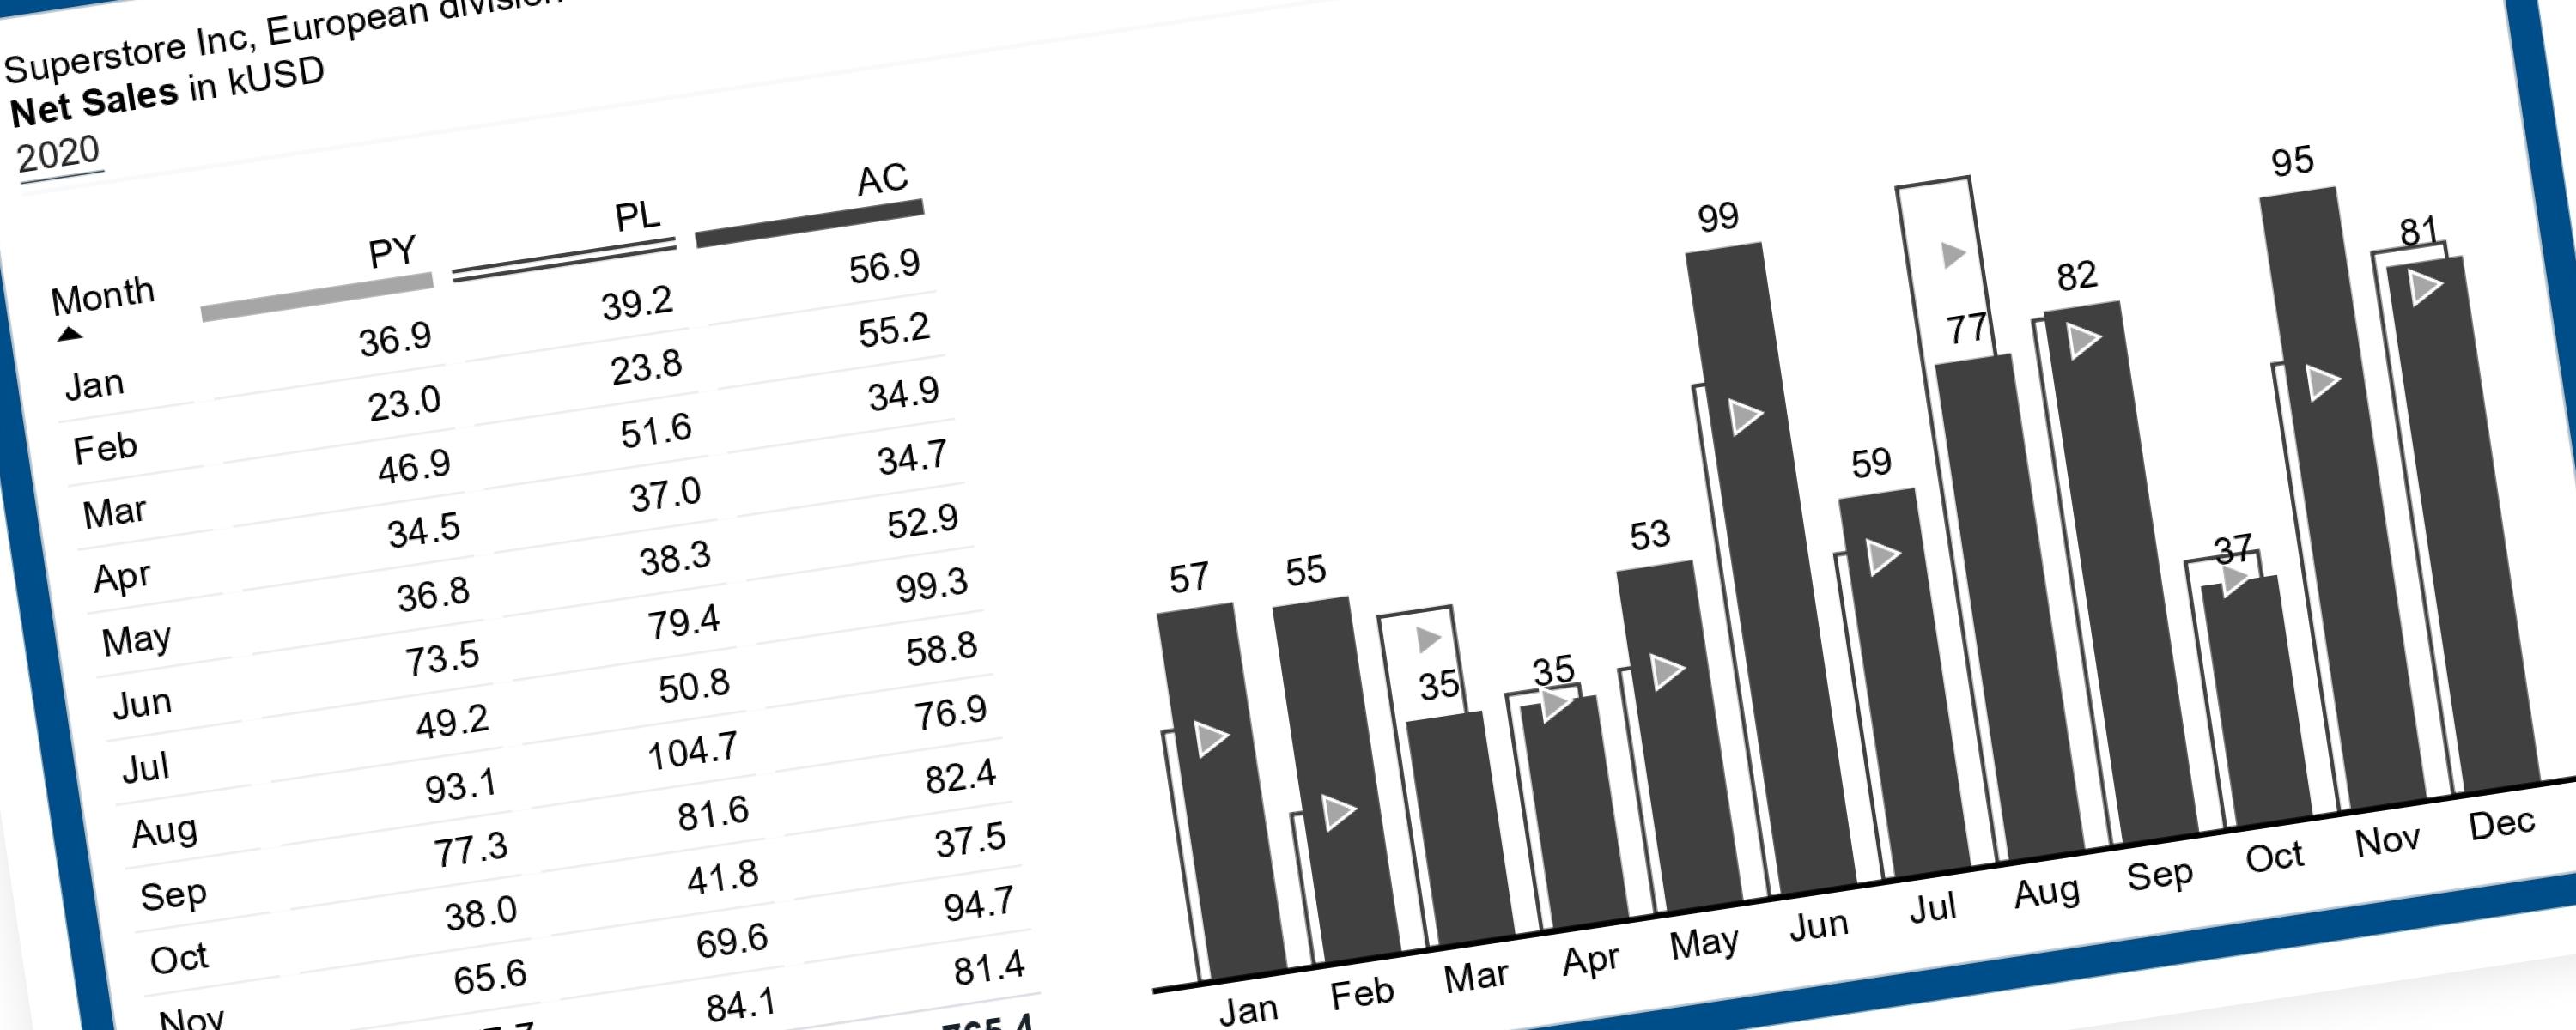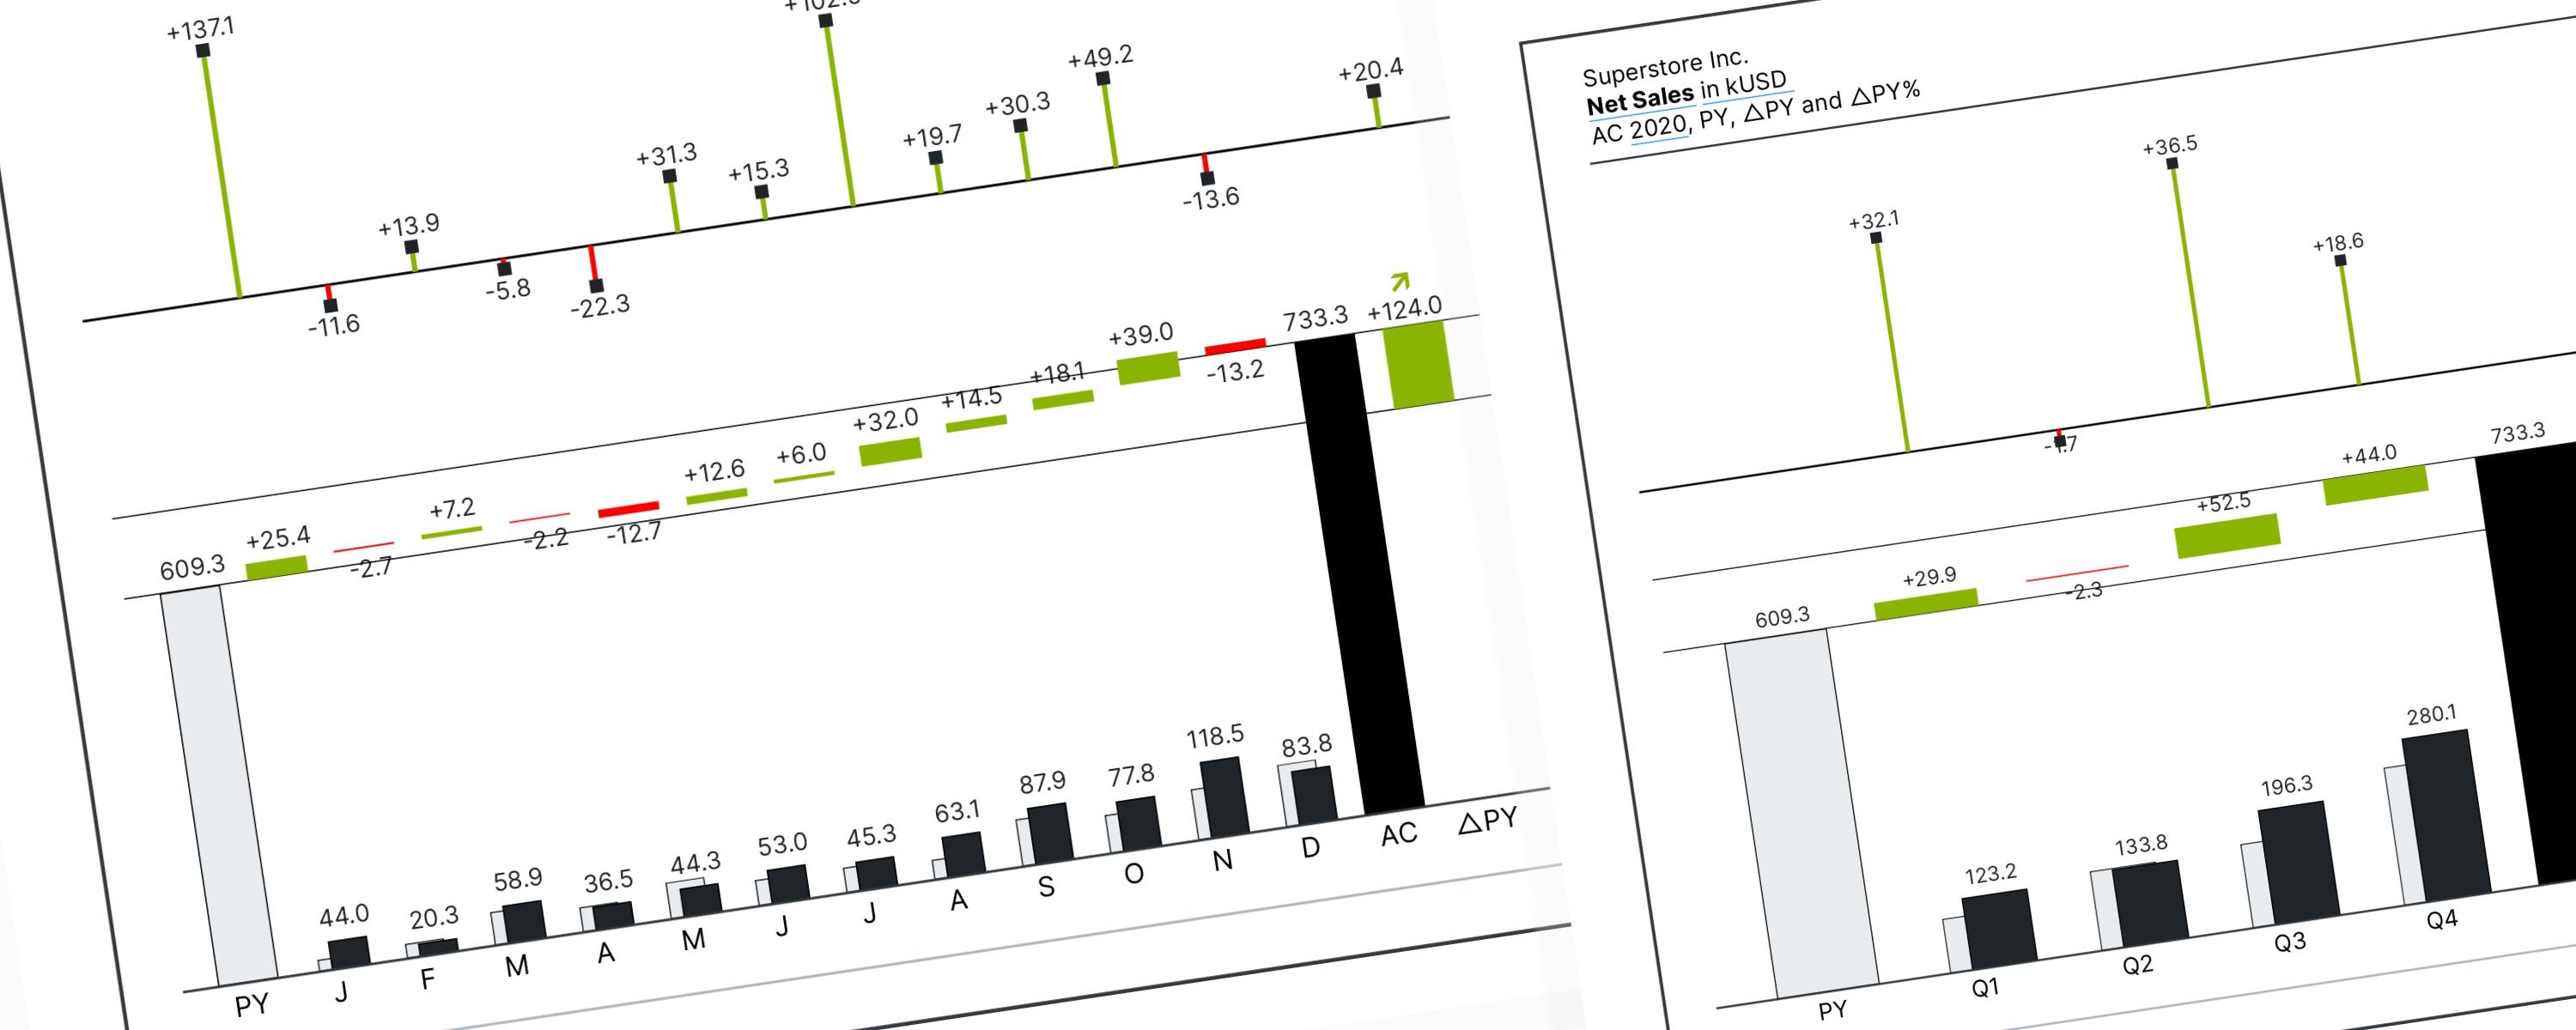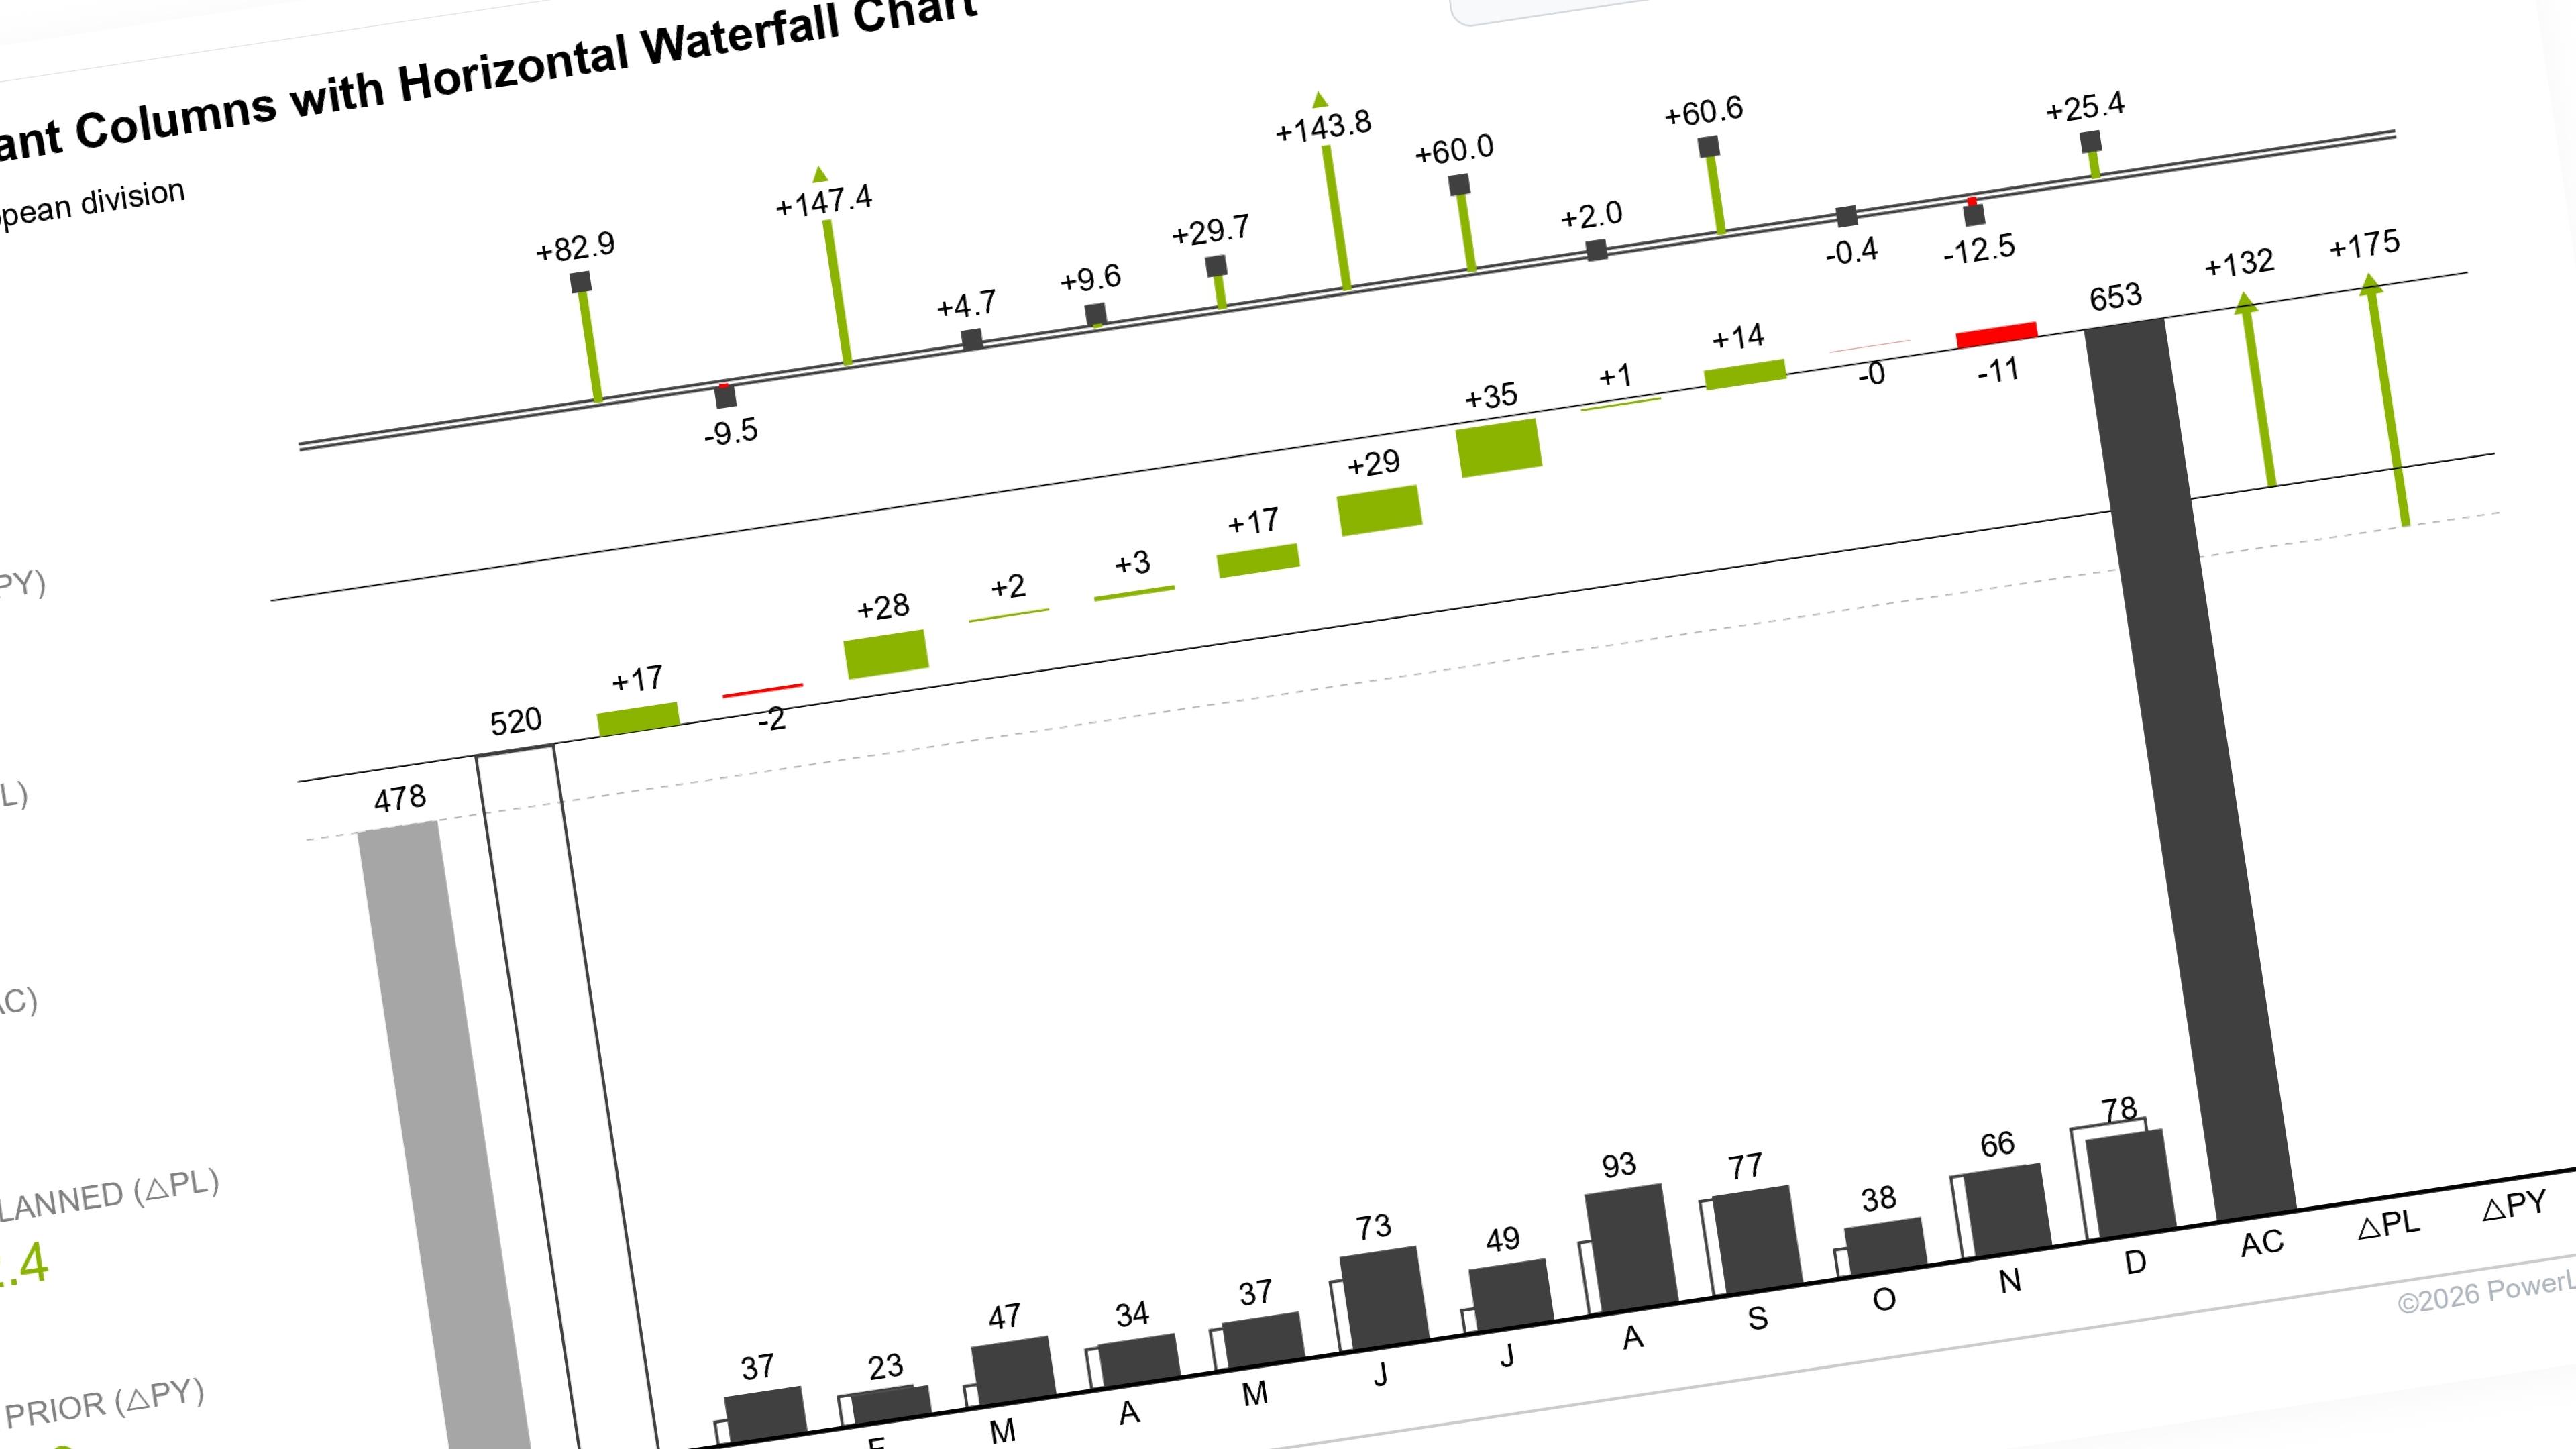
Foreword: Expanding to Three-Scenario Comparisons (AC, PY, and PL)
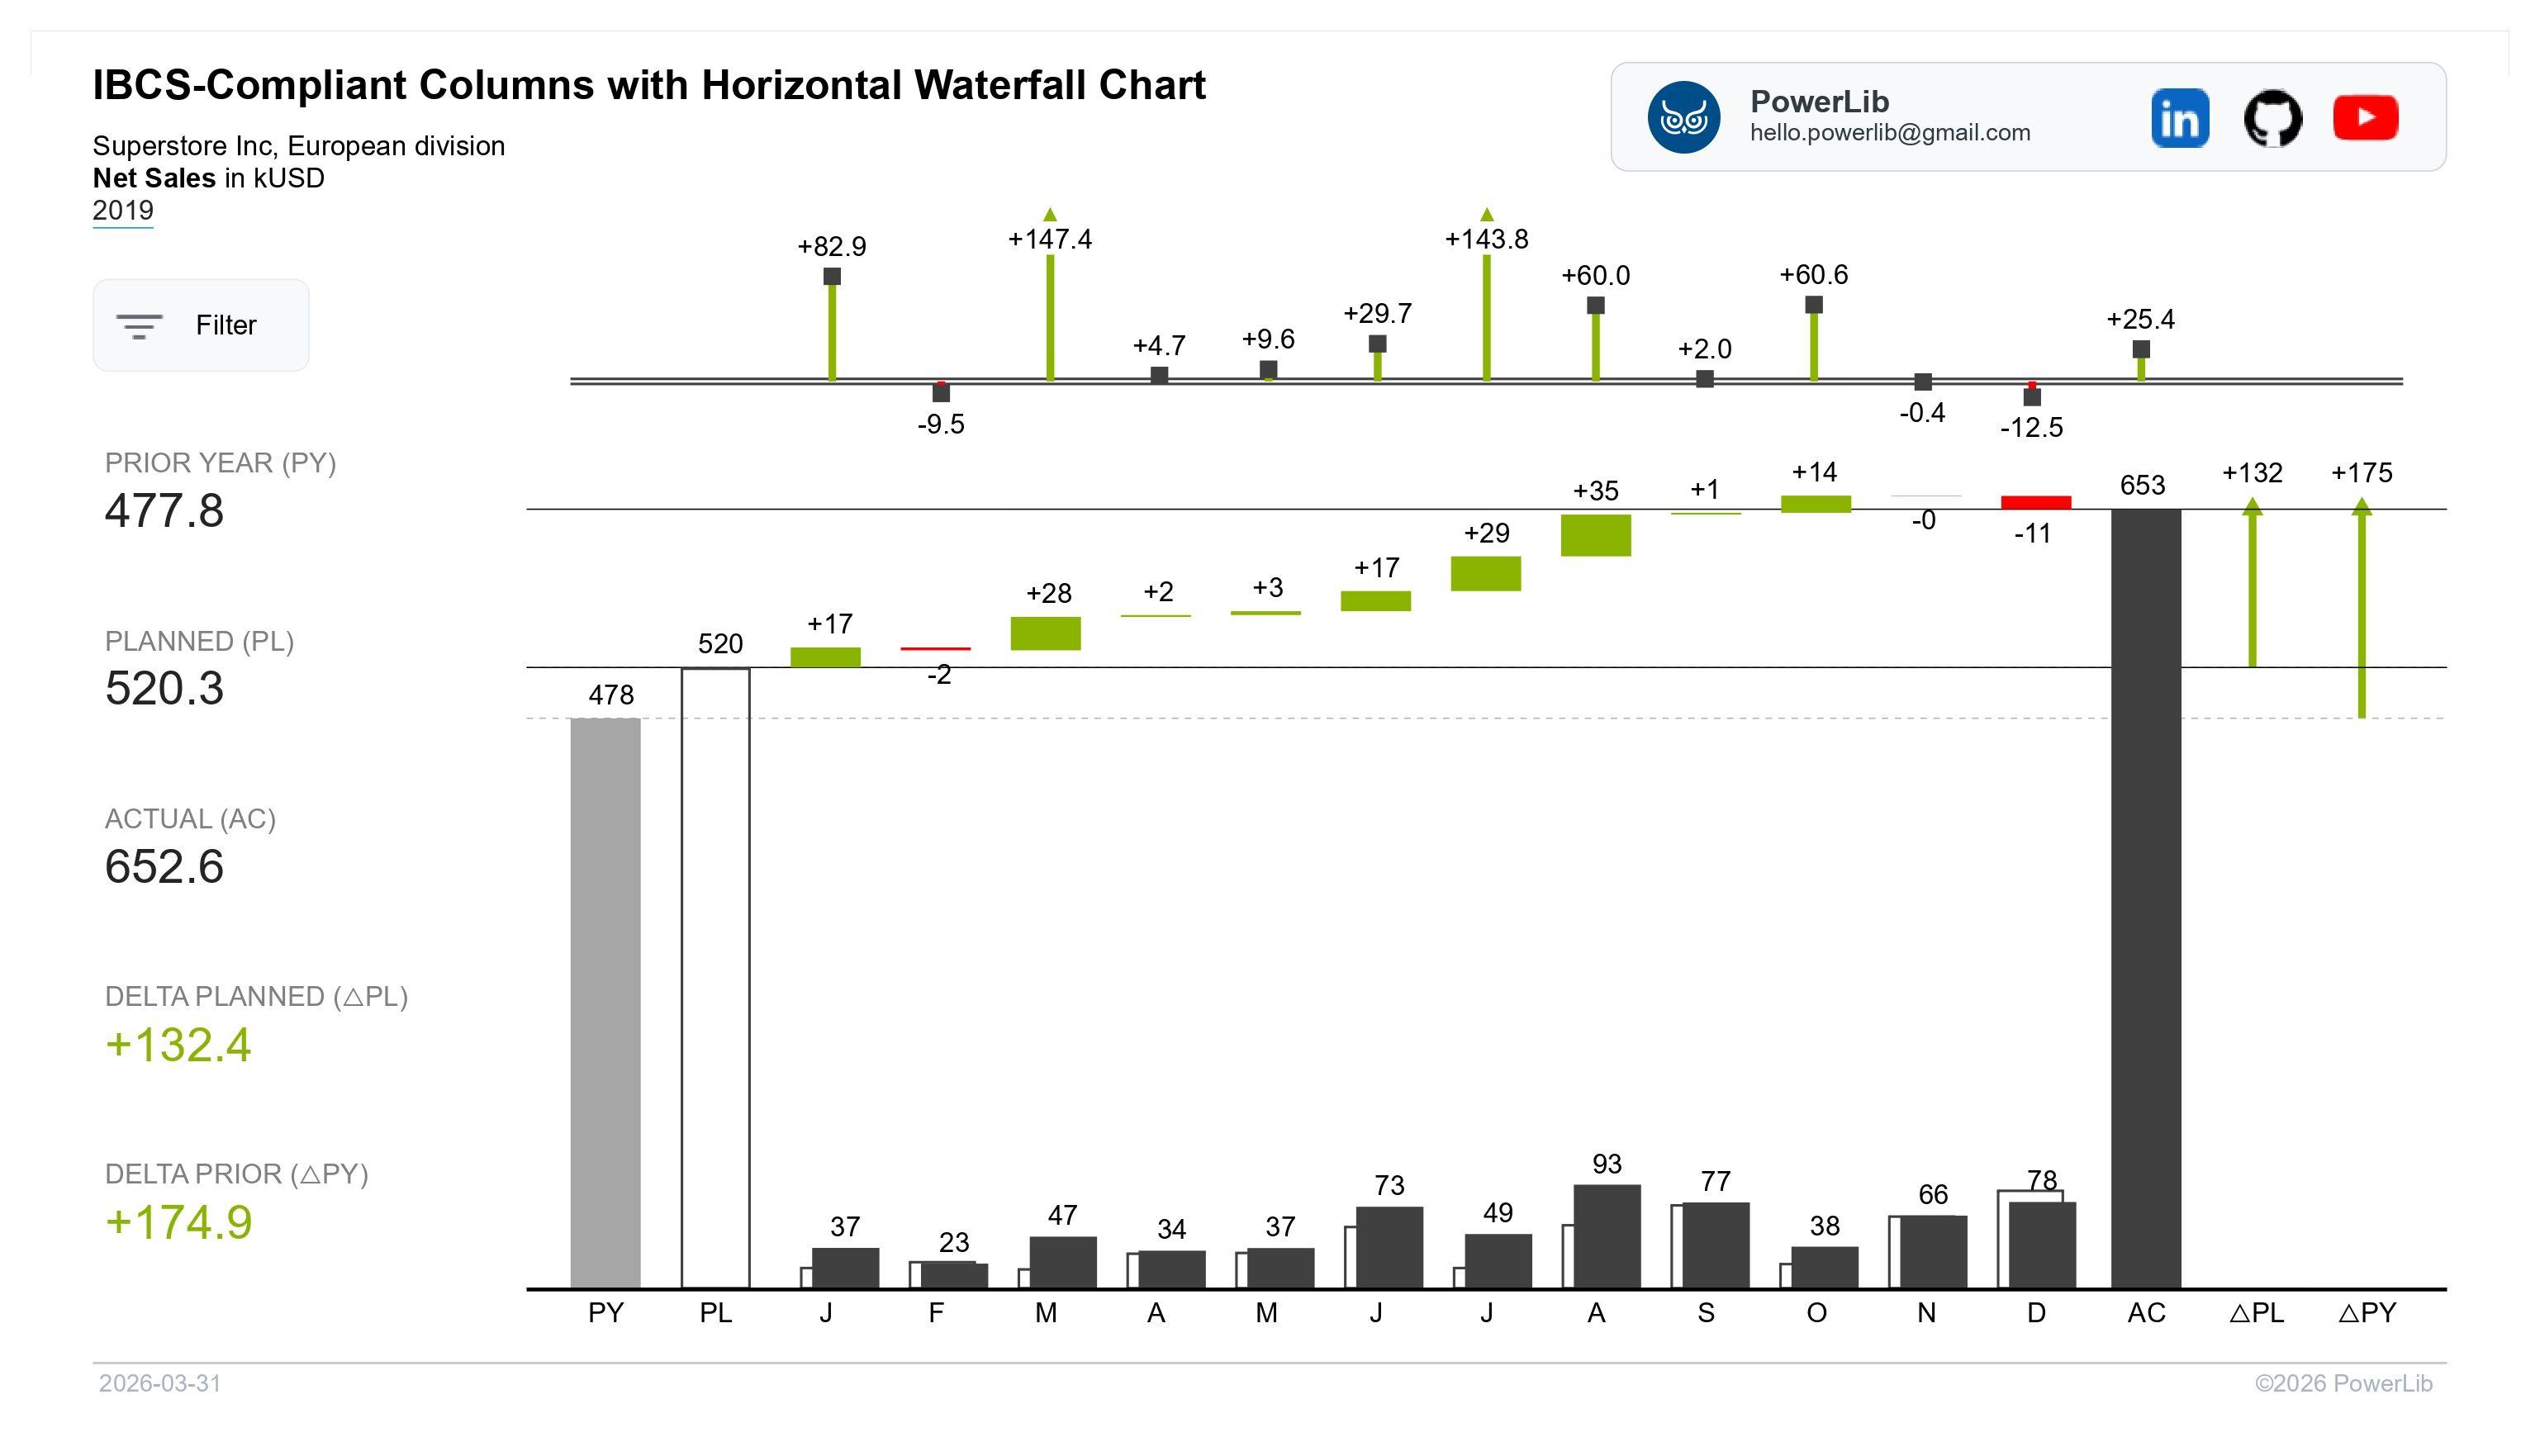
This documentation builds upon the IBCS-compliant Columns with Waterfall Chart, moving from a dual-scenario comparison (Actual vs. Previous Year) to a robust three-scenario framework. In business reporting, it is standard to analyze three distinct data layers:
-
AC (Actual): Your current performance.
-
PY (Previous Year): Performance from the same period last year.
-
PL (Plan): Your established targets or budget.
To integrate the Plan (PL) scenario into your existing waterfall skeleton and enable dynamic switching, we will implement the following updates:
The rest of this walkthrough is for members
You have read the problem. What is behind the paywall is the fix:
- The full step-by-step build, from measures to formatting
- Every DAX measure with the reasoning behind it
- The .pbix with the model already wired up
PowerLib Insideror $99 a year — two months free$9.99 / mo
Get accessAlready a member? Sign in with your email