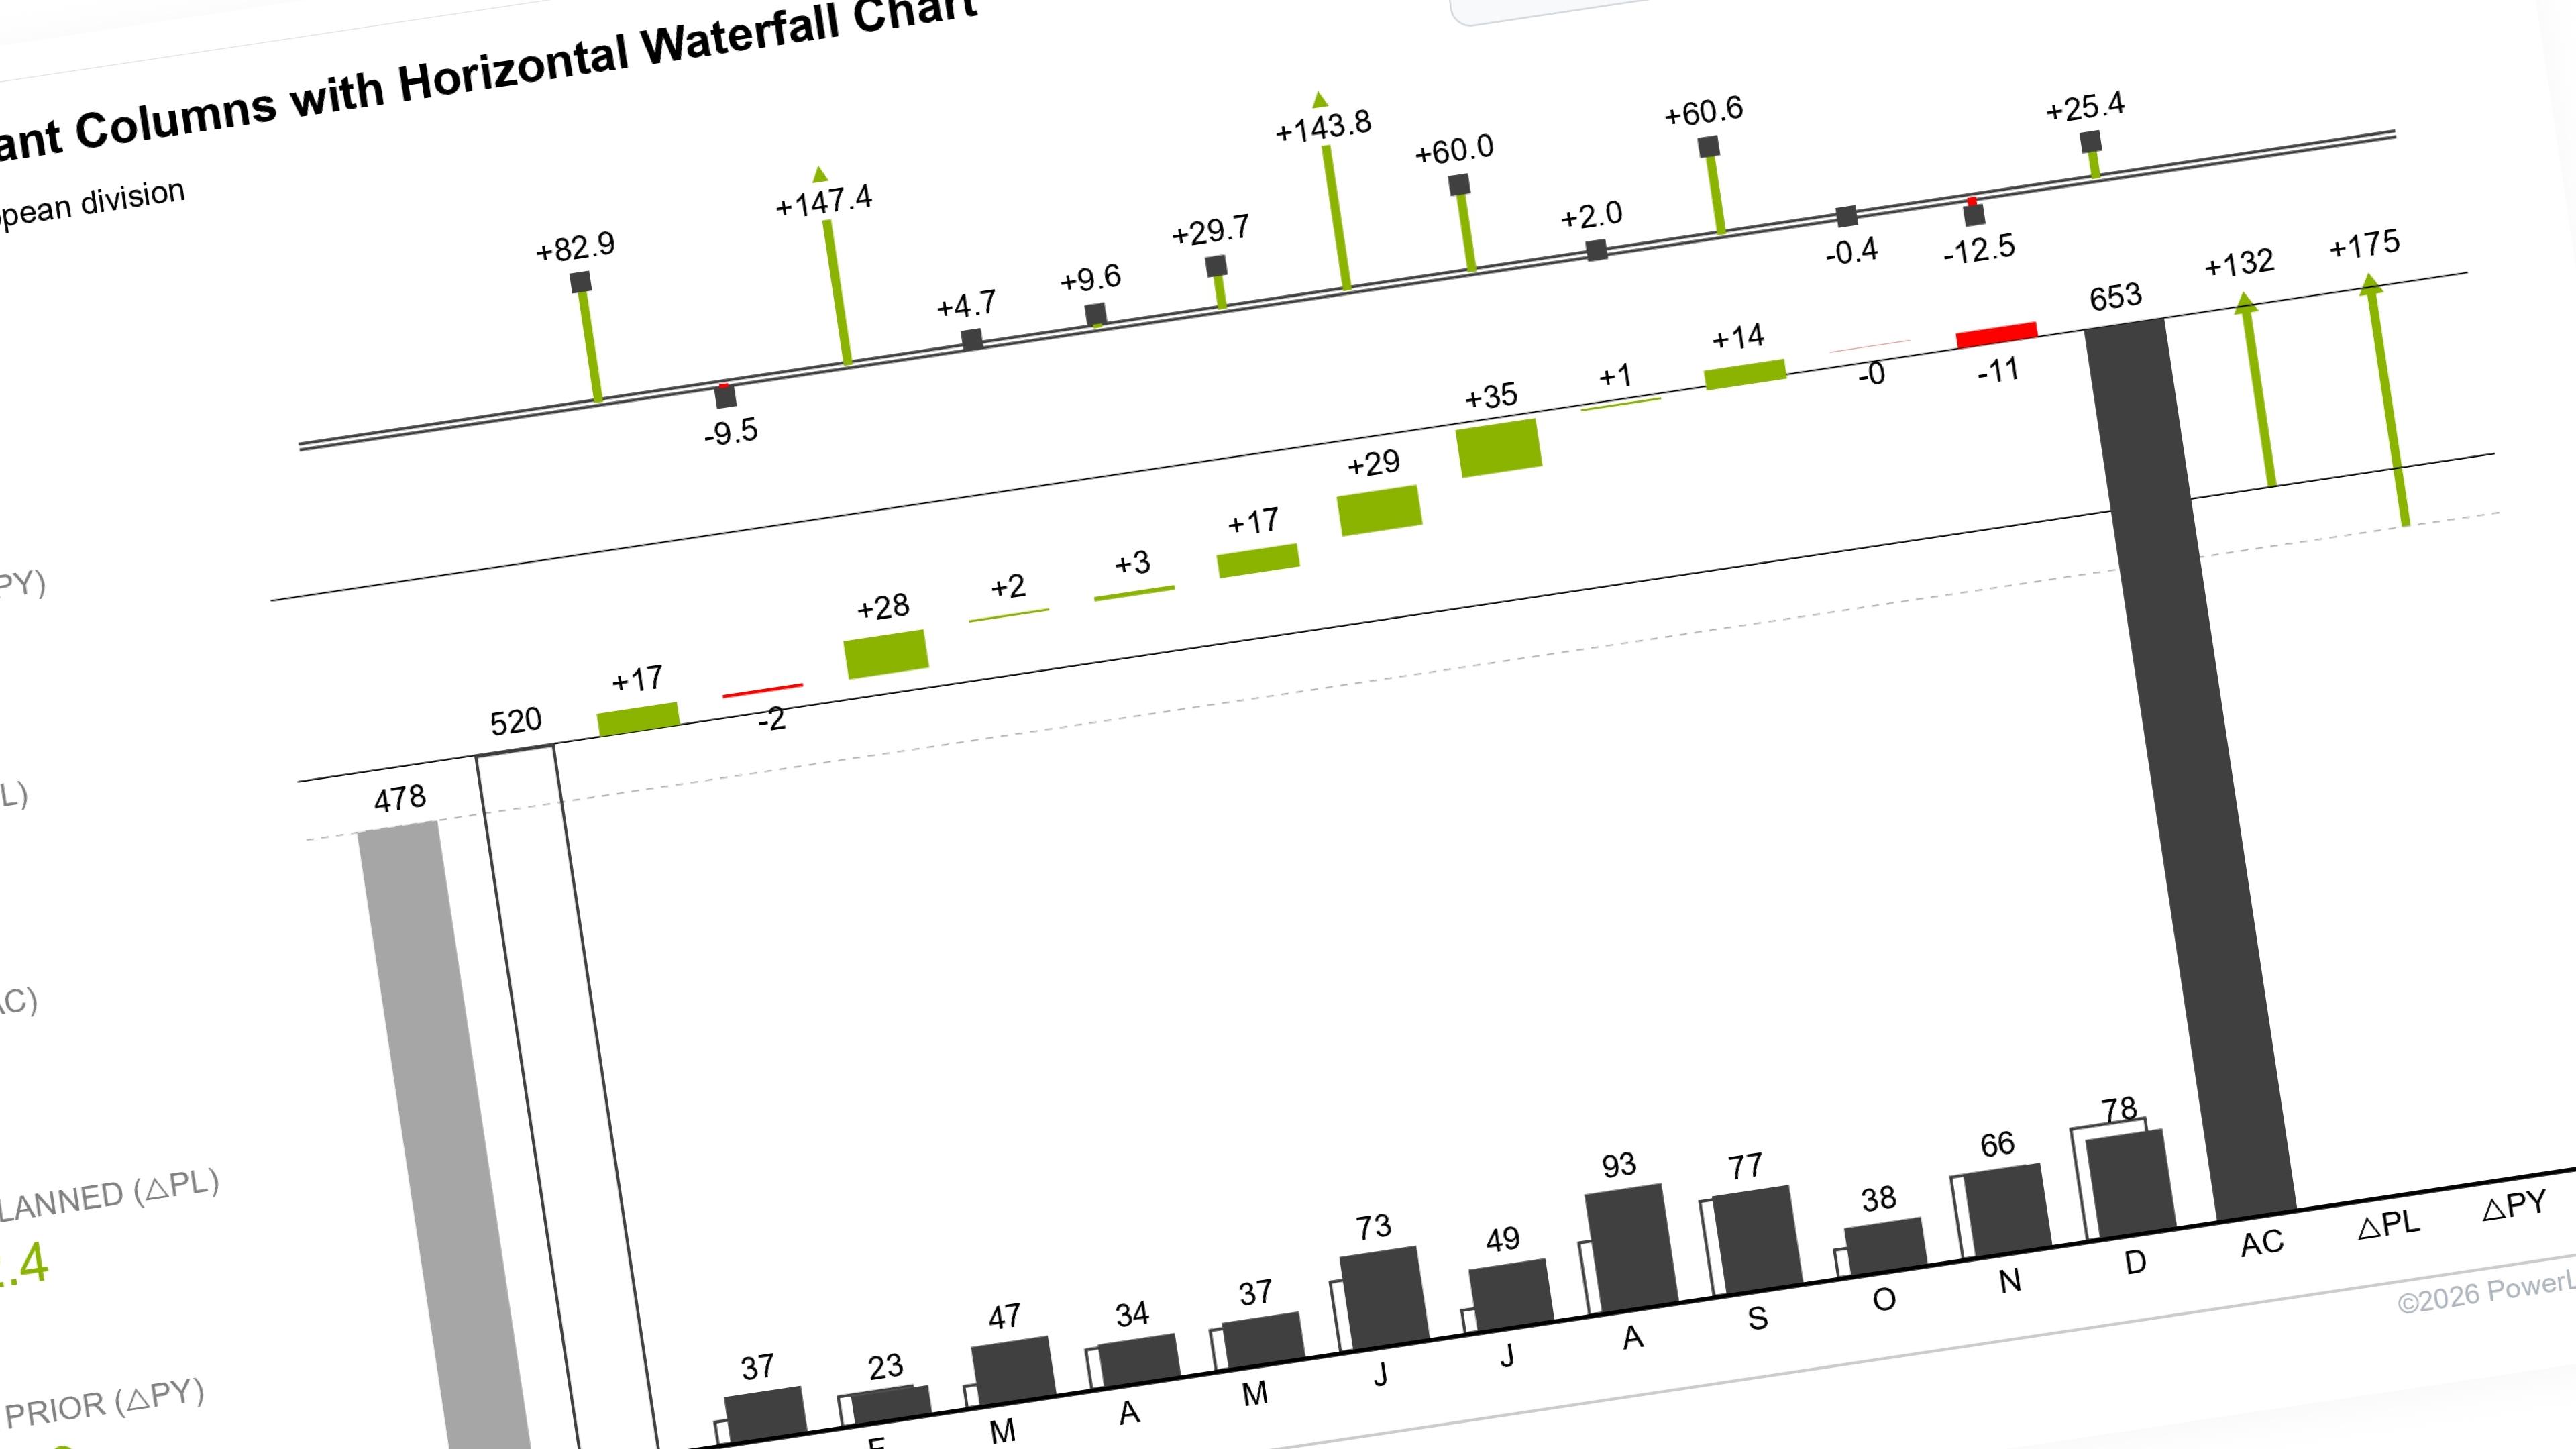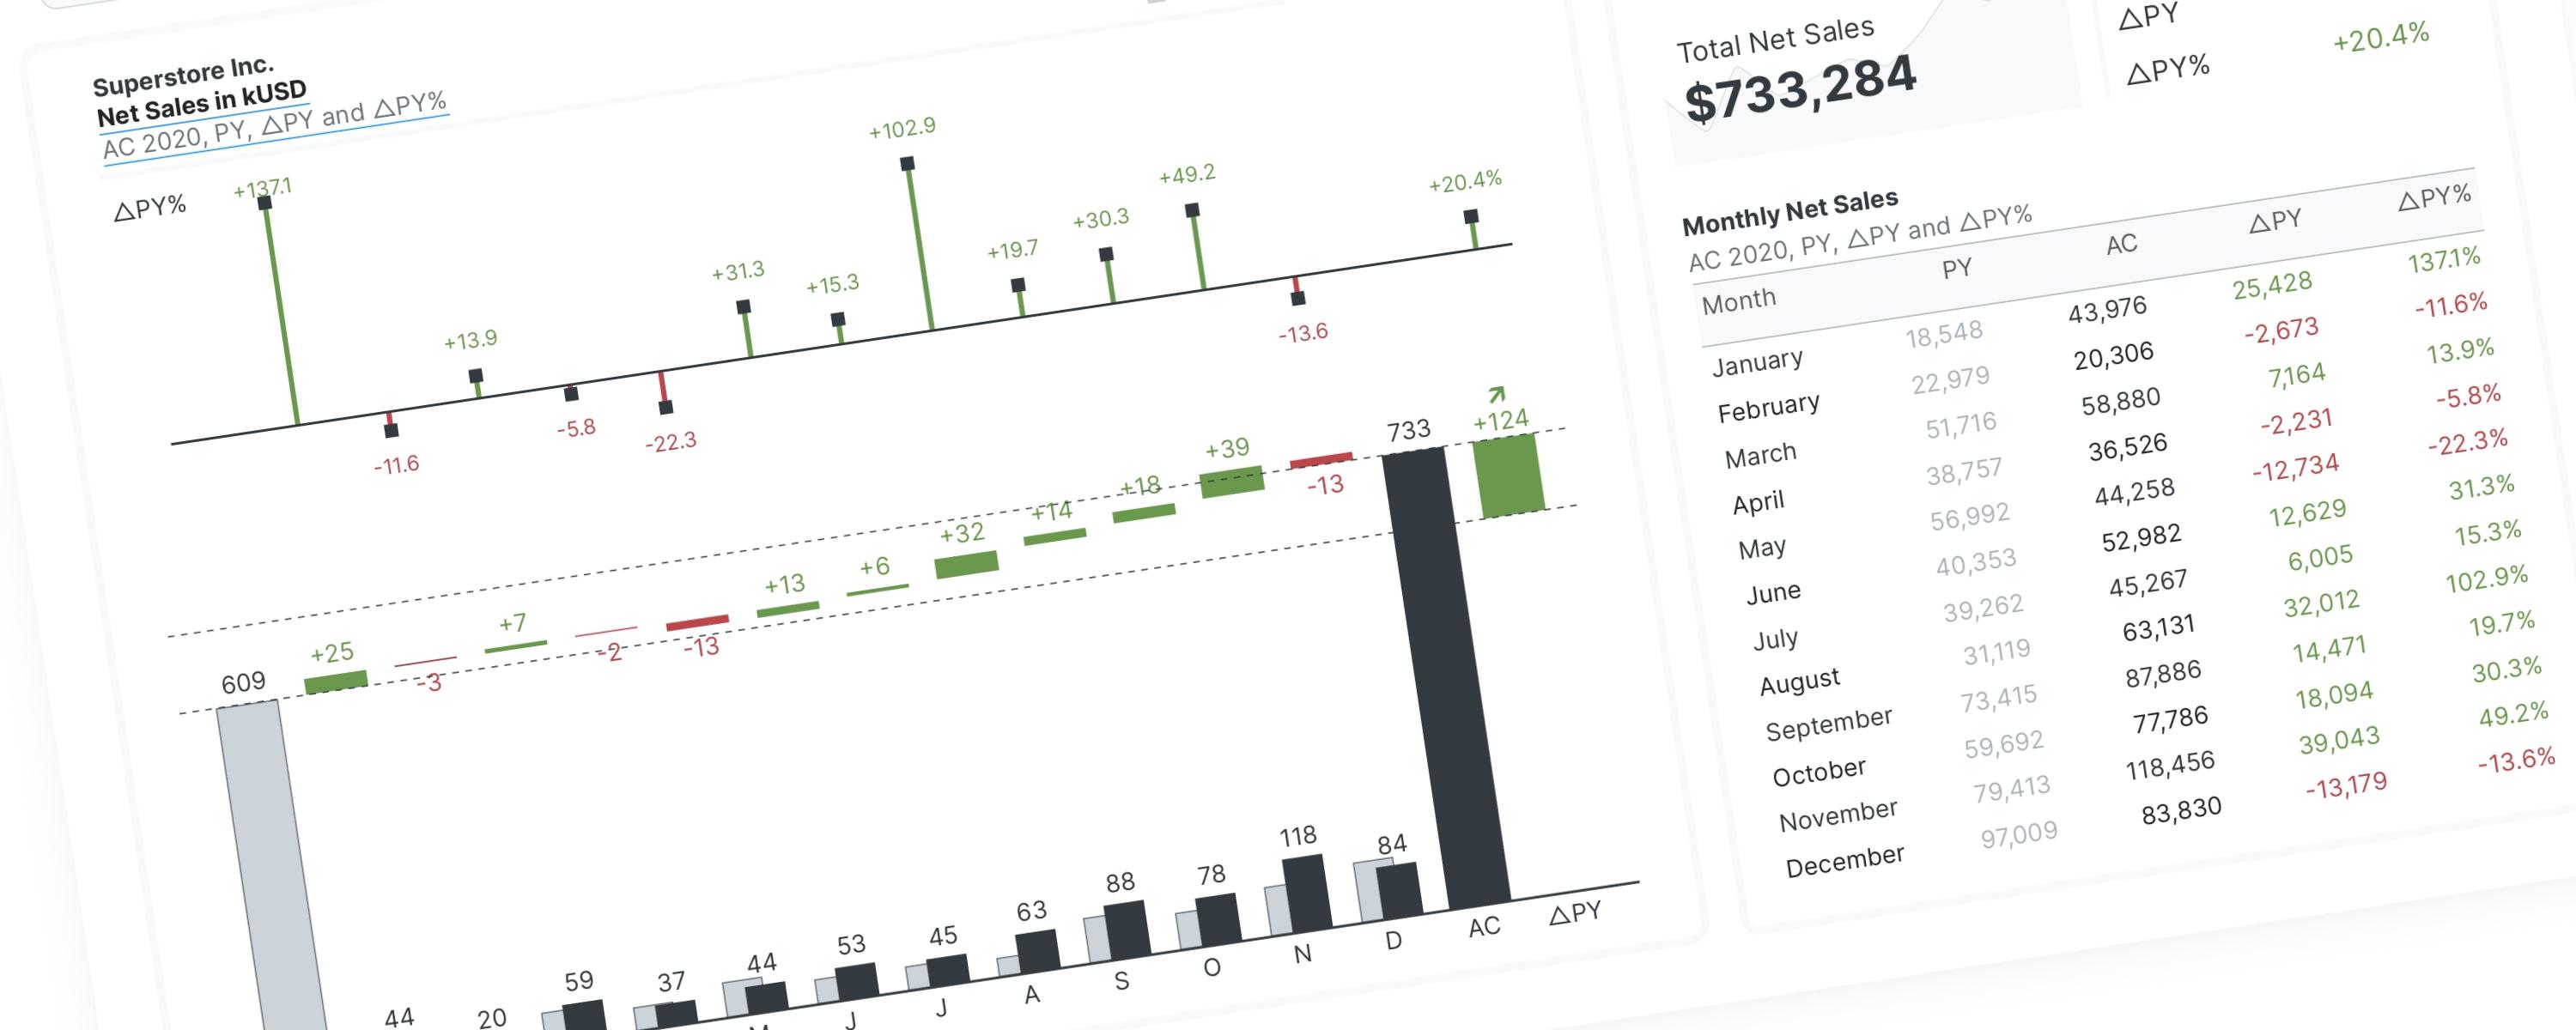
Understanding the Concept
You can find my explanation of the IBCS horizontal waterfall chart's construction logic in Power BI on LinkedIn:
IBCS Horizontal Waterfall Chart Construction in PBI | Iwa Sanjaya
The basic idea is straightforward. Since the native Power BI waterfall chart can't achieve the required IBCS visualization, a stacked column chart as a smart workaround is used by simply relying on the stacking feature to make the net change columns "float."
The rest of this walkthrough is for members
You have read the problem. What is behind the paywall is the fix:
- The full step-by-step build, from measures to formatting
- Every DAX measure with the reasoning behind it
- The .pbix with the model already wired up
PowerLib Insideror $99 a year — two months free$9.99 / mo
Get accessAlready a member? Sign in with your email