LineFree
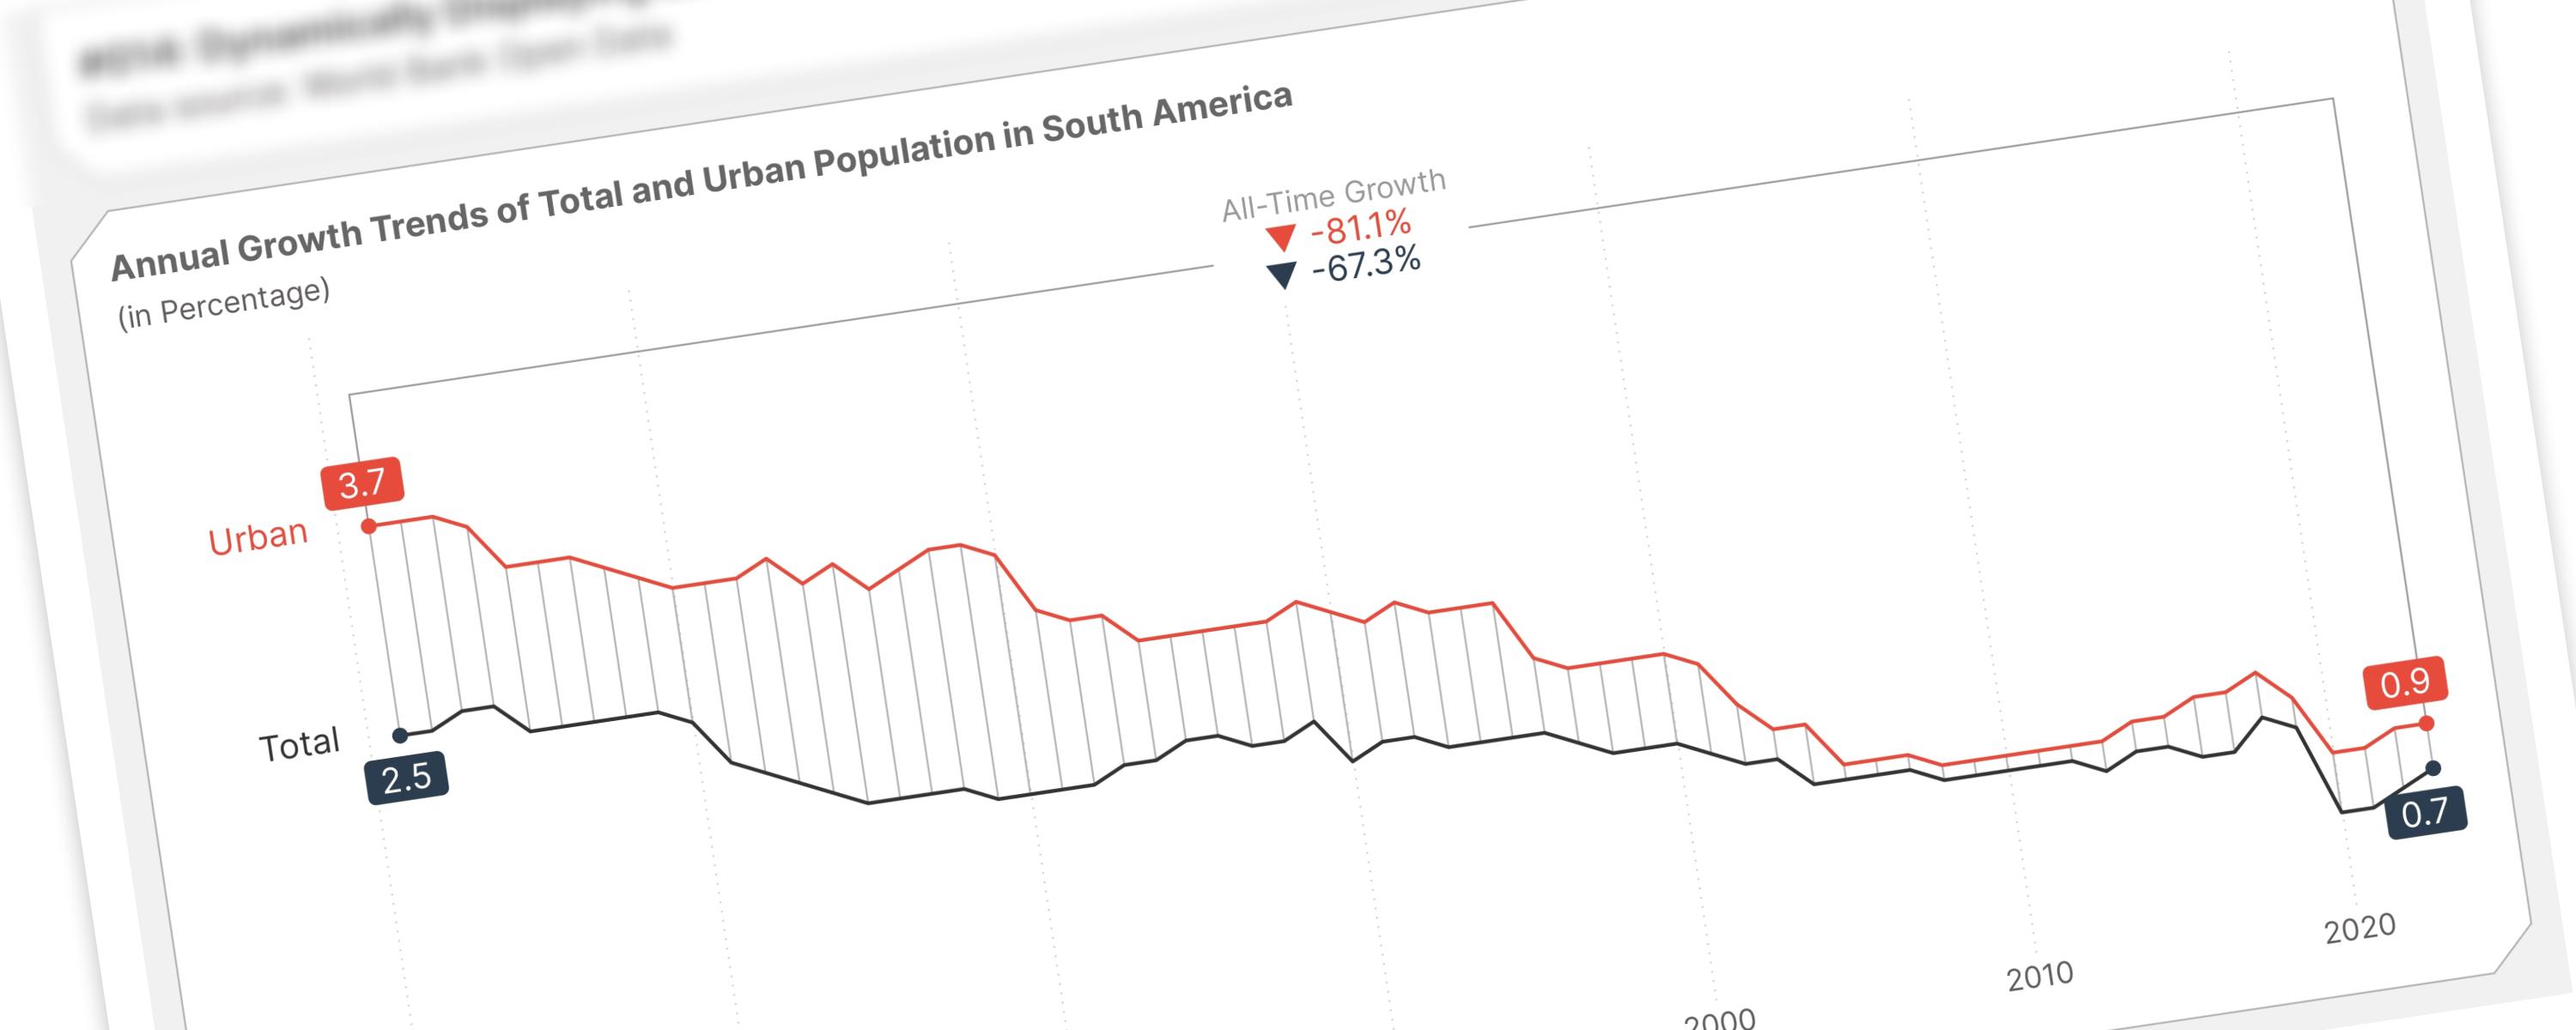
Dynamically Displaying Earliest, Latest, and Growth Over Time with a Year Slicer
This documentation provides a guide on marking the earliest and latest selected years on a line chart and visualizing growth over time with reference lines.
Documented Power BI techniques — the model change, the DAX, and the exact visual settings. Most are free to read; the rest come with the model files for members.

LineFree
This documentation provides a guide on marking the earliest and latest selected years on a line chart and visualizing growth over time with reference lines.

BarFree
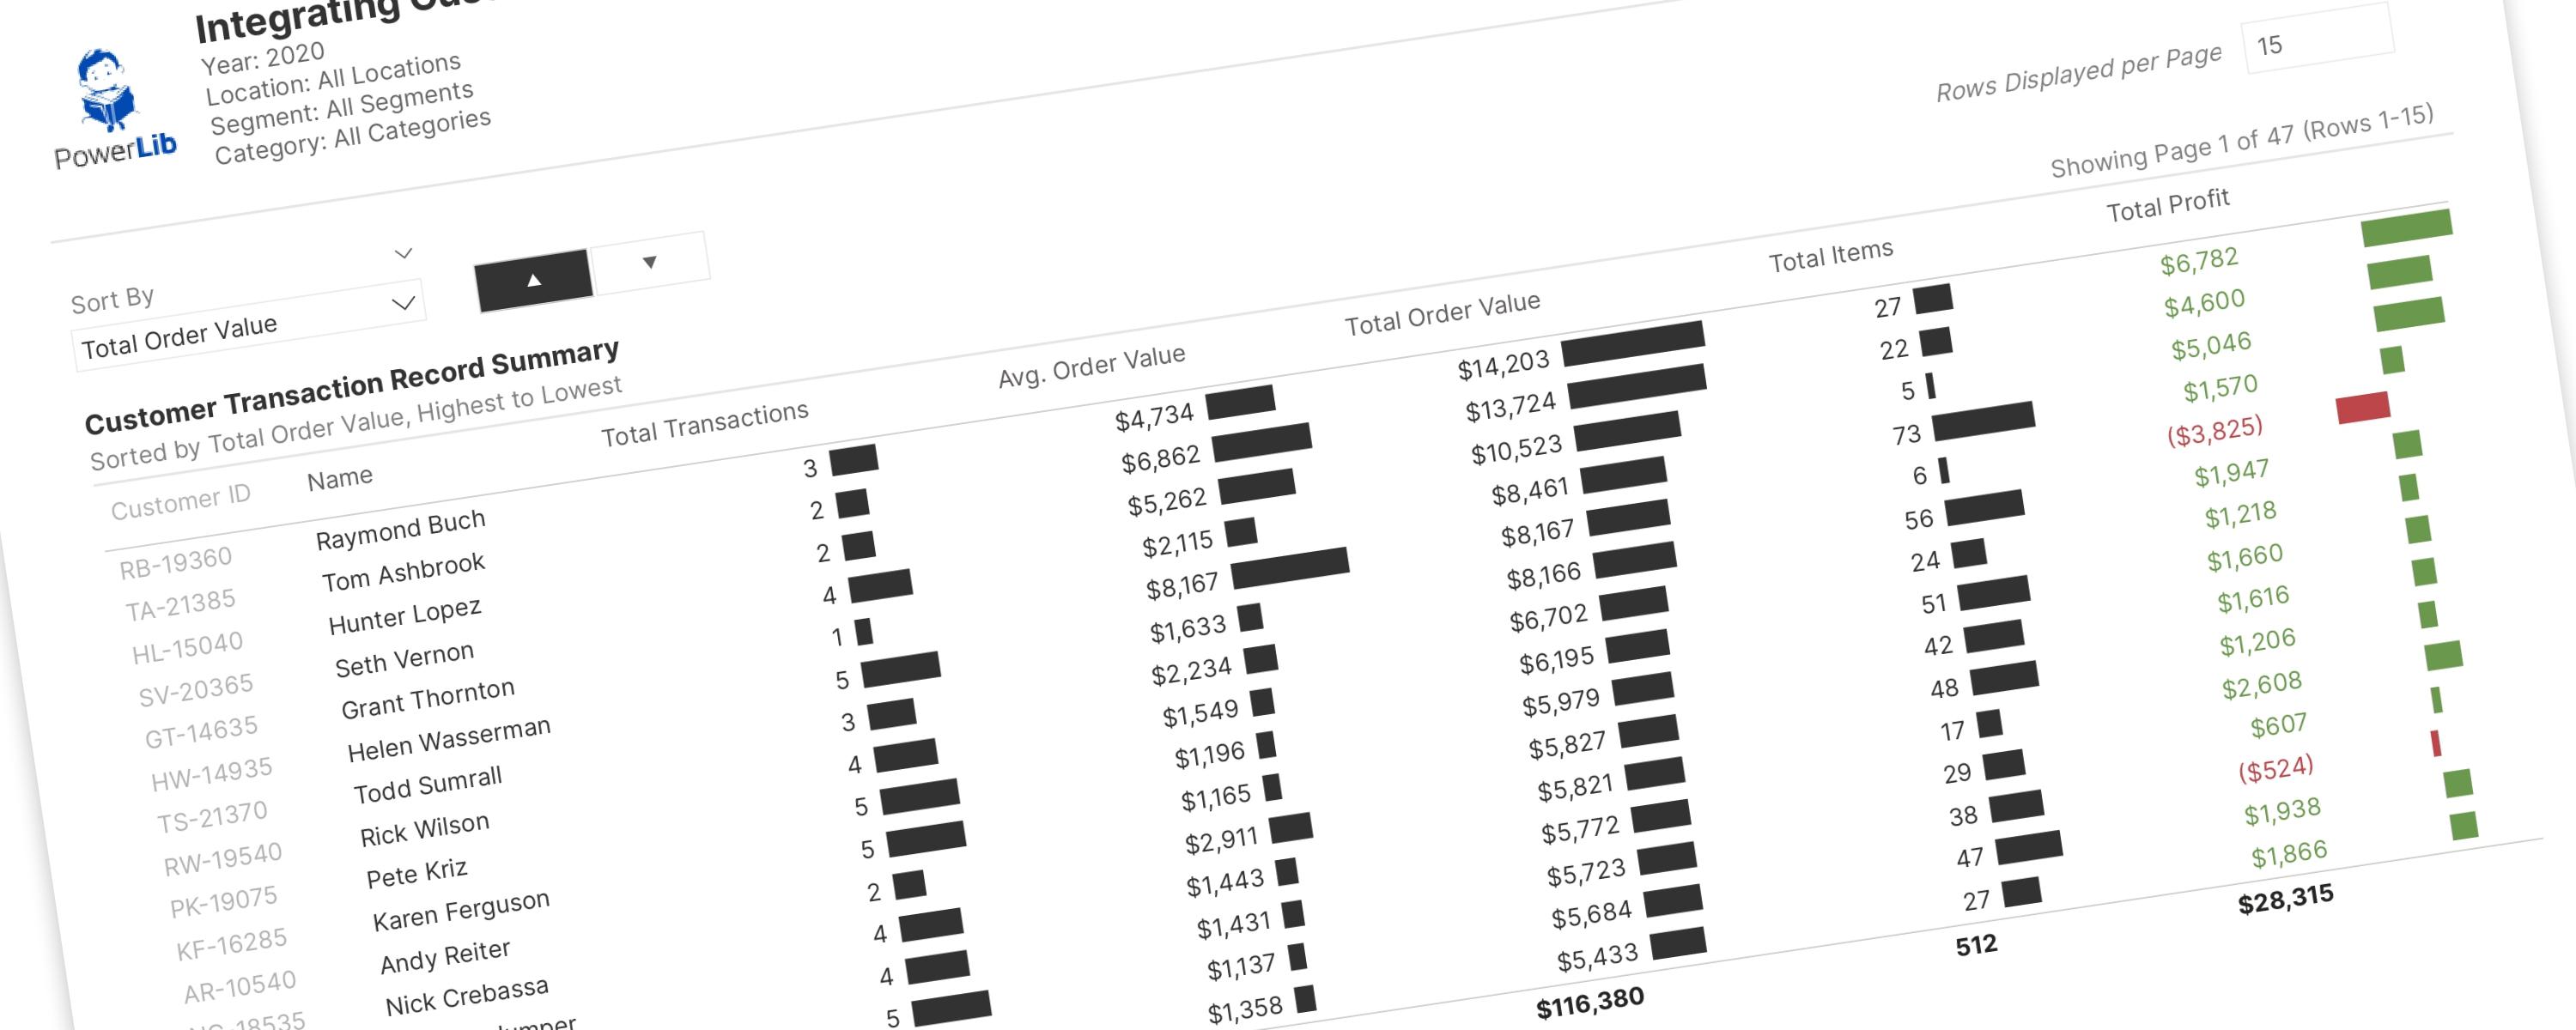
This documentation details advanced pagination techniques, extending my previous tutorial and documentation.

LineFree
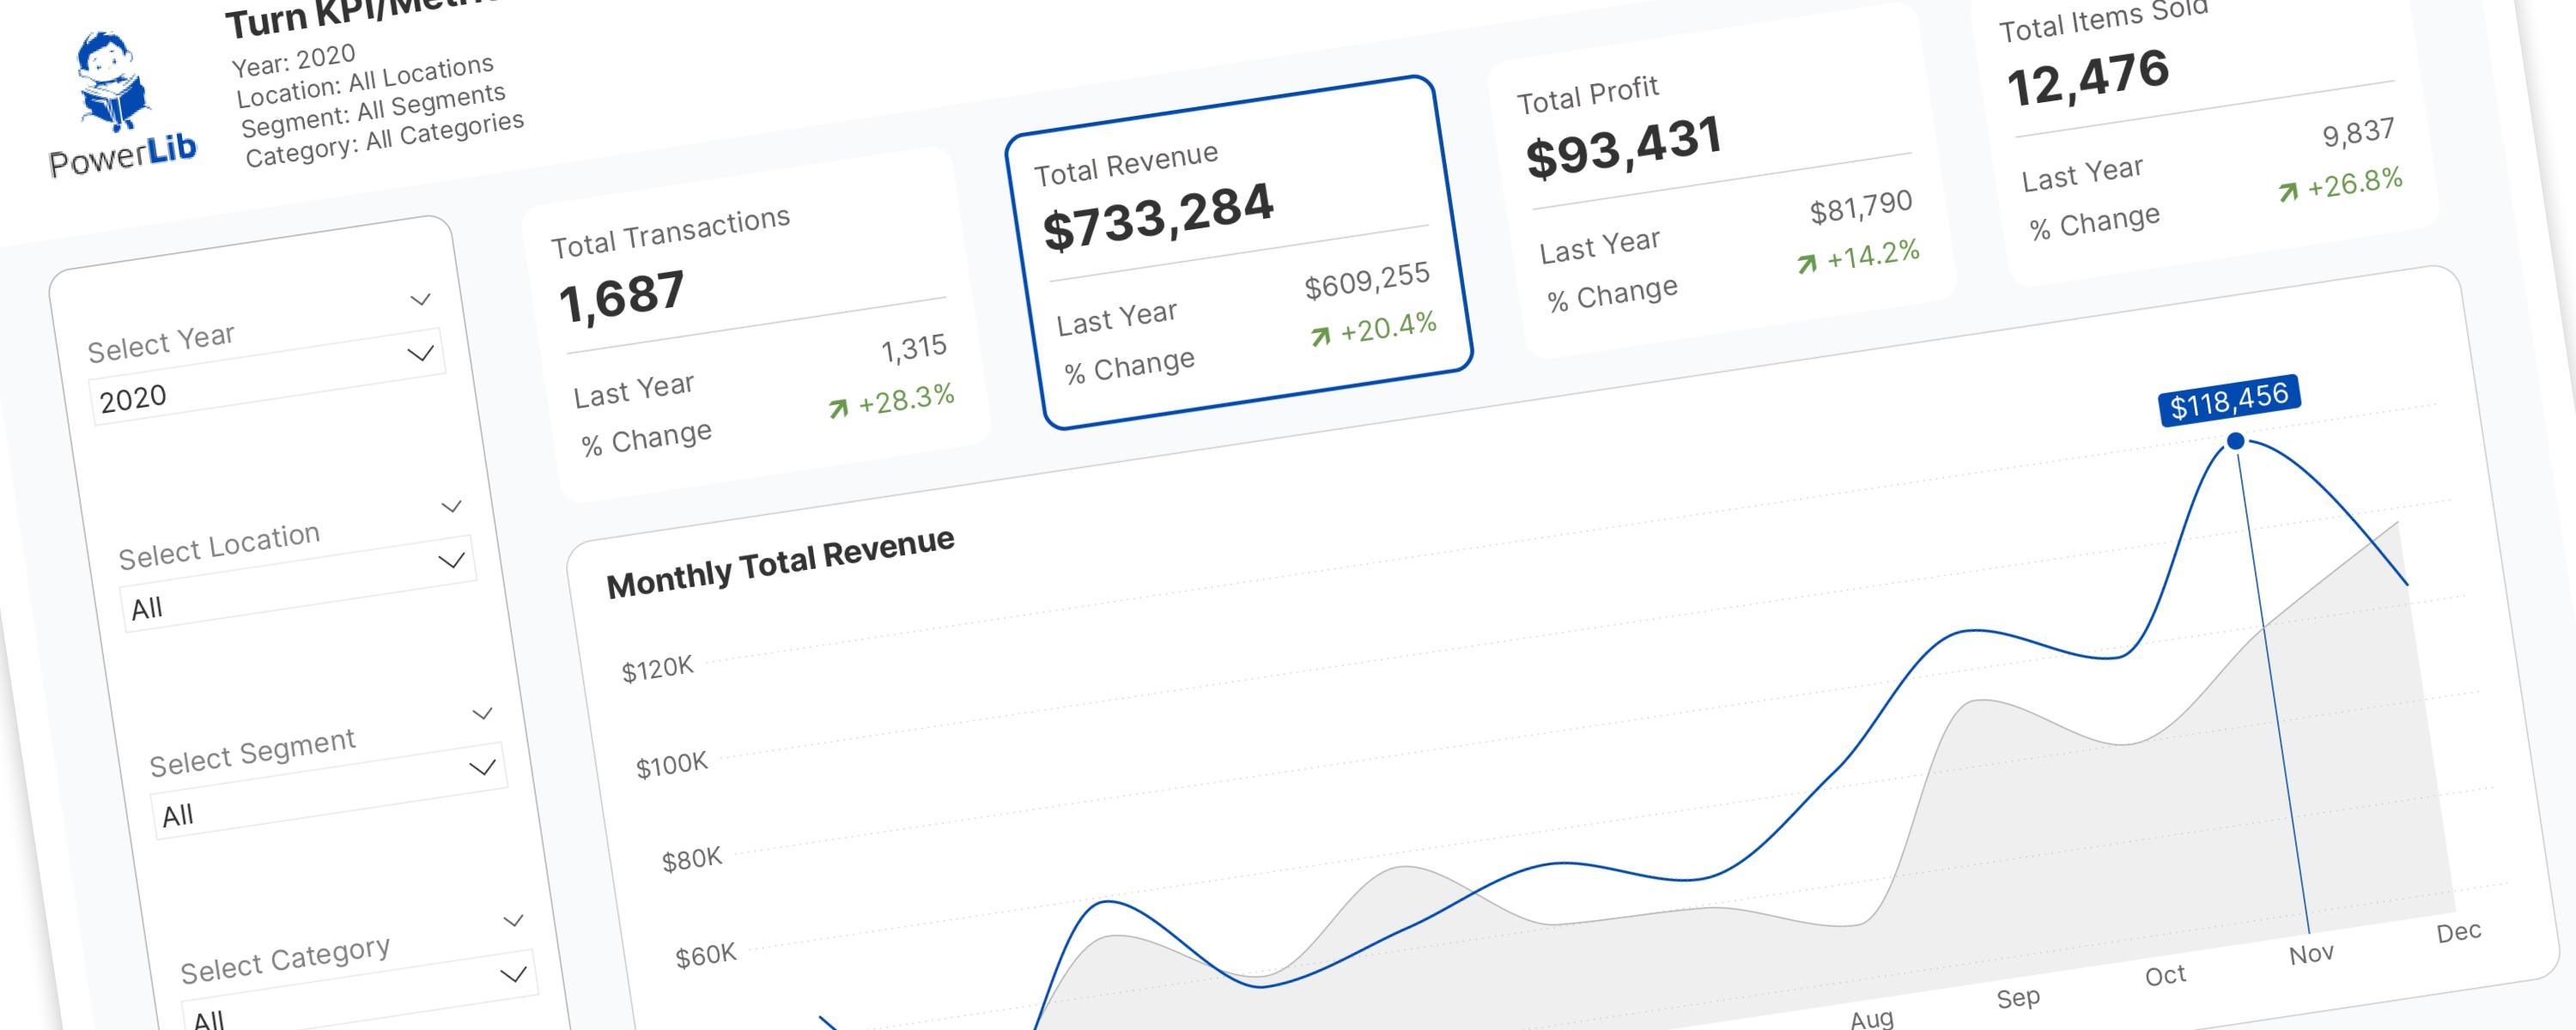
In the world of Power BI, Key Performance Indicator (KPI) and metric cards are essential.

BarFree
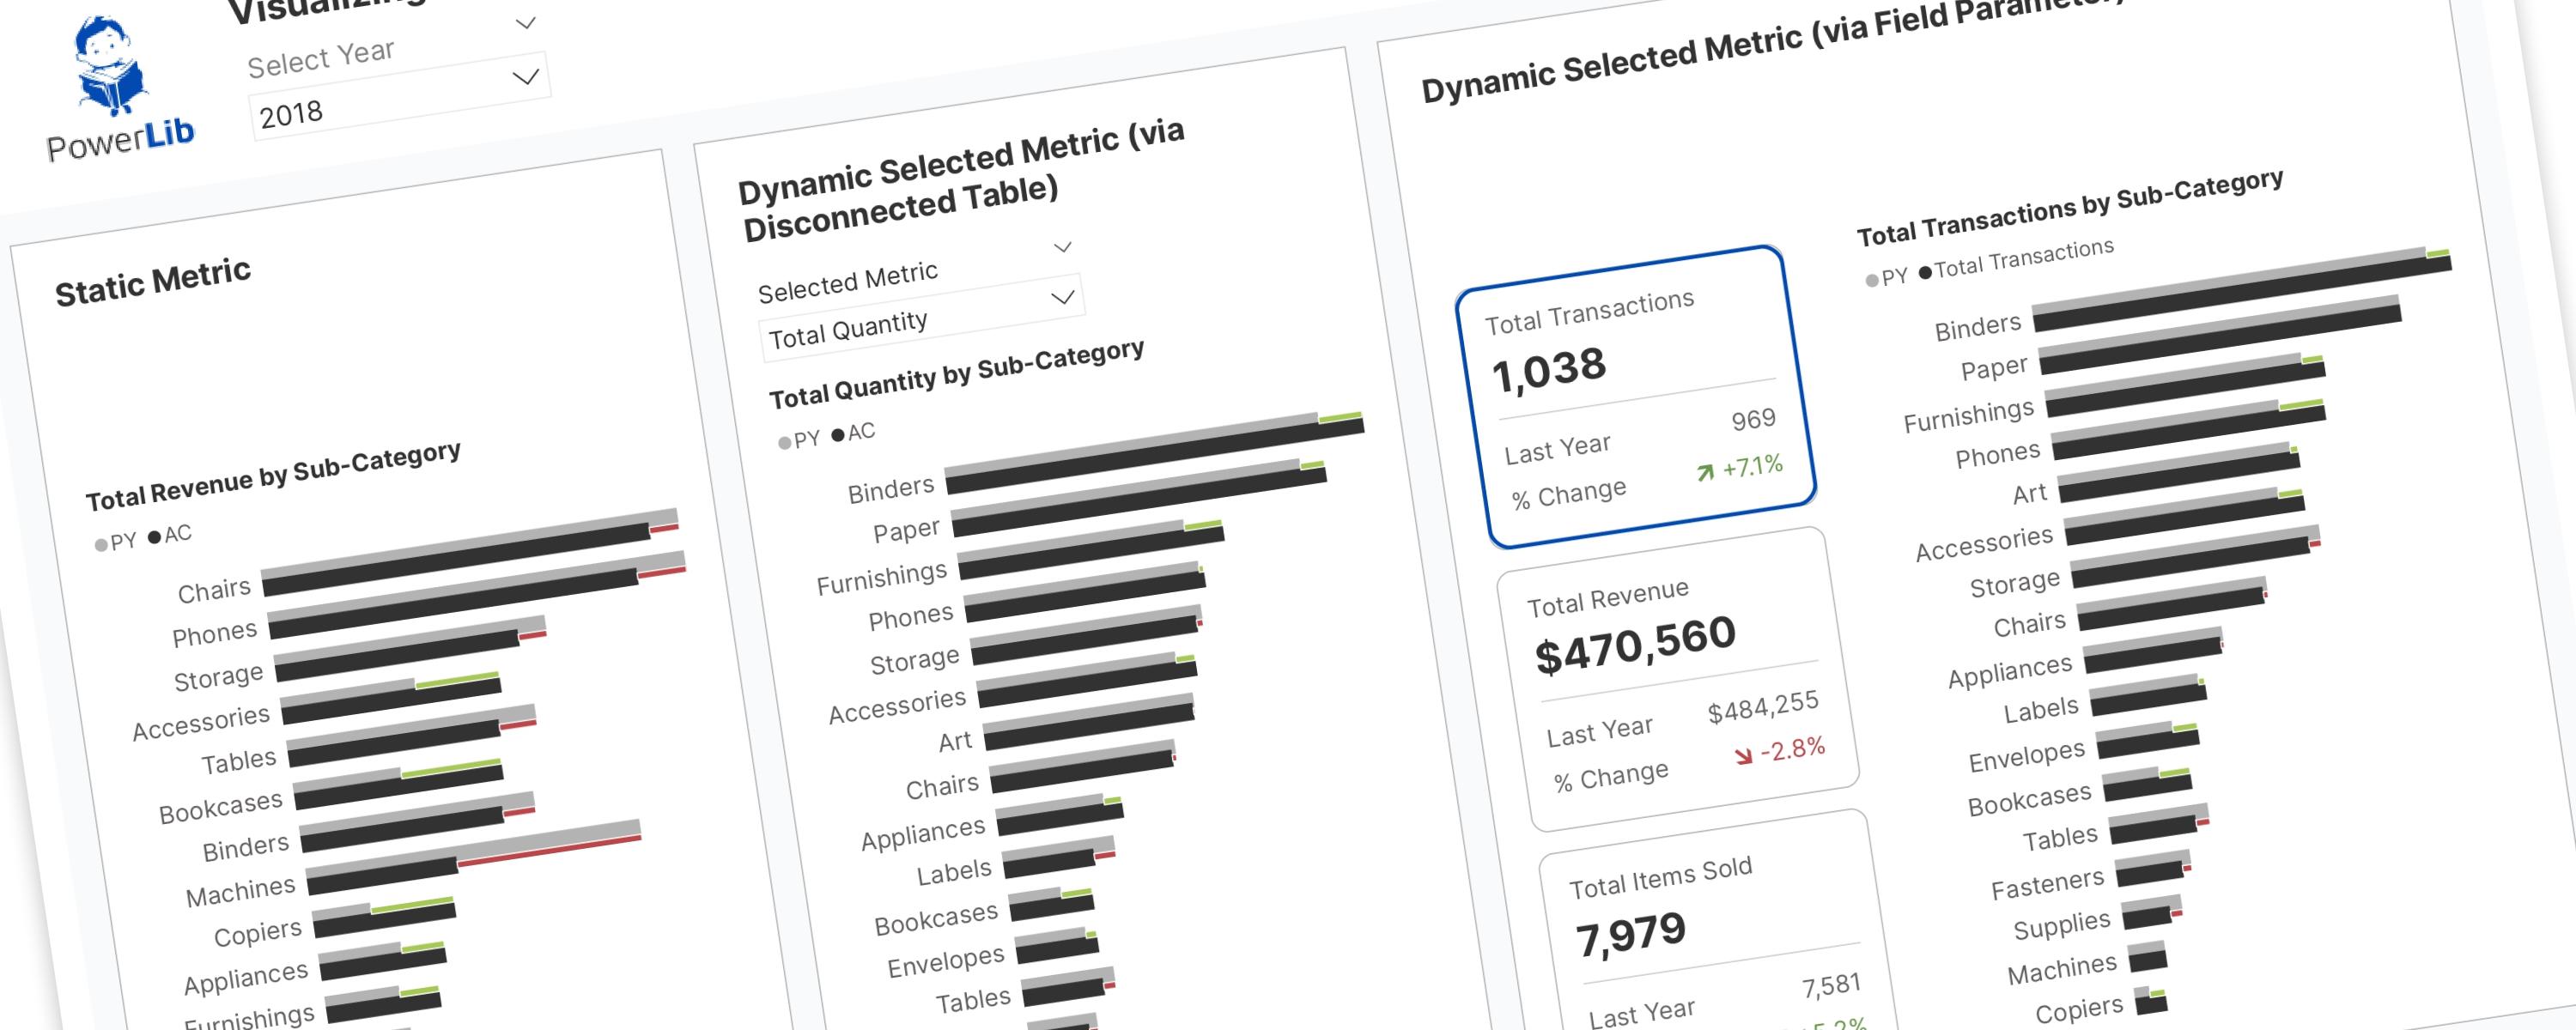
RETURN SWITCH( SelectedMetric, "Total Transactions", "Total Transactions by Sub-Category", "Total Revenue", "Total Revenue by Sub-Category", "Total Quantity", "Total Quantity by…

Donut/PieFree
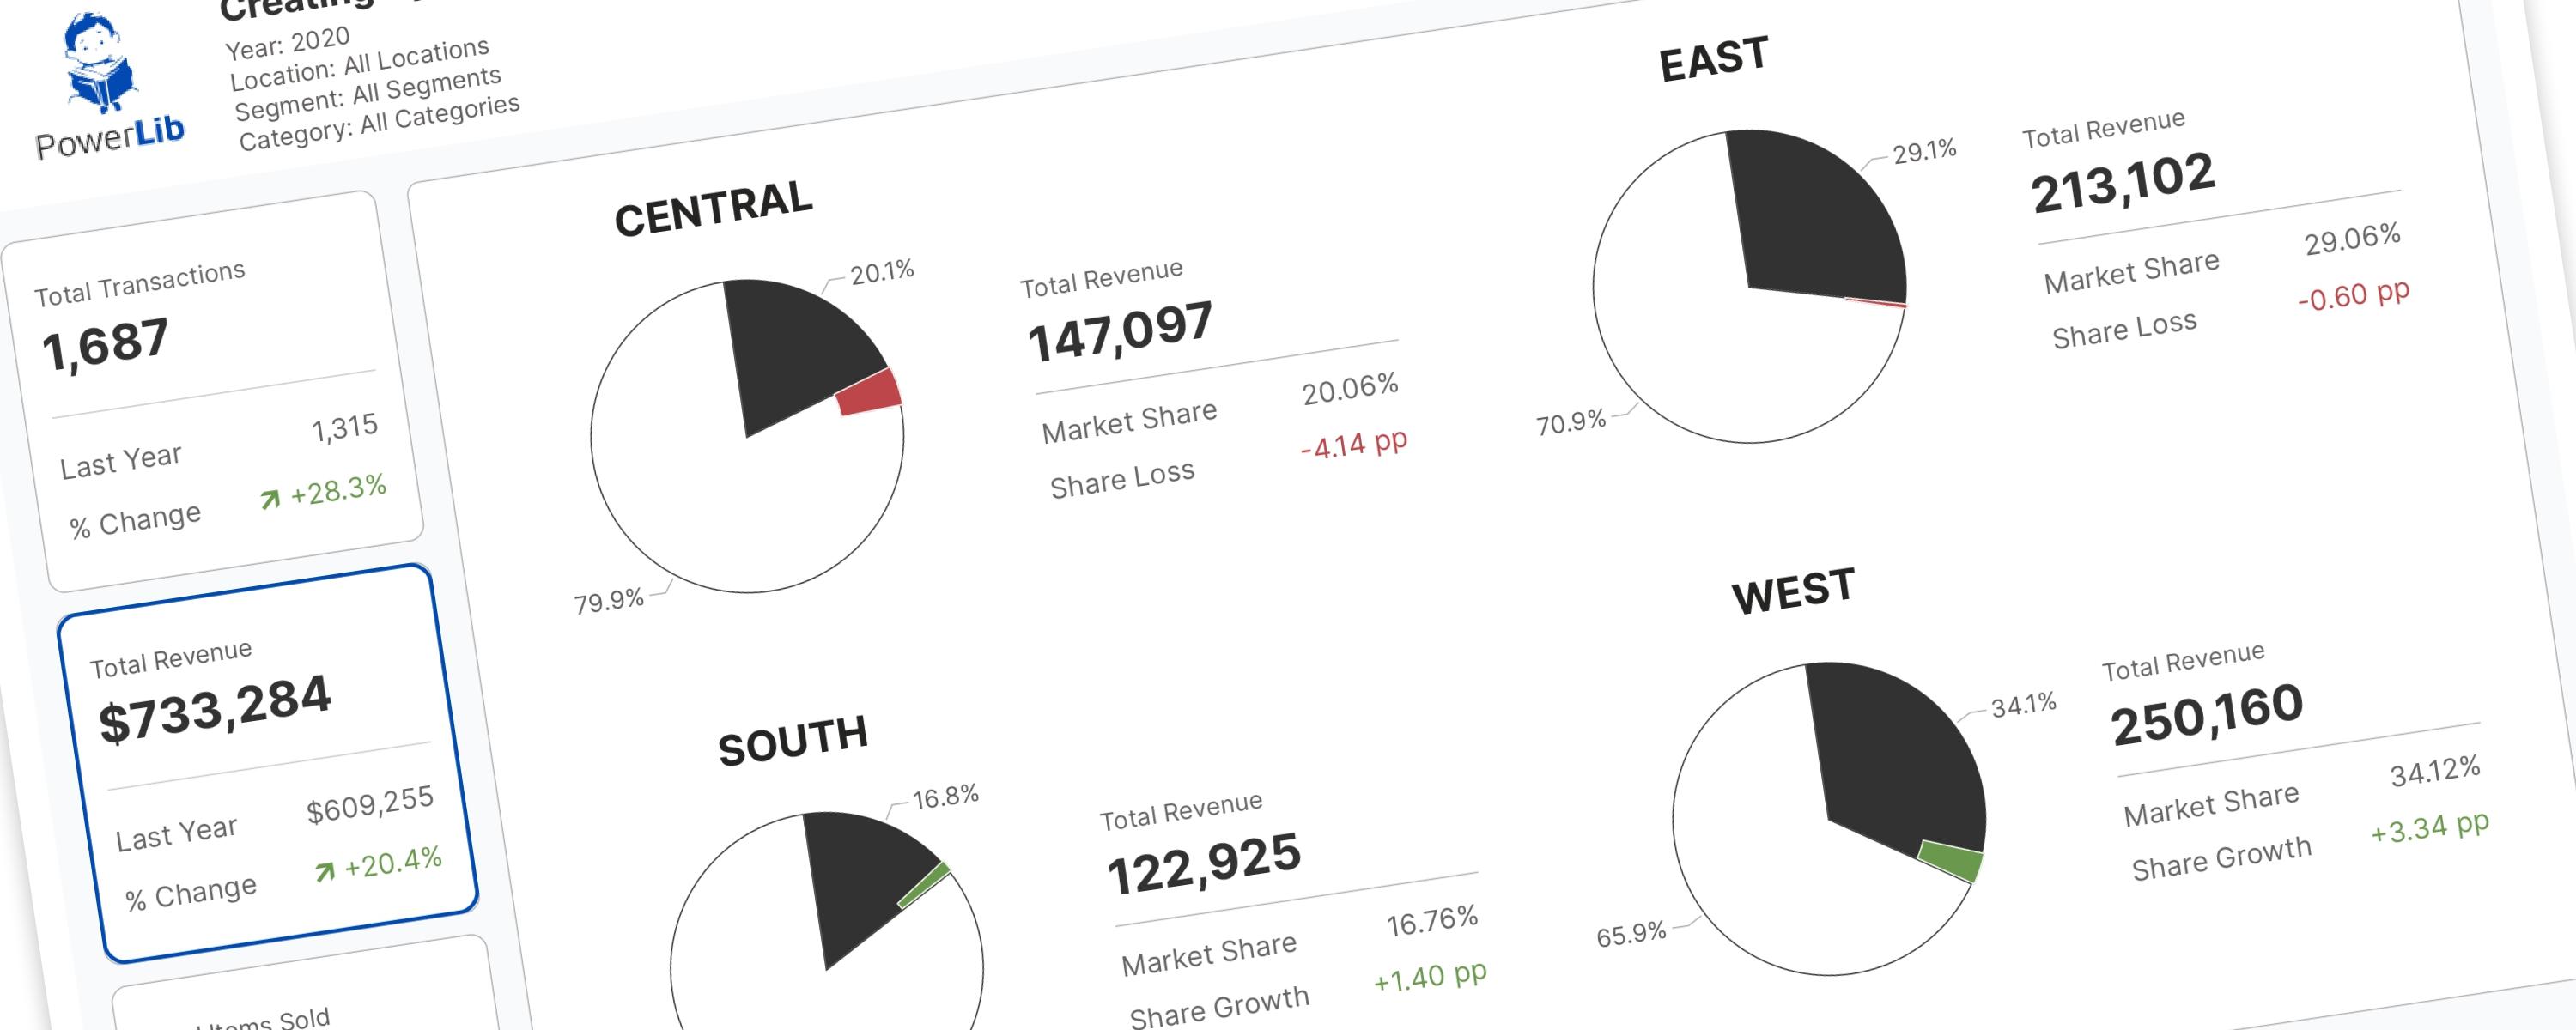
RETURN SWITCH( SelectedMetricOrder, -- Transaction Metrics 0, "Total Transactions", -- Revenue Metrics 1, "Total Revenue",

LineFree
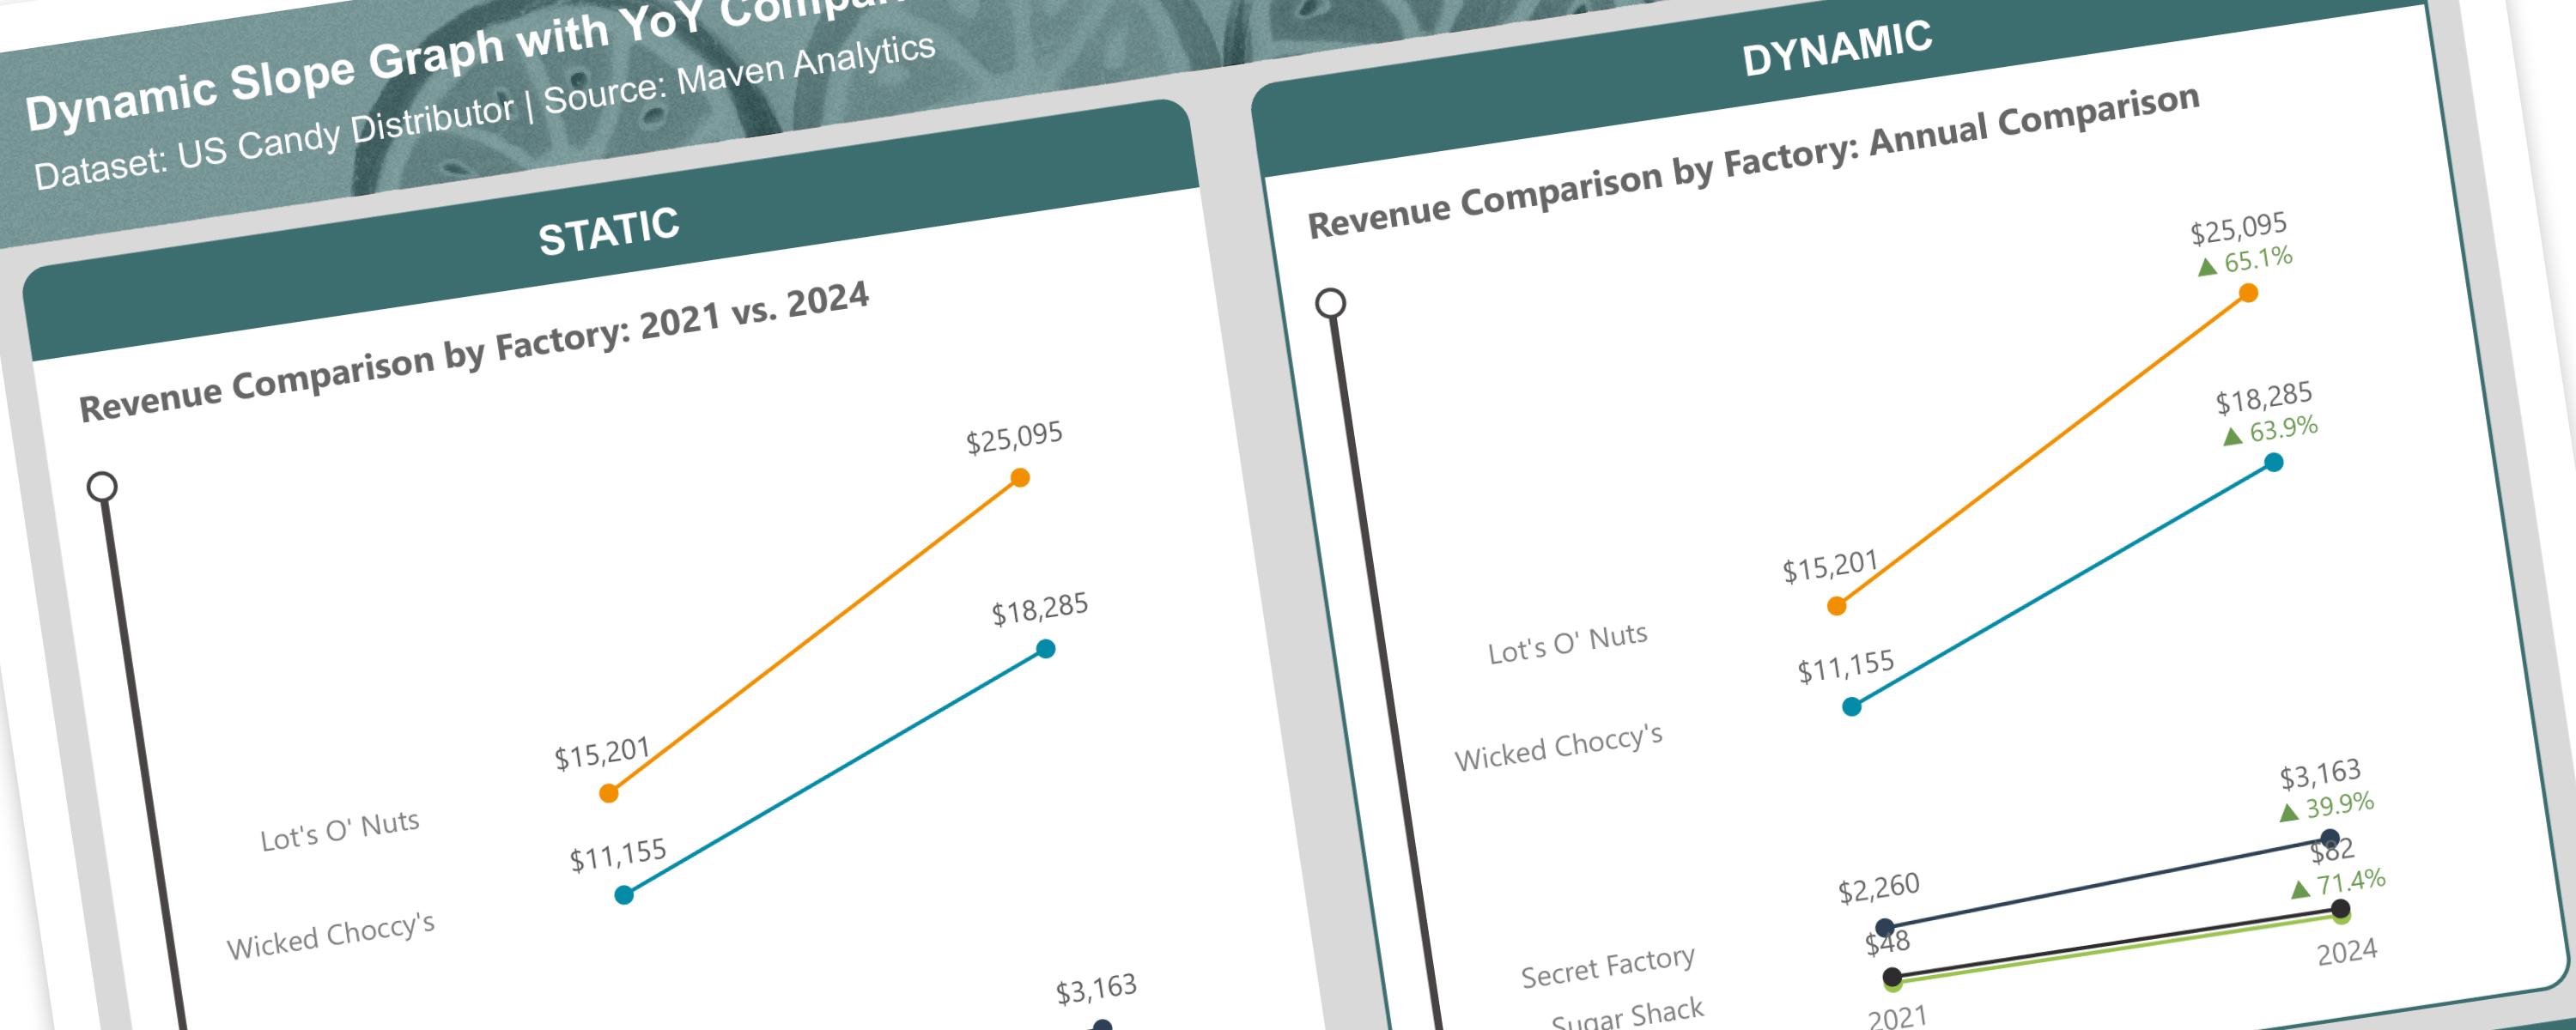
A slope graph is a type of line chart that shows changes between two points in time or two different states.

LineFree
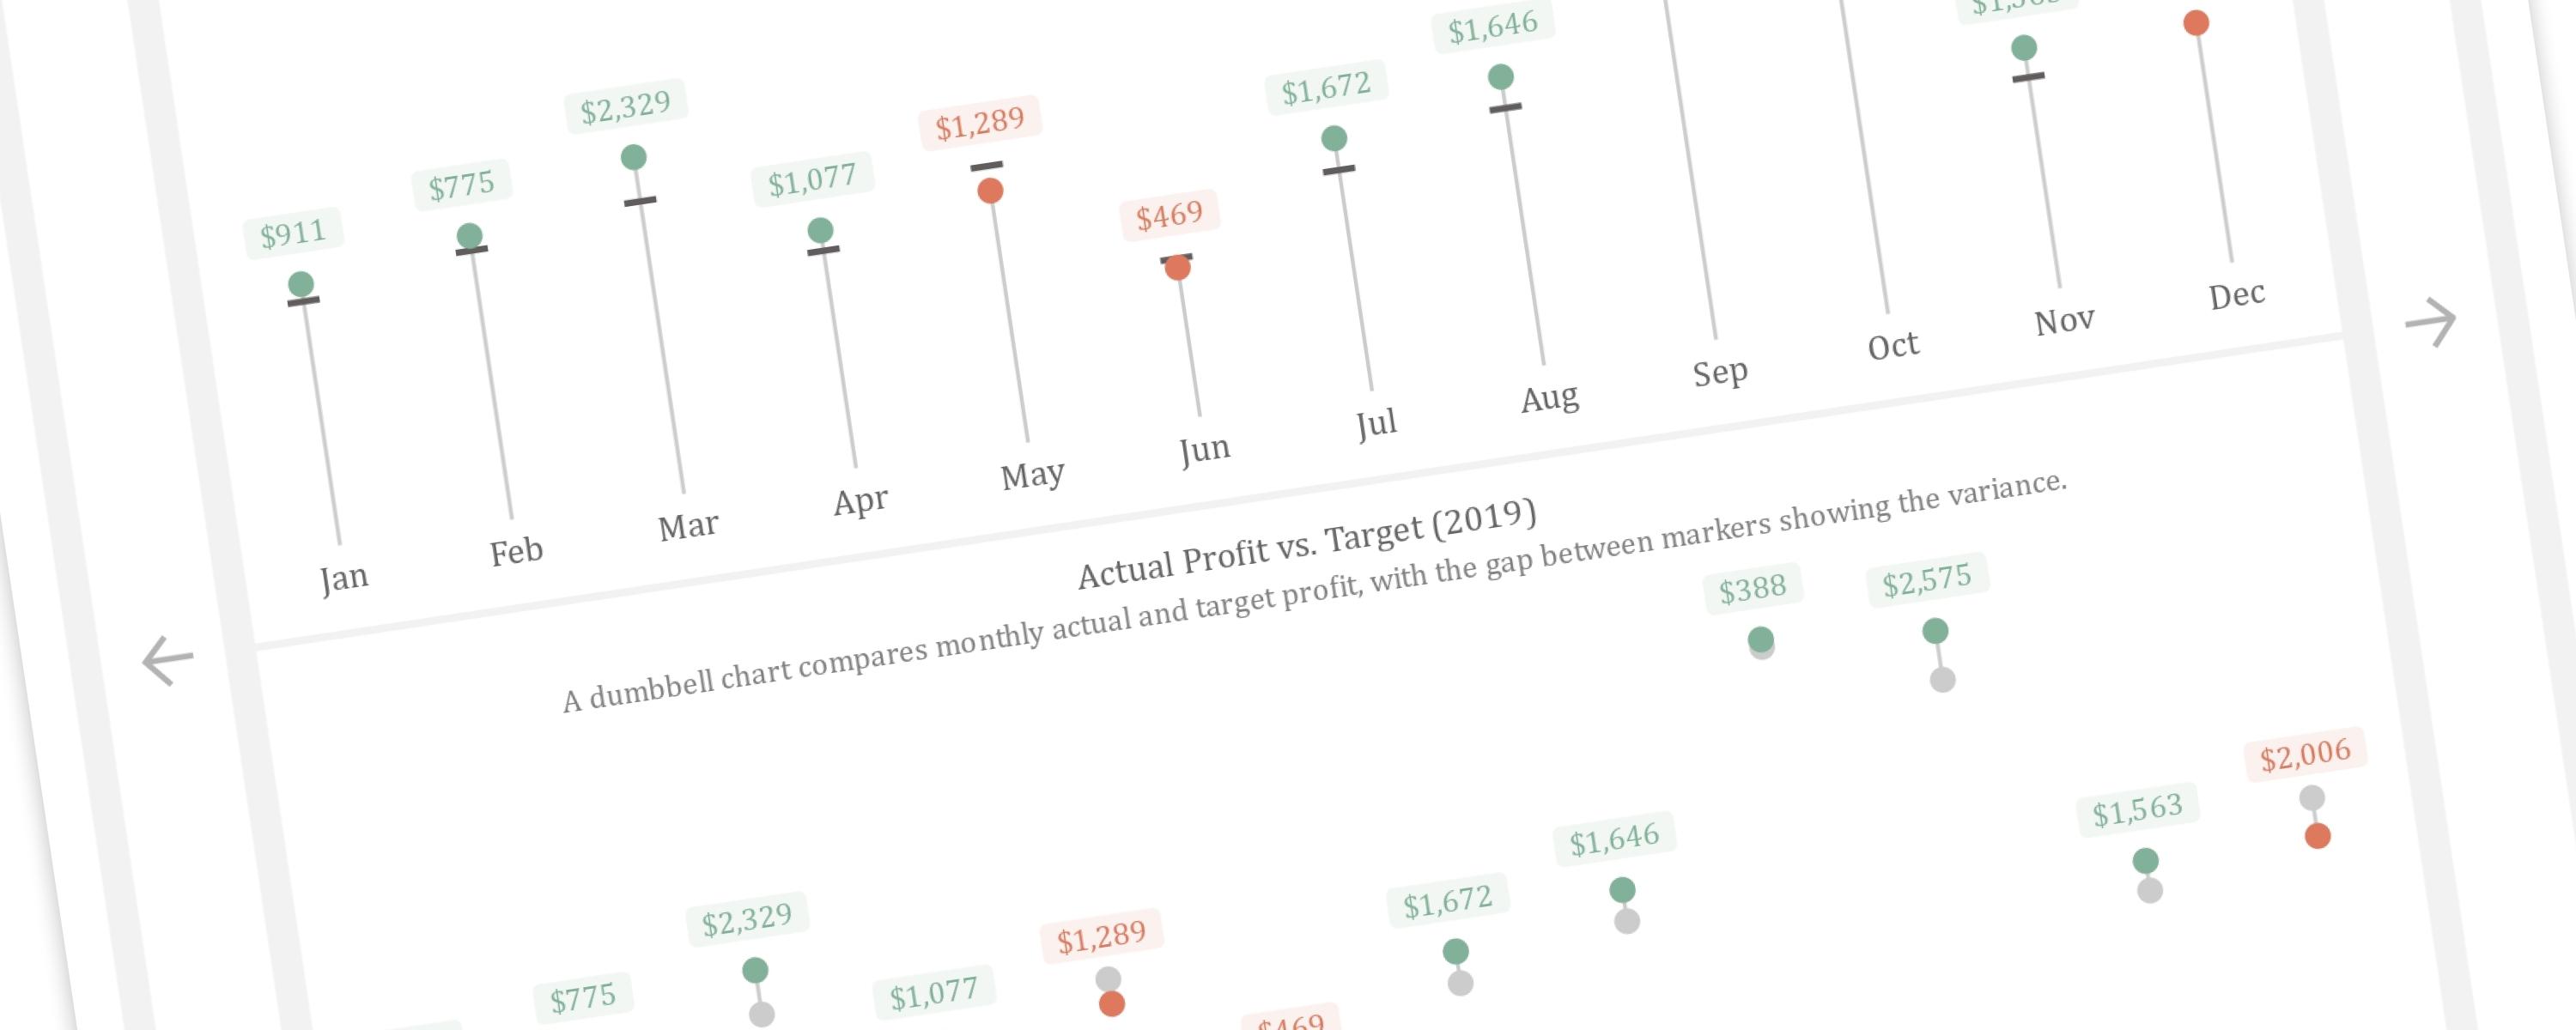
This article demonstrates how to create a dynamic vertical lollipop and dumbbell chart in Power BI.

LineFree
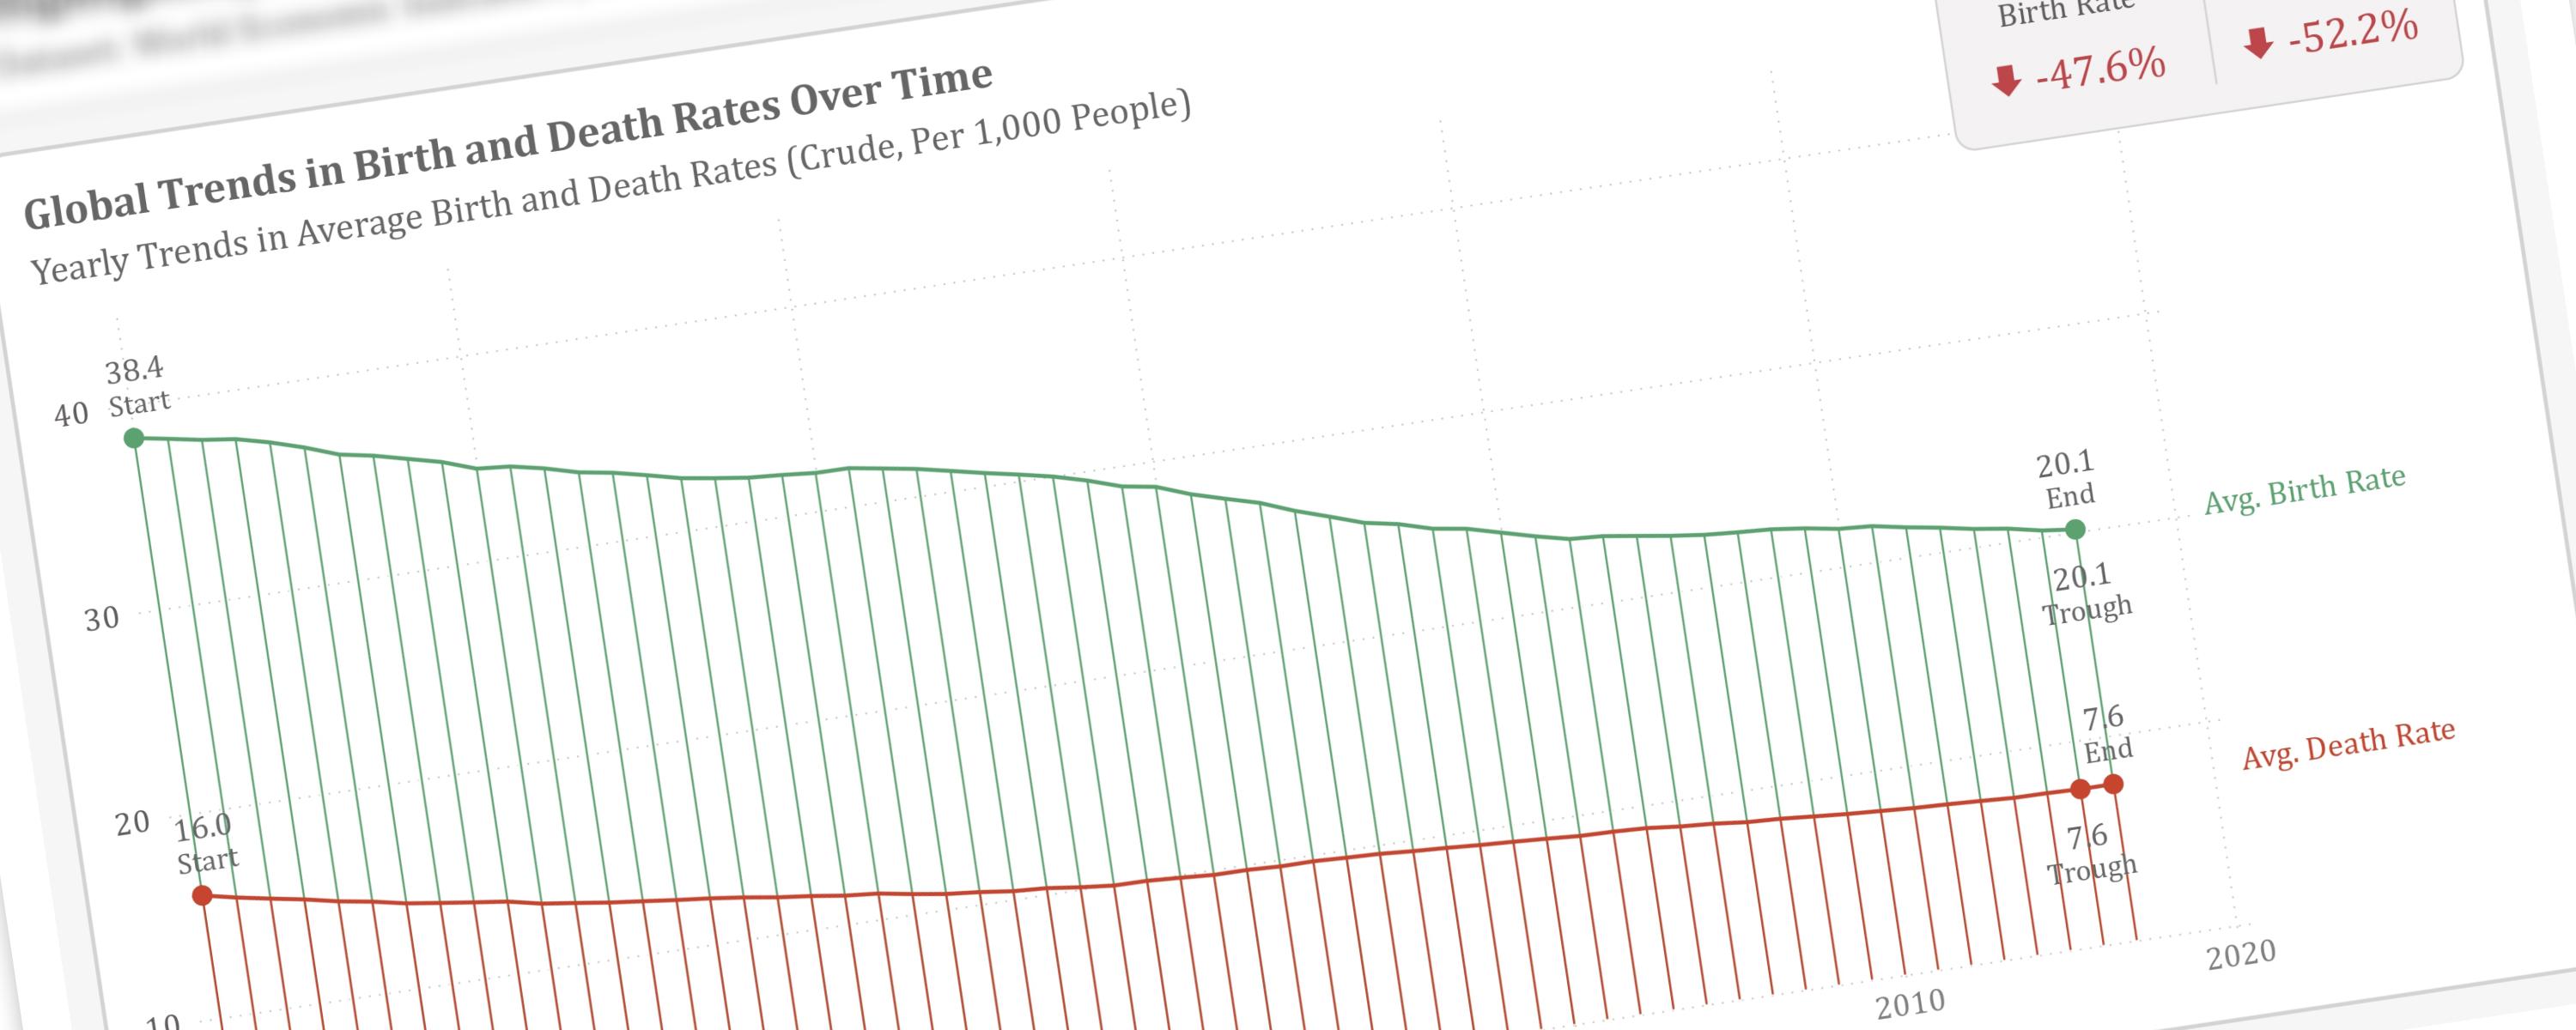
This article will guide you through the process of visually emphasizing key data points within a line chart.

BarFree
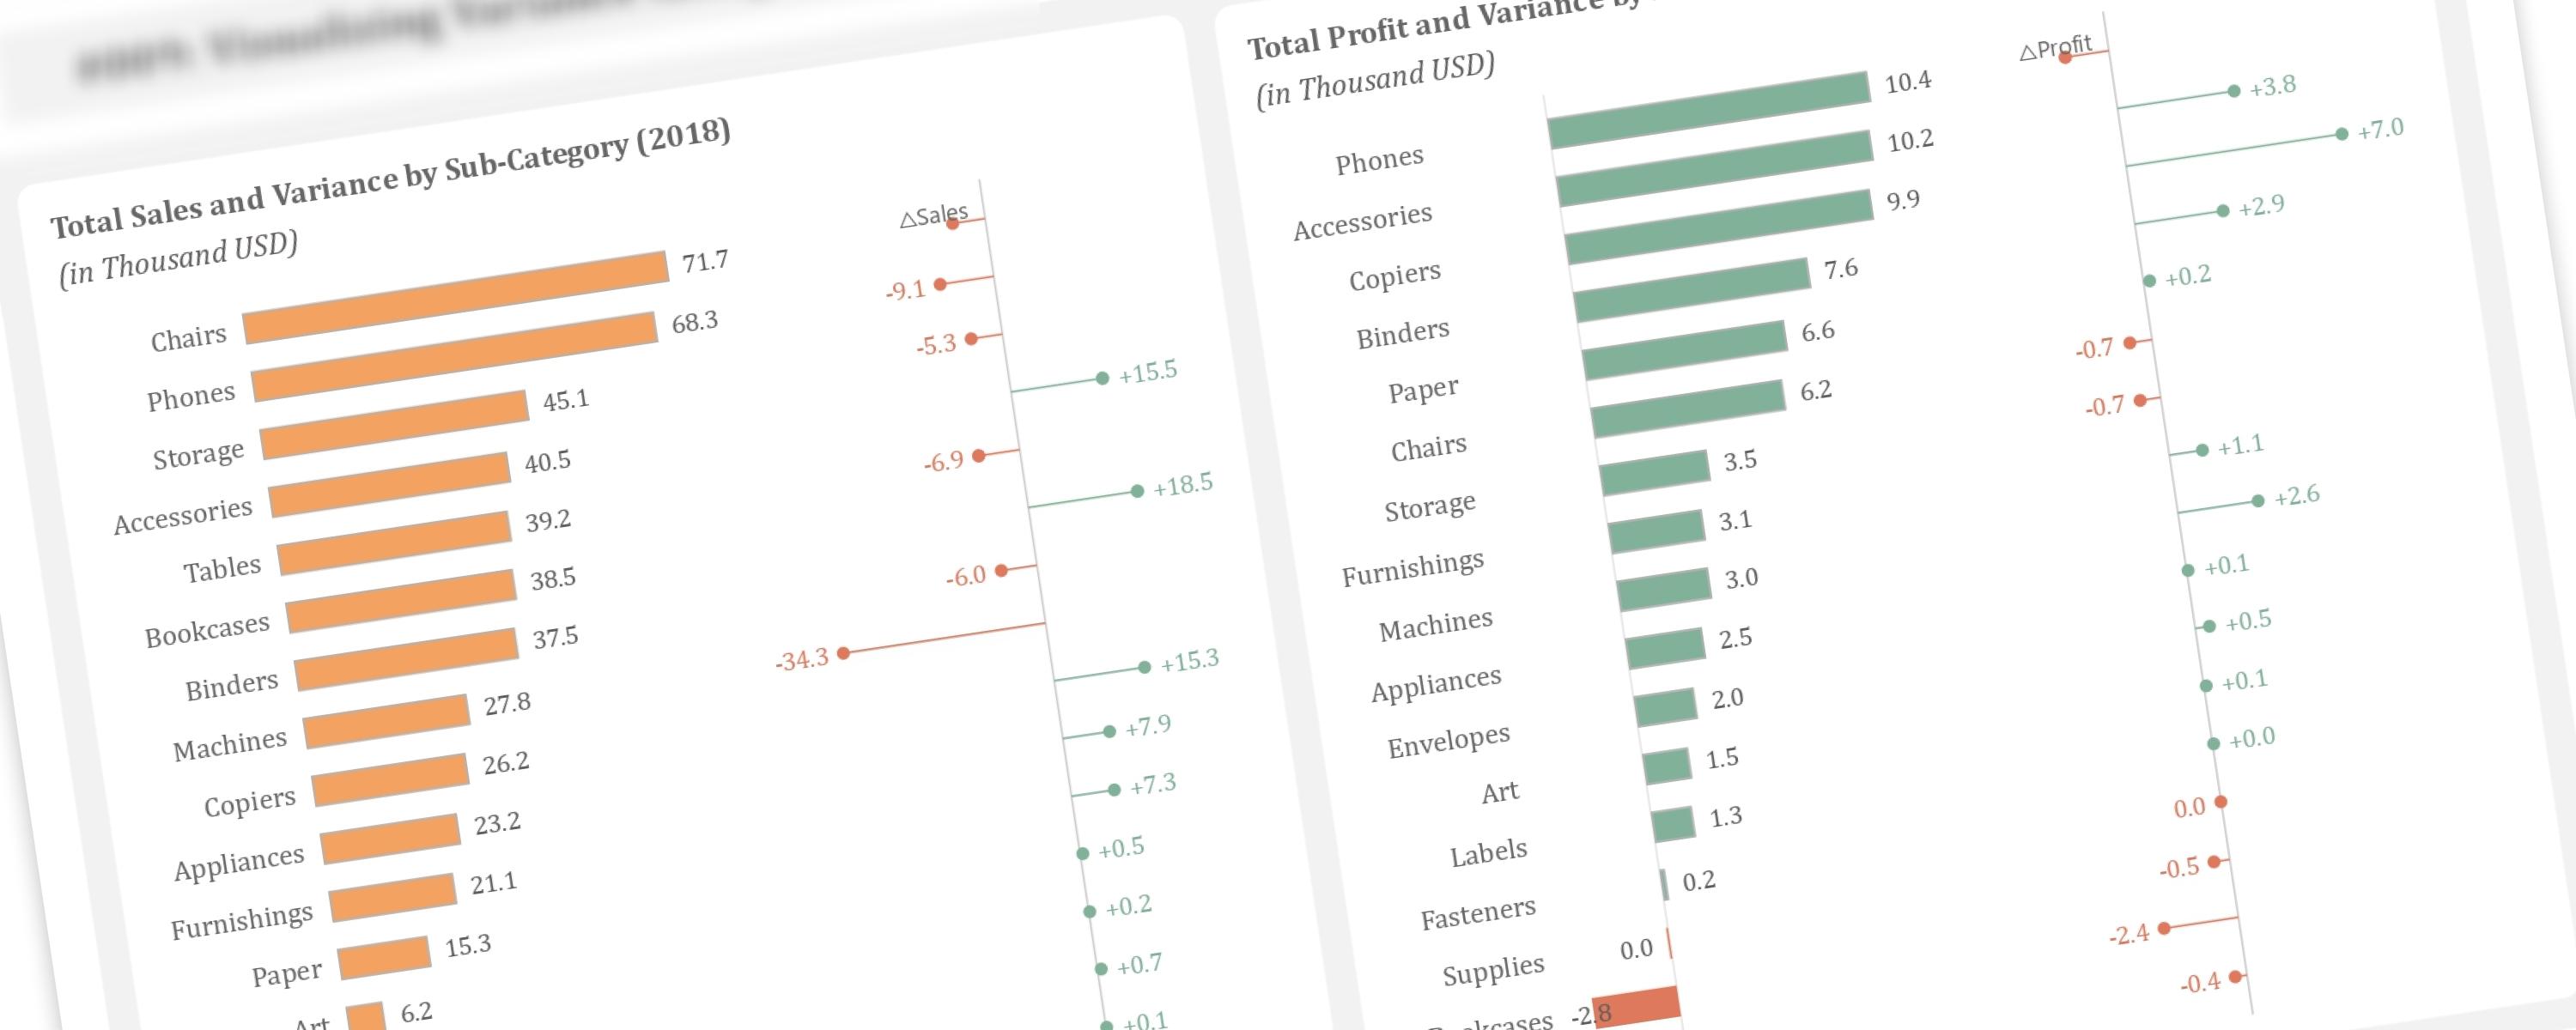
This article demonstrates how to create additional lollipop charts alongside bar charts to visualize year-over-year variance, a technique inspired by Bas Dohmen.