Foreword
This documentation details advanced pagination techniques, extending my previous tutorial and documentation. My prior work focused on optimizing DAX measures for faster loading and addressing ranking inconsistencies to eliminate duplicate and skipped ranks, drawing from Bas Dohmen's initial approach.
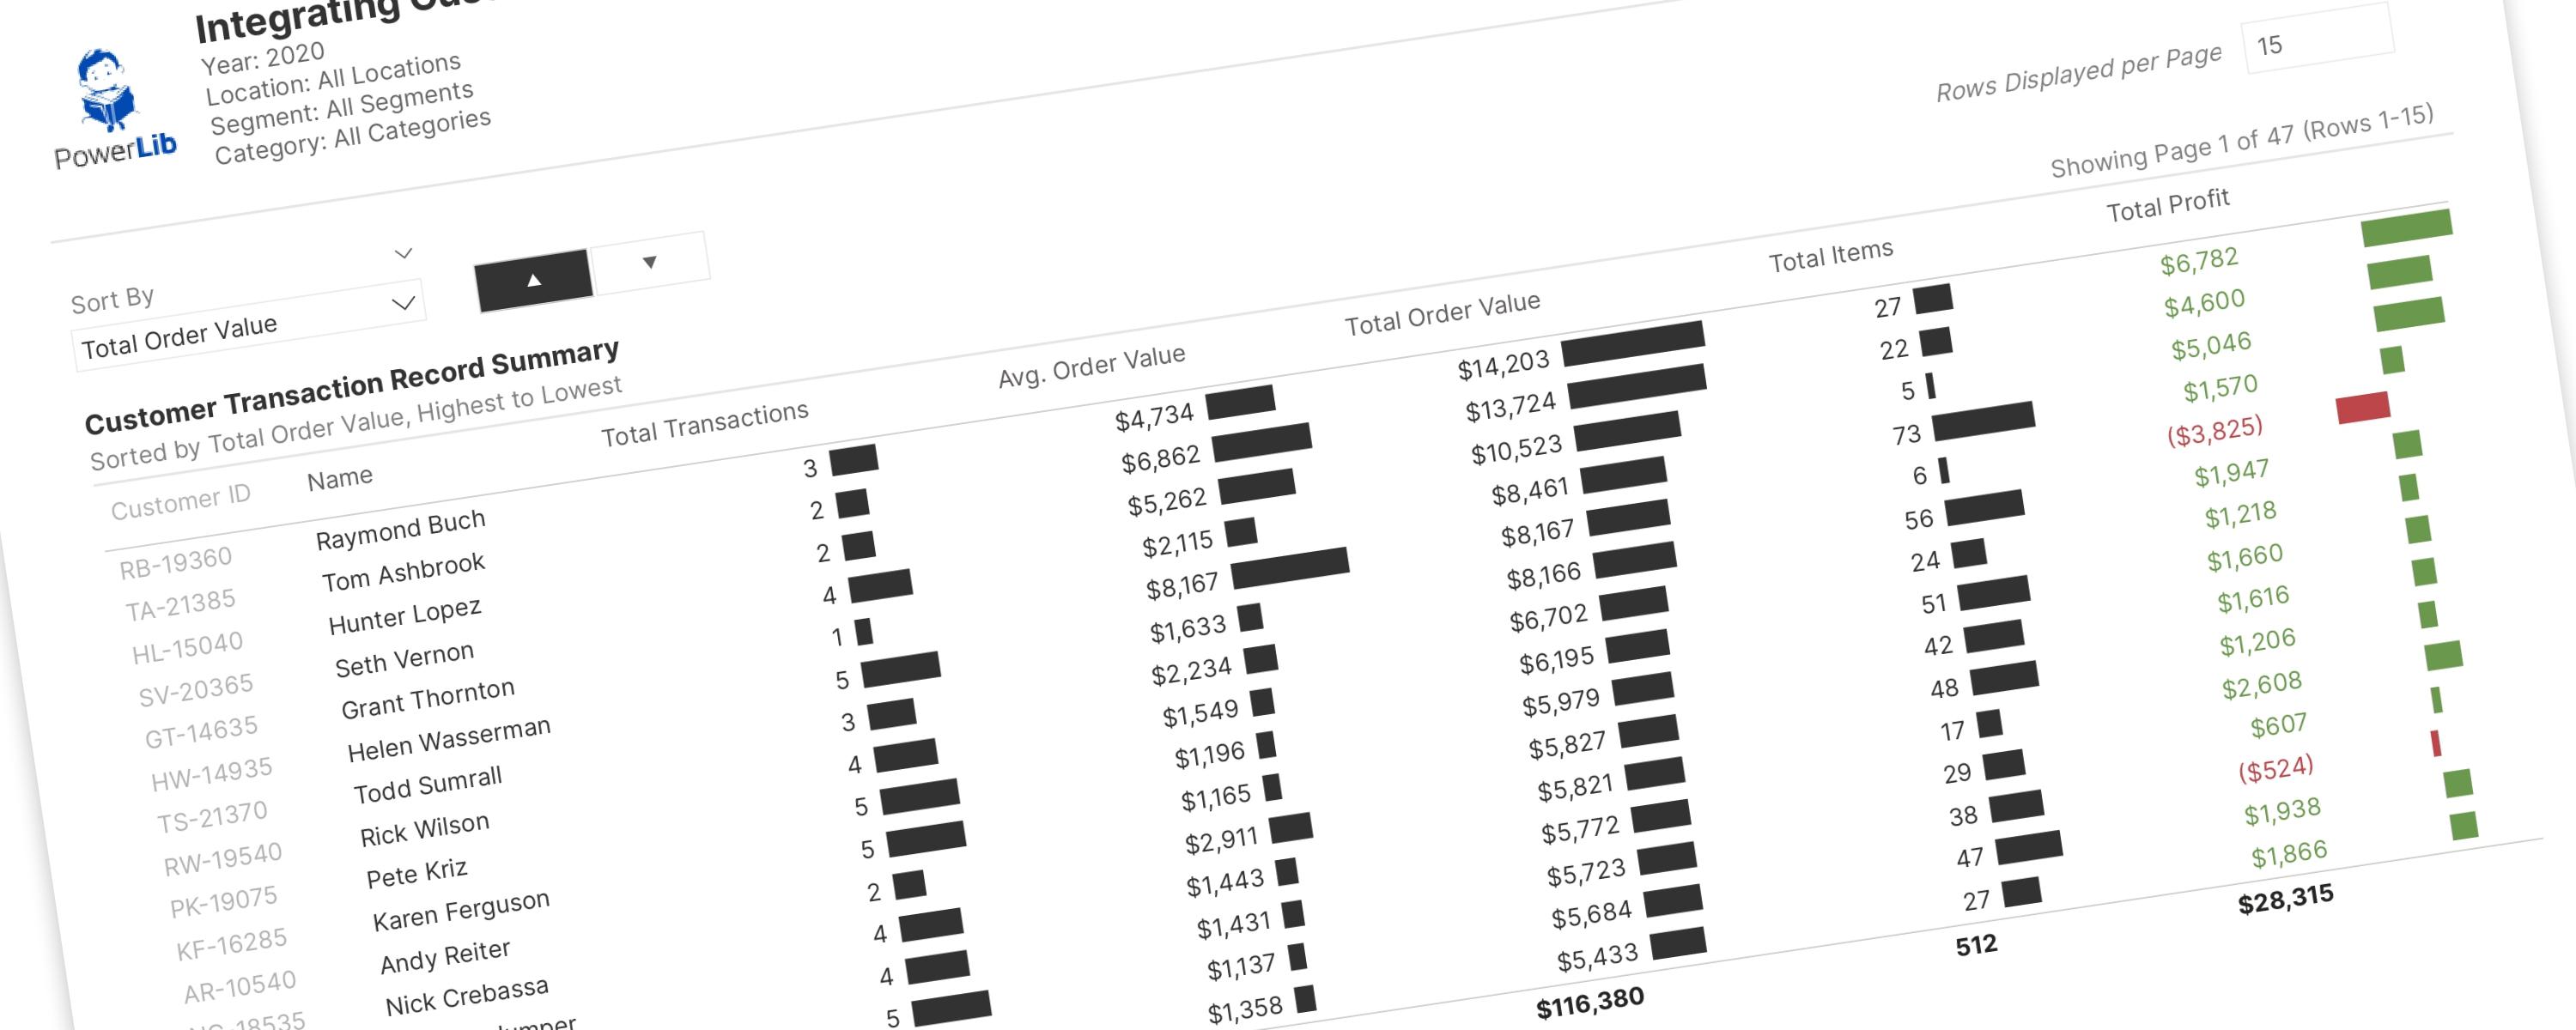
This time, my primary goal was to integrate custom sorting by selected measures directly into the paginated table. I drew inspiration for this custom sorting from Fernan's excellent tutorial. This feature is incredibly valuable for stakeholders, enabling them to quickly pinpoint insights such as:
-
Identifying repeat customers and those who order most frequently.
-
Determining customers with the highest Average Order Value (AOV) or total order value.
-
Spotting customers who purchase the most items within a single order.
-
Analyzing profit generated per customer and identifying the most (and least) profitable customers.
-
And many more.
These insights are crucial for segmenting customers based on their purchasing behavior—differentiating, for example, between frequent but small-value buyers, those who make large single purchases, or customers who buy many items in one go.
This enhanced approach addresses a few key challenges:
-
Data Bar Scaling: Native data bars generated by table visuals scale based only on the current page's highest value, not the entire dataset. I've resolved this by implementing SVG bar charts for accurate, global scaling.
-
Ranking Limitations with Hierarchical Slicers: While the pagination works seamlessly with multiple slicers, including hierarchical ones like category/sub-category and region/state, I encountered a limitation with row ranking. The
ALLSELECTEDfunction causes ranks to reset on page navigation. AlthoughALLworks well with non-hierarchical or single-selection slicers, it fails to sort correctly with multi-selections in hierarchical slicers. I'm still actively investigating this issue.
Custom Sorting Advantages
While simply clicking the column header in a Power BI visual (like a table or matrix) allows for quick alphabetical or numerical sorting, using a custom sorting slicer to sort by a specific measure offers significant advantages, especially for enhanced user experience and complex sorting scenarios. Here's a breakdown of the benefits:
-
User-Friendly Control and Discoverability:
- Intuitive for End-Users: A custom sorting slicer explicitly presents sorting options to the user on the report canvas. This makes it clear how to change the sort order, even for those new to Power BI. Clicking column headers might not be immediately obvious to all users, or they might not know which column to click to achieve a specific sort.
- Visibility of Current Sort: The slicer visually indicates the currently applied sort order (e.g., "Sort by Sales (Highest to Lowest)"). This provides immediate feedback to the user about how the data is currently organized.
-
Sorting by a Measure Not Directly Displayed:
- Beyond Column Values: Often, you want to sort a table or matrix based on a measure that isn't displayed as a column in the visual itself. For example, you might have a table of product categories, but you want to sort them by "Total Profit" (a measure) even if "Total Profit" isn't a visible column in that table. A custom sorting slicer allows you to achieve this by linking the slicer's selection to the measure's sorting logic.
- Dynamic Ranking: This is a common use case. You can create a measure that calculates a rank based on another measure (e.g., RANKX). A custom slicer can then control whether the table is sorted by that rank (ascending or descending), without needing to display the rank column itself.
-
Complex and Custom Sorting Logic:
- Non-Alphabetical/Non-Numerical Orders: For columns like "Month Name" or "Product Size" (Small, Medium, Large), default alphabetical/numerical sorting is often incorrect. You can create a custom sort order (e.g., a "Month Number" column for months) and use a custom sorting slicer to apply this specific, logical order.
- Multiple Sort Options: A single custom slicer can offer various sorting options (e.g., "Sort by Sales," "Sort by Profit," "Sort by Quantity," "Sort by Customer Count"). This gives users more flexibility to analyze data from different perspectives without having to manually change the sort column each time.
- Scenario-Based Sorting: You can design the slicer to provide sorting options relevant to specific analytical scenarios. For instance, a sales report might offer options to sort by "Current Year Sales," "Previous Year Sales," or "Sales Growth."
-
Consistency Across Visuals (Synchronization):
- Global Sorting: If you have multiple visuals on a page or across pages that should be sorted in the same way, a custom sorting slicer can be synchronized to affect all of them simultaneously. This ensures consistency in data presentation across your report.
- Drill-Through Considerations: When users drill through to another report page, the custom sorting slicer can persist the chosen sort order, maintaining the analytical context.
-
Improved Report Design and Aesthetics:
- Cleaner Visuals: By using a slicer for sorting, you can keep your main table or matrix visuals cleaner by not having to display extra sorting columns.
- Guided Analysis: The presence of a sorting slicer guides users on how to interact with the report and explore the data effectively.
DAX measures
Total Transactions
_01 Count of Unique Orders / Total Transactions = DISTINCTCOUNT(Superstore[Order ID])Average Order Value (AOV)
_01 Avg. Order Value (AOV) = [_01 Total Revenue] / [_01 Count of Unique Orders / Total Transactions]Total Sales (Total Order Value in this context)
_01 Total Revenue = SUM(Superstore[Sales])Total Quantity (Total Items Sold)
_01 Total Quantity = SUM(Superstore[Quantity])Total Profit
_01 Total Profit = SUM(Superstore[Profit])Average Items per Order
_01 Avg. Items per Order = [_01 Total Quantity] / [_01 Count of Unique Orders / Total Transactions]SVG Data Bars
SVG Bar Chart for Total Transactions
_01 SVG Bar Chart_Total Transactions =
VAR IsTotal = ISINSCOPE(Superstore[Customer ID]) = FALSE

VAR MaxTransaction = CALCULATE(
  MAXX(ALL(Superstore), [_01 Count of Unique Orders / Total Transactions])
)

VAR Bar_Value = [_01 Count of Unique Orders / Total Transactions]
VAR NormalizedValue = DIVIDE(Bar_Value, MaxTransaction)
VAR Bar_Fill = NormalizedValue * 10

VAR SVG_Data_URL = "data:image/svg+xml;utf8,"
VAR SVG_Start = "<svg xmlns='http://www.w3.org/2000/svg' viewBox='0 0 175 20'>"
VAR SVG_Data = "<rect fill='#323232' x='0' y='0' width='" & Bar_Fill & "' height='20' />"
VAR SVG_End = "</svg>"

RETURN
IF(
  IsTotal,
  BLANK(),
  SVG_Data_URL & SVG_Start & SVG_Data & SVG_End
)
SVG Bar Chart for Average Order Value (AOV)
_02 SVG Bar Chart_AOV =
VAR IsTotal = ISINSCOPE(Superstore[Customer ID]) = FALSE

VAR MaxAOV = CALCULATE(
  MAXX(ALL(Superstore), [_01 Avg. Order Value (AOV)])
)

VAR Bar_Value = [_01 Avg. Order Value (AOV)]
VAR NormalizedValue = DIVIDE(Bar_Value, MaxAOV)
VAR Bar_Fill = NormalizedValue * 175

VAR SVG_Data_URL = "data:image/svg+xml;utf8,"
VAR SVG_Start = "<svg xmlns='http://www.w3.org/2000/svg' viewBox='0 0 175 20'>"
VAR SVG_Data = "<rect fill='#323232' x='0' y='0' width='" & Bar_Fill & "' height='20' />"
VAR SVG_End = "</svg>"

RETURN
IF(
  IsTotal,
  BLANK(),
  SVG_Data_URL & SVG_Start & SVG_Data & SVG_End
)
SVG Bar Chart for Total Order Value
_03 SVG Bar Chart_Total Order Value =
VAR IsTotal = ISINSCOPE(Superstore[Customer ID]) = FALSE

VAR MaxRevenue = CALCULATE(
  MAXX(ALL(Superstore), [_01 Total Revenue])
)

VAR Bar_Value = [_01 Total Revenue]
VAR NormalizedValue = DIVIDE(Bar_Value, MaxRevenue)
VAR Bar_Fill = NormalizedValue * 175

VAR SVG_Data_URL = "data:image/svg+xml;utf8,"
VAR SVG_Start = "<svg xmlns='http://www.w3.org/2000/svg' viewBox='0 0 175 20'>"
VAR SVG_Data = "<rect fill='#323232' x='0' y='0' width='" & Bar_Fill & "' height='20' />"
VAR SVG_End = "</svg>"

RETURN
IF(
  IsTotal,
  BLANK(),
  SVG_Data_URL & SVG_Start & SVG_Data & SVG_End
)
SVG Bar Chart for Total Quantity (Items Sold)
_04 SVG Bar Chart_Total Qty Ordered (Items) =
VAR IsTotal = ISINSCOPE(Superstore[Customer ID]) = FALSE

VAR MaxQty = CALCULATE(
  MAXX(ALL(Superstore), [_01 Total Quantity])
)

VAR Bar_Value = [_01 Total Quantity]
VAR NormalizedValue = DIVIDE(Bar_Value, MaxQty)
VAR Bar_Fill = NormalizedValue * 15

VAR SVG_Data_URL = "data:image/svg+xml;utf8,"
VAR SVG_Start = "<svg xmlns='http://www.w3.org/2000/svg' viewBox='0 0 175 20'>"
VAR SVG_Data = "<rect fill='#323232' x='0' y='0' width='" & Bar_Fill & "' height='20' />"
VAR SVG_End = "</svg>"

RETURN
IF(
  IsTotal,
  BLANK(),
  SVG_Data_URL & SVG_Start & SVG_Data & SVG_End
)
SVG Bar Chart for Total Profit
_05 SVG Bar Chart_Total Profit =
VAR IsTotal = ISINSCOPE(Superstore[Customer ID]) = FALSE

-- SVG dimensions
VAR TotalWidth = 175
VAR HalfWidth = TotalWidth / 2
VAR Height = 20

-- Max absolute profit to scale both directions
VAR MaxAbsProfit = CALCULATE(
  MAXX(ALL(Superstore), ABS([_01 Total Profit]))
)

-- Actual profit value
VAR Bar_Value = [_01 Total Profit]

-- Normalized bar width
VAR NormalizedWidth = DIVIDE(ABS(Bar_Value), MaxAbsProfit) * HalfWidth

-- Bar position and color
VAR Bar_X = IF(Bar_Value >= 0, HalfWidth, HalfWidth - NormalizedWidth)
VAR FillColor = IF(Bar_Value >= 0, "#6A994E", "#BC4749")

-- SVG structure
VAR SVG_Data_URL = "data:image/svg+xml;utf8,"
VAR SVG_Start = "<svg xmlns='http://www.w3.org/2000/svg' viewBox='0 0 " & TotalWidth & " " & Height & "'>"

-- Zero axis line (thin vertical line at center)
VAR Zero_Axis = "<line x1='" & HalfWidth & "' y1='0' x2='" & HalfWidth & "' y2='" & Height & "' stroke='#888888' stroke-width='1' />"

-- Bar rectangle
VAR SVG_Bar = "<rect fill='" & FillColor & "' x='" & Bar_X & "' y='0' width='" & NormalizedWidth & "' height='" & Height & "' />"

VAR SVG_End = "</svg>"

RETURN
IF(
  IsTotal,
  BLANK(),
  SVG_Data_URL & SVG_Start & Zero_Axis & SVG_Bar & SVG_End
)
‘Sort By Measures’ Table
Sort By =
DATATABLE (
  "Measure", STRING,
  "Order", INTEGER,
  {
      {"Total Transactions", 1},
      {"Avg. Order Value", 2},
      {"Total Order Value", 3},
      {"Total Items", 4},
      {"Total Profit", 5},
      {"Avg. Items per Order", 6}
  }
)
Customer ID_Number (this measure will be used as second criterion to assign rank to each row)
Customer ID_Number =
RIGHT([Customer ID], LEN([Customer ID]) - FIND("-", [Customer ID]))
Dynamic Rank
Dynamic Rank =
IF(
  ISINSCOPE(Superstore[Customer ID]),
IF(
  SELECTEDVALUE('Sort_ASC/DESC'[Name]) = "ASC",
  SWITCH(
      SELECTEDVALUE('Sort By'[Measure]),
      "Total Transactions", RANKX(
          ALLSELECTED(Superstore[Customer ID], Superstore[Customer Name]),
          [_01 Count of Unique Orders / Total Transactions] * 1000000 + CALCULATE(SUM(Superstore[Customer ID_Number])),
          ,
          DESC,
          DENSE
      ),
      "Avg. Order Value", RANKX(
          ALLSELECTED(Superstore[Customer ID], Superstore[Customer Name]),
          [_01 Avg. Order Value (AOV)] * 1000000 + CALCULATE(SUM(Superstore[Customer ID_Number])),
          ,
          DESC,
          DENSE
      ),
      "Total Order Value", RANKX(
          ALLSELECTED(Superstore[Customer ID], Superstore[Customer Name]),
          [_01 Total Revenue] * 1000000 + CALCULATE(SUM(Superstore[Customer ID_Number])),
          ,
          DESC,
          DENSE
      ),
       "Total Items", RANKX(
          ALLSELECTED(Superstore[Customer ID], Superstore[Customer Name]),
          [_01 Total Quantity] * 1000000 + CALCULATE(SUM(Superstore[Customer ID_Number])),
          ,
          DESC,
          DENSE
      ),
      "Total Profit", RANKX(
          ALLSELECTED(Superstore[Customer ID], Superstore[Customer Name]),
          [_01 Total Profit] * 1000000 + CALCULATE(SUM(Superstore[Customer ID_Number])),
          ,
          DESC,
          DENSE
      ),
      "Avg. Items per Order", RANKX(
          ALLSELECTED(Superstore[Customer ID], Superstore[Customer Name]),
          [_01 Avg. Items per Order] * 1000000 + CALCULATE(SUM(Superstore[Customer ID_Number])),
          ,
          ASC,
          DENSE
      ),
      1
  ),
  SWITCH(
      SELECTEDVALUE('Sort By'[Measure]),
      "Total Transactions", RANKX(
          ALLSELECTED(Superstore[Customer ID], Superstore[Customer Name]),
          [_01 Count of Unique Orders / Total Transactions] * 1000000 - CALCULATE(SUM(Superstore[Customer ID_Number])),
          ,
          ASC,
          DENSE
      ),
      "Avg. Order Value", RANKX(
          ALLSELECTED(Superstore[Customer ID], Superstore[Customer Name]),
          [_01 Avg. Order Value (AOV)] * 1000000 - CALCULATE(SUM(Superstore[Customer ID_Number])),
          ,
          ASC,
          DENSE
      ),
      "Total Order Value", RANKX(
          ALLSELECTED(Superstore[Customer ID], Superstore[Customer Name]),
          [_01 Total Revenue] * 1000000 - CALCULATE(SUM(Superstore[Customer ID_Number])),
          ,
          ASC,
          DENSE
      ),
      "Total Items", RANKX(
          ALLSELECTED(Superstore[Customer ID], Superstore[Customer Name]),
          [_01 Total Quantity] * 1000000 - CALCULATE(SUM(Superstore[Customer ID_Number])),
          ,
          ASC,
          DENSE
      ),
      "Total Profit", RANKX(
          ALLSELECTED(Superstore[Customer ID], Superstore[Customer Name]),
          [_01 Total Profit] * 1000000 - CALCULATE(SUM(Superstore[Customer ID_Number])),
          ,
          ASC,
          DENSE
      ),
      "Avg. Items per Order", RANKX(
          ALLSELECTED(Superstore[Customer ID], Superstore[Customer Name]),
          [_01 Avg. Items per Order] * 1000000 - CALCULATE(SUM(Superstore[Customer ID_Number])),
          ,
          ASC,
          DENSE
      ),
      1
  )
  ),
  BLANK()
)
Item Filter
Item Filter =
VAR CurrentPage = SELECTEDVALUE('# of Pages'[# of Pages], 1)
VAR ItemsPerPage = SELECTEDVALUE('# of Items'[# of Items], 10)
VAR RowRank = [Dynamic Rank]
VAR StartIndex = (CurrentPage - 1) * ItemsPerPage + 1
VAR EndIndex = CurrentPage * ItemsPerPage

RETURN
IF(
  RowRank >= StartIndex && RowRank <= EndIndex,
  1,
  0
)
Page Filter
Page Filter =
VAR _TotalNrItems =
  CALCULATE(
      DISTINCTCOUNT(Superstore[Customer ID]),
      ALLSELECTED(Superstore[Customer ID])
  )
VAR _ShowNrItems = [# of Items Value]
VAR _NumberofPages =
  ROUNDUP(
      DIVIDE(
          _TotalNrItems,
          _ShowNrItems
      ),
      0
  )
VAR _PageFilter =
  IF(
      SELECTEDVALUE( '# of Pages'[# of Pages] ) <= _NumberofPages,
      1,
      0
  )
RETURN
  _PageFilter
Total Pages
Total Pages =
VAR ItemsPerPage = SELECTEDVALUE('# of Items'[# of Items], 10)
VAR TotalCustomers =
  CALCULATE(
      DISTINCTCOUNT(Superstore[Customer ID]),
      ALLSELECTED(Superstore)
  )

RETURN
CEILING(TotalCustomers / ItemsPerPage, 1)
Page Info
Page Info =
VAR CurrentPage = SELECTEDVALUE('# of Pages'[# of Pages], 1)
VAR TotalPages = [Total Pages]
VAR ItemsPerPage = SELECTEDVALUE('# of Items'[# of Items], 10)
VAR StartItem = (CurrentPage - 1) * ItemsPerPage + 1
VAR EndItem = MIN(CurrentPage * ItemsPerPage,
  CALCULATE(
      DISTINCTCOUNT(Superstore[Customer ID]),
      ALLSELECTED(Superstore)
  )
)

RETURN
"Showing Page " & CurrentPage & " of " & TotalPages &
" (Rows " & StartItem & "-" & EndItem & ")"
Display Text of Selected Metric in Ascending or Descending Order
Display Text_Sort By =
VAR SelectedMetric = SELECTEDVALUE('Sort By'[Measure])
VAR SelectedASCDESC = SELECTEDVALUE('Sort_ASC/DESC'[Name])
VAR MetricText =
  SWITCH(
      SelectedMetric,
      "Total Transactions", "Total Transactions",
      "Avg. Order Value", "Average Order Value",
      "Total Order Value", "Total Order Value",
      "Total Items", "Total Items",
      "Total Profit", "Total Profit",
      "Avg. Items per Order", "Average Items per Order",
      "No Selection"
  )
VAR ASCDESCText =
  SWITCH(
      SelectedAscDesc,
      "ASC", "Highest to Lowest",
      "DESC", "Lowest to Highest",
      "No Direction"
  )
RETURN
  IF(
      MetricText <> "No Selection" && ASCDESCText <> "No Direction",
      "Sorted by " & MetricText & ", " & ASCDESCText & "",
      "No sorting applied"
  )