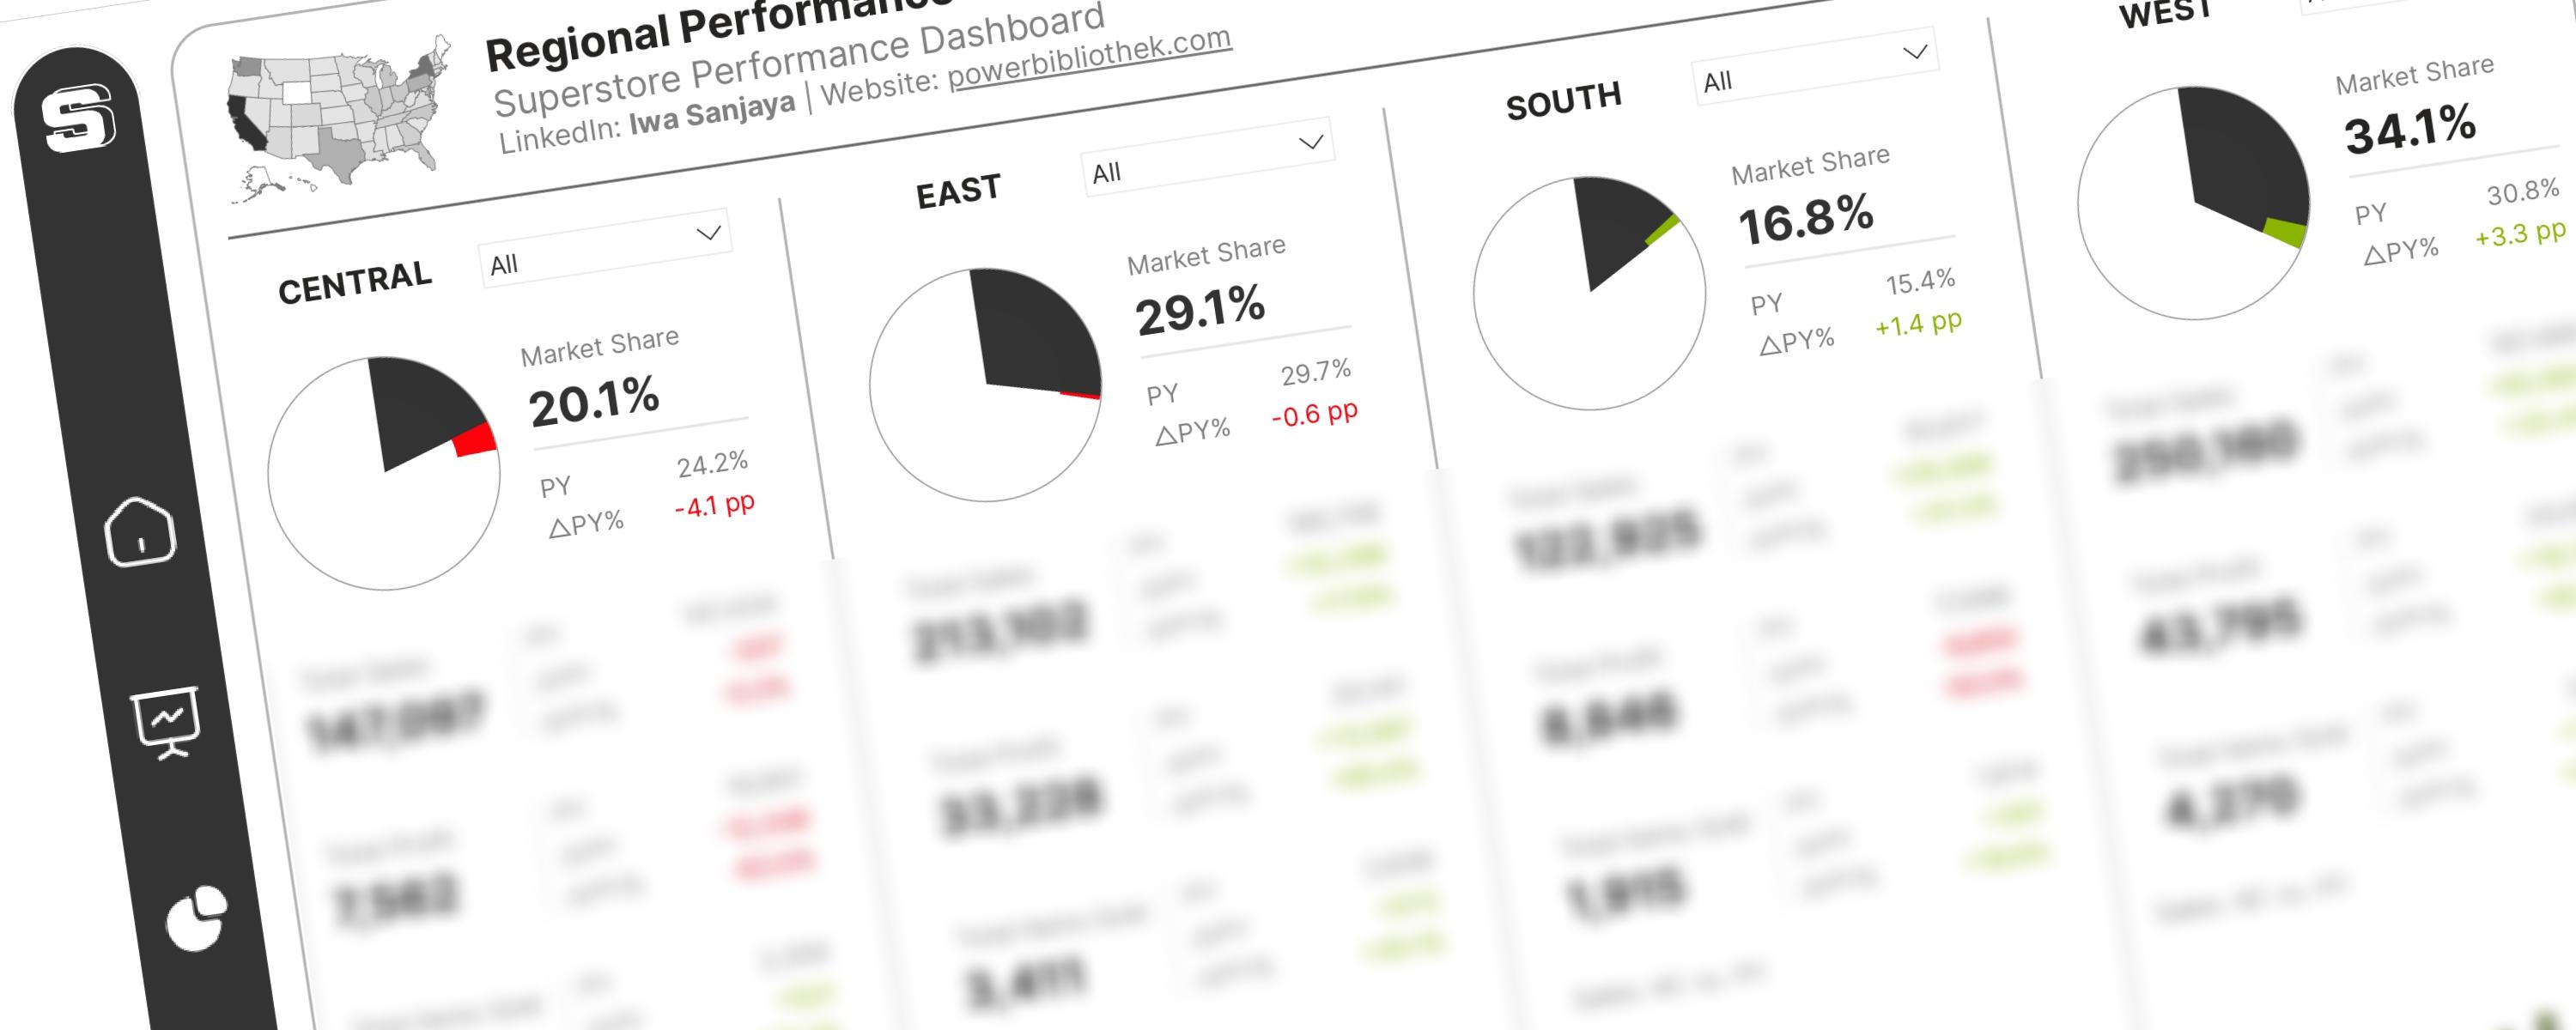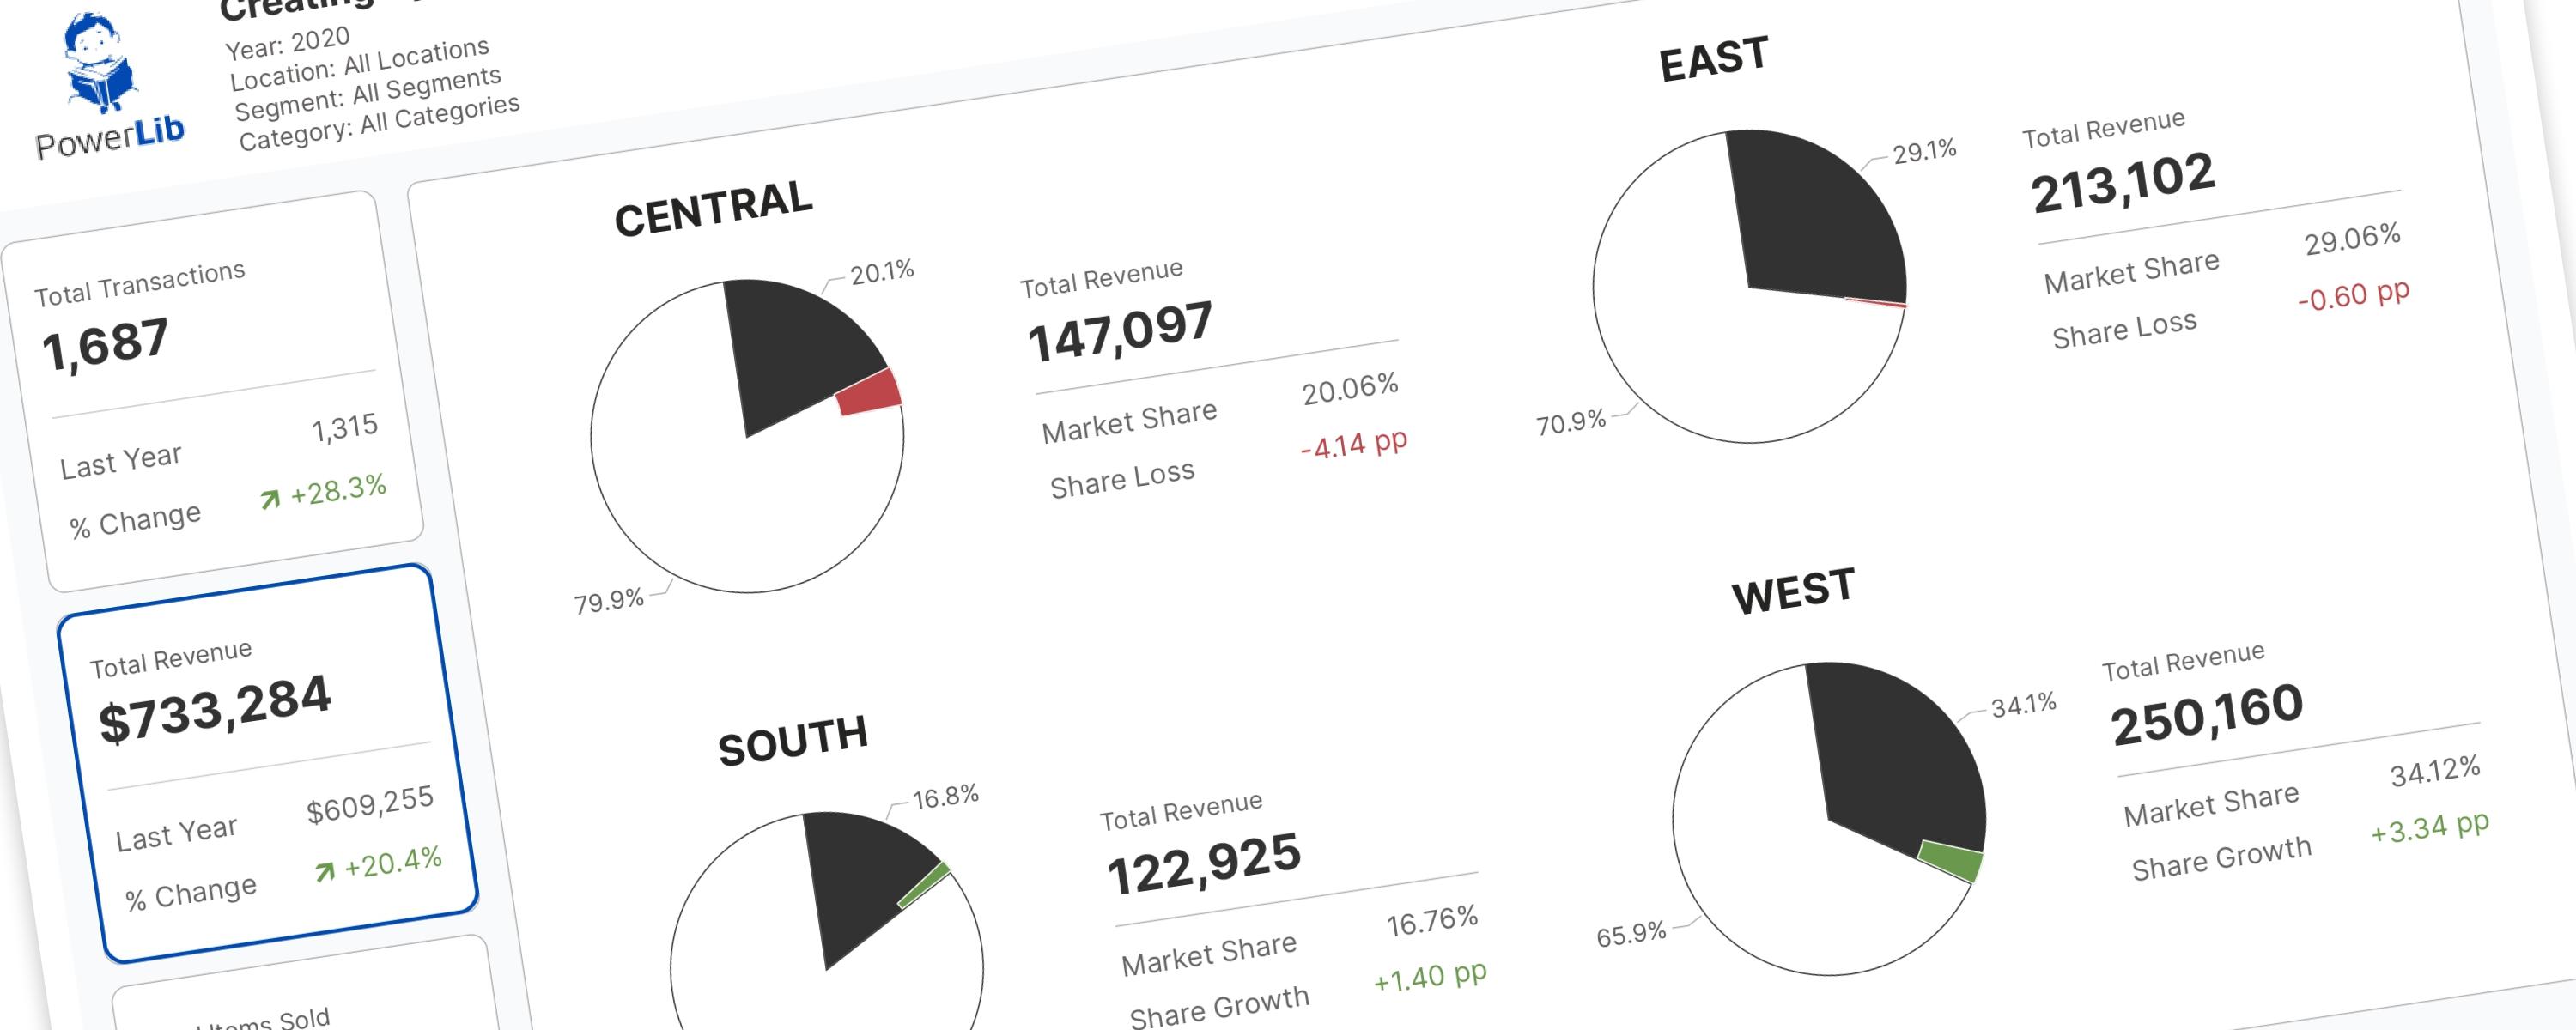
Foreword
DAX Measures
_01 Transactions
Total Transactions
_01 Total Transactions = DISTINCTCOUNT(Superstore[Order ID])PY Total Transactions
_02 PY Total Transactions =
IF(
  HASONEVALUE(DimDate[Year]),
  CALCULATE(
      [_01 Total Transactions],
      SAMEPERIODLASTYEAR(DimDate[Date])
  ),
  BLANK()
)
Error Bars for Positive △PY Total Transactions
_03 Positive Error Bars_△PY Total Transactions =
VAR _CurrentYear = [_01 Total Transactions]
VAR _PreviousYear = [_02 PY Total Transactions]
VAR _HasSurplus = _CurrentYear > _PreviousYear
RETURN
  IF(
      NOT ISBLANK(_PreviousYear) && _HasSurplus,
      _CurrentYear,
      BLANK()
  )
Error Bars for Negative △PY Total Transactions
_03 Negative Error Bars_△PY Total Transactions =
VAR _CurrentYear = [_01 Total Transactions]
VAR _PreviousYear = [_02 PY Total Transactions]
VAR _HasDeficit = _PreviousYear > _CurrentYear
RETURN
  IF(
      NOT ISBLANK(_CurrentYear) && _HasDeficit,
      _PreviousYear,
      BLANK()
  )
_02 Revenue
Total Revenue
_01 Total Revenue = SUM(Superstore[Sales])PY Total Revenue
_02 PY Total Revenue =
IF(
  HASONEVALUE(DimDate[Year]),
  CALCULATE(
      [_01 Total Revenue],
      SAMEPERIODLASTYEAR(DimDate[Date])
  ),
  BLANK()
)
Error Bars for Positive △PY Total Revenue
_03 Positive Error Bars_△PY Total Revenue =
VAR _CurrentYear = [_01 Total Revenue]
VAR _PreviousYear = [_02 PY Total Revenue]
VAR _HasSurplus = _CurrentYear > _PreviousYear
RETURN
  IF(
      NOT ISBLANK(_PreviousYear) && _HasSurplus,
      _CurrentYear,
      BLANK()
  )
Error Bars for Negative △PY Total Revenue
_03 Negative Error Bars_△PY Total Revenue =
VAR _CurrentYear = [_01 Total Revenue]
VAR _PreviousYear = [_02 PY Total Revenue]
VAR _HasDeficit = _PreviousYear > _CurrentYear
RETURN
  IF(
      NOT ISBLANK(_CurrentYear) && _HasDeficit,
      _PreviousYear,
      BLANK()
  )
_03 Total Quantity
Total Quantity
_01 Total Quantity = SUM(Superstore[Quantity])PY Total Quantity
_02 PY Total Quantity =
IF(
  HASONEVALUE(DimDate[Year]),
  CALCULATE(
      [_01 Total Quantity,
      SAMEPERIODLASTYEAR(DimDate[Date])
  ),
  BLANK()
)
Error Bars for Positive △PY Total Quantity
_03 Positive Error Bars_△PY Total Quantity =
VAR _CurrentYear = [_01 Total Quantity]
VAR _PreviousYear = [_02 PY Total Quantity]
VAR _HasSurplus = _CurrentYear > _PreviousYear
RETURN
  IF(
      NOT ISBLANK(_PreviousYear) && _HasSurplus,
      _CurrentYear,
      BLANK()
  )
Error Bars for Negative △PY Total Quantity
_03 Negative Error Bars_△PY Total Quantity =
VAR _CurrentYear = [_01 Total Quantity]
VAR _PreviousYear = [_02 PY Total Quantity]
VAR _HasDeficit = _PreviousYear > _CurrentYear
RETURN
  IF(
      NOT ISBLANK(_CurrentYear) && _HasDeficit,
      _PreviousYear,
      BLANK()
  )
_00 Dynamic Selected Metric (via Field Parameter)
Dynamic Selected Metric (via Field Parameter)
_01 Dynamic Selected Metric (via Field Parameter) =
VAR SelectedVariableOrder = SELECTEDVALUE('PMetric'[PMetric Order])
RETURN
  SWITCH(
      SelectedVariableOrder,
      0, [_01 Total Transactions],
      1, [_01 Total Revenue],
      2, [_01 Total Quantity],
      BLANK()
  )
PY Dynamic Selected Metric (via Field Parameter)
_02 PY Dynamic Selected Metric (via Field Parameter) =
IF(
  HASONEVALUE(DimDate[Year]),
  CALCULATE(
      [_01 Dynamic Selected Metric (via Field Parameter)],
      SAMEPERIODLASTYEAR(DimDate[Date])
  ),
  BLANK()
)
Dynamic Title (via Field Parameter)
_04 Dynamic Title (via Field Parameter) =
VAR _SelectedMetricOrder = SELECTEDVALUE('PMetric'[PMetric Order])

RETURN
SWITCH(
  _SelectedMetricOrder,

  -- Transaction Metrics
  0, "Total Transactions",

  -- Revenue Metrics
  1, "Total Revenue",

  -- Quantity Metrics
  2, "Total Quantity",

  -- Default when no selection
  "No Selection"
)
Calendar ‘DimDate’ Table
DimDate =
ADDCOLUMNS (
  CALENDAR ("2017-01-01", "2021-12-31"),
  "DateInt", FORMAT ( [Date], "YYYYMMDD" ),
  "Year", YEAR ( [Date] ),
  "Monthnumber", FORMAT ( [Date], "MM" ),
  "MonthNameShort", FORMAT ( [Date], "mmm" ),
  "MonthNameLong", FORMAT ( [Date], "mmmm" ),
  "DayOfWeekNumber", WEEKDAY ( [Date], 2 ),  // Monday = 1
  "DayOfWeek", FORMAT ( [Date], "dddd"),
  "DayOfWeekShort", FORMAT ( [Date], "ddd" ),
  "DayNumber", DAY ( [Date] ),
  "Quarter", "Q" & FORMAT ( [Date], "Q" ),
  "YearQuarter", FORMAT ( [Date], "YYYY" ) & "/Q" & FORMAT ( [Date], "Q" ),
  "EndOfMonth", EOMONTH([Date], 0),
  "WeekNumber", WEEKNUM([Date], 2),  // Week starts on Monday
  "YearMonth", FORMAT ( [Date], "MMMM YYYY" ),
  "YearMonthNumber", FORMAT ( [Date], "YYYYMM" )
)
Dynamic IBCS-Standard Pie Charts
Selected Region Market Share (AC%)
_01 Selected Region Market Share (AC%) =
VAR TotalAC = CALCULATE(
  [_01 Dynamic Selected Metric (via Field Parameter)],
  ALL(Superstore[Region], Superstore[State])
)
RETURN
DIVIDE([_01 Dynamic Selected Metric (via Field Parameter)], TotalAC, 0)
Remaining Market Share (AC%)
_02 Remaining Market Share (AC%) = 1 - [_01 Selected Region Market Share (AC%)]Dynamic Market Share Value
_03 Dynamic Market Share Value =
SWITCH(
  SELECTEDVALUE(MarketShareCategories[Category]),
  "Selected Region", [_01 Selected Region Market Share (AC%)],
  "Remaining Market", [_02 Remaining Market Share (AC%)]
)
Selected Region Market Share (PY%)
_04 Selected Region Market Share (PY%) =
VAR TotalPY = CALCULATE(
  [_02 PY Dynamic Selected Metric (via Field Parameter)],
  ALL(Superstore[Region], Superstore[State])
)
RETURN
DIVIDE([_02 PY Dynamic Selected Metric (via Field Parameter)], TotalPY, 0)
Dynamic Market Share Variance (Growth/Decline)
_05 Dynamic Market Share Variance (Growth/Decline) =
[_01 Selected Region Market Share (AC%)] - [_04 Selected Region Market Share (PY%)]
Dynamic Market Share Variance (Growth/Decline)_Formatted
_05 Dynamic Market Share Variance (Growth/Decline)_formatted =
VAR VarianceValue = ([_01 Selected Region Market Share (AC%)] - [_04 Selected Region Market Share (PY%)]) * 100
RETURN
IF(
  NOT ISBLANK(VarianceValue),
  IF(VarianceValue > 0, "+", "") & FORMAT(VarianceValue, "0.00") & " pp",
  BLANK()
)
Market Share to Display
_06 Market Share to Display =
IF(
  [_05 Dynamic Market Share Variance (Growth/Decline)] < 0,
  [_01 Selected Region Market Share (AC%)],
  [_04 Selected Region Market Share (PY%)]
)
Market Share Variance
_07 Market Share Variance (Absolute) =
ABS([_05 Dynamic Market Share Variance (Growth/Decline)])
Documentation
Step 1: Build Your DimDate (Calendar) Table
Once you've imported the dataset (available on my GitHub repository), the first step is to create a calendar table. This table will serve as our reference for all time-intelligence functions. To begin, create a new table and use the following DAX measure:
DAX measure to create a calendar table:
DimDate =
ADDCOLUMNS (
  CALENDAR ("2017-01-01", "2021-12-31"),
  "DateInt", FORMAT ( [Date], "YYYYMMDD" ),
  "Year", YEAR ( [Date] ),
  "Monthnumber", FORMAT ( [Date], "MM" ),
  "MonthNameShort", FORMAT ( [Date], "mmm" ),
  "MonthNameLong", FORMAT ( [Date], "mmmm" ),
  "DayOfWeekNumber", WEEKDAY ( [Date], 2 ),  // Monday = 1
  "DayOfWeek", FORMAT ( [Date], "dddd"),
  "DayOfWeekShort", FORMAT ( [Date], "ddd" ),
  "DayNumber", DAY ( [Date] ),
  "Quarter", "Q" & FORMAT ( [Date], "Q" ),
  "YearQuarter", FORMAT ( [Date], "YYYY" ) & "/Q" & FORMAT ( [Date], "Q" ),
  "EndOfMonth", EOMONTH([Date], 0),
  "WeekNumber", WEEKNUM([Date], 2),  // Week starts on Monday
  "YearMonth", FORMAT ( [Date], "MMMM YYYY" ),
  "YearMonthNumber", FORMAT ( [Date], "YYYYMM" )
)
Be sure to mark your 'date' column as a date table. For proper sorting, arrange your month columns by their month number and your day columns by their day number.
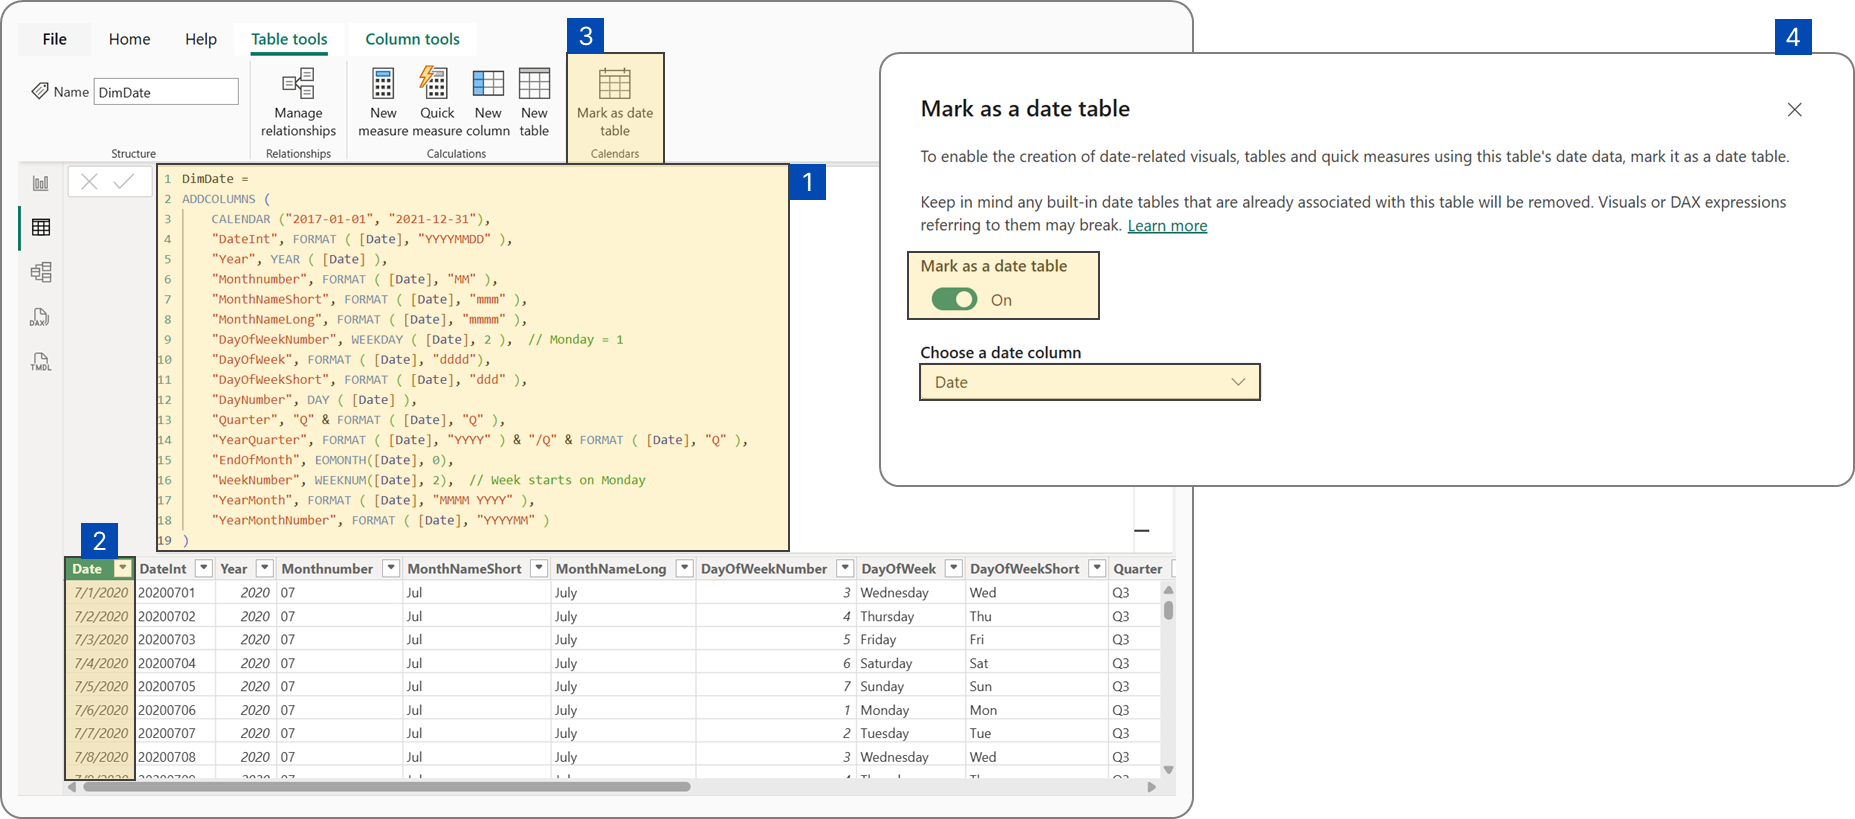 Mark the date column as a date table
In the data model, establish a many-to-one, single-direction relationship between the dimdate (calendar) table and your fact table.
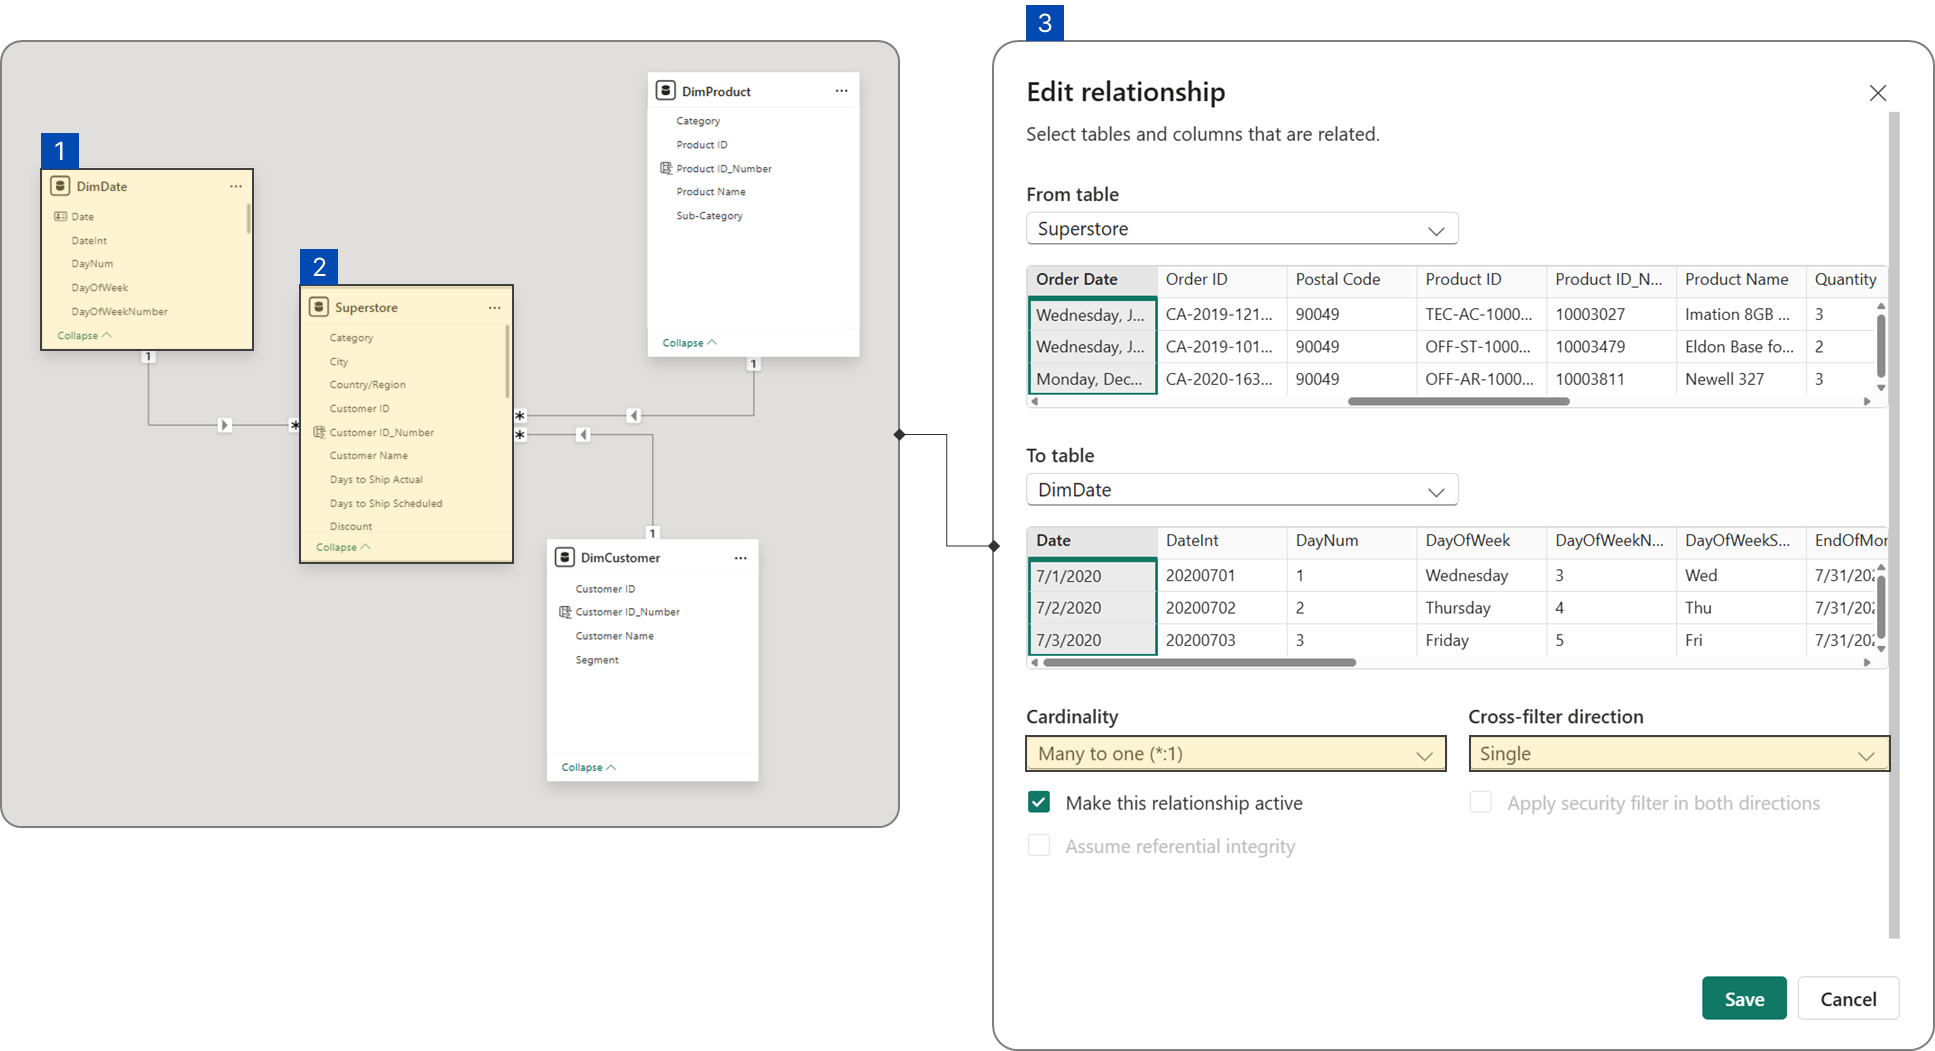 Establish relationship between calendar table and fact table
Step 2: Establishing Essential Base Measures
Next, we'll aggregate the columns relevant to our analysis. For this guide, we'll define three key metrics: total transactions, total revenue, and total quantity.
Measure #01: Total Transactions
Total Transactions
_01 Total Transactions = DISTINCTCOUNT(Superstore[Order ID])Measure #02: Total Revenue
Total Revenue
_01 Total Revenue = SUM(Superstore[Sales])Measure #03: Total Quantity
Total Quantity
_01 Total Quantity = SUM(Superstore[Quantity])Calculate each metric's previous year value with the following DAX measures:
Measure #04: Prior Year Total Transactions
PY Total Transactions
_02 PY Total Transactions =
IF(
  HASONEVALUE(DimDate[Year]),
  CALCULATE(
      [_01 Total Transactions],
      SAMEPERIODLASTYEAR(DimDate[Date])
  ),
  BLANK()
)
Measure #05: Prior Year Total Revenue
PY Total Revenue
_02 PY Total Revenue =
IF(
  HASONEVALUE(DimDate[Year]),
  CALCULATE(
      [_01 Total Revenue],
      SAMEPERIODLASTYEAR(DimDate[Date])
  ),
  BLANK()
)
Measure #06: Prior Year Total Quantity
PY Total Quantity
_02 PY Total Quantity =
IF(
  HASONEVALUE(DimDate[Year]),
  CALCULATE(
      [_01 Total Quantity,
      SAMEPERIODLASTYEAR(DimDate[Date])
  ),
  BLANK()
)
Step 3: Creating the Interactive Metric Cards
Step 4: Creating the IBCS-Standard Pie Charts
4.1 Creating the First Layer of IBCS-Standard Pie Charts
The first layer of the IBCS pie chart will dynamically display each region's market share relative to the total, based on your selected metric card. To accomplish this, we'll start by calculating the selected region's market share using the following DAX measure:
Measure #07: Selected Region Market Share
_01 Selected Region Market Share (AC%) =
VAR TotalAC = CALCULATE(
  [_01 Dynamic Selected Metric (via Field Parameter)],
  ALL(Superstore[Region], Superstore[State])
)
RETURN
DIVIDE([_01 Dynamic Selected Metric (via Field Parameter)], TotalAC, 0)
This measure calculates what percentage of the total market (across all regions) the currently selected region represents.
DAX Explained
Step 1: The VAR (Variable) Section
VAR TotalAC = CALCULATE(
  [_01 Dynamic Selected Metric (via Field Parameter)],
  ALL(Superstore[Region], Superstore[State])
)
What's happening here:
-
VAR TotalAC creates a variable to store the total value
-
CALCULATE modifies the context for the calculation
-
ALL(Superstore[Region], Superstore[State]) removes any filters on Region and State
-
This gives us the grand total across all regions and states
Step 2: The RETURN Section
RETURN
DIVIDE([_01 Dynamic Selected Metric (via Field Parameter)], TotalAC, 0)
What's happening here:
-
DIVIDE safely divides two numbers (handles divide-by-zero)
-
Numerator: The metric for the current region (filtered context)
-
Denominator: The total across all regions (from our variable)
-
0 is the result if division by zero occurs
Next, we need to calculate the remaining market share. We'll do this by simply subtracting the selected region's market share from the total, using the following DAX measure:
Measure #08: Remaining Market Share
_02 Remaining Market Share (AC%) = 1 - [_01 Selected Region Market Share (AC%)]To display this measure on a pie chart, you'll need to create a disconnected table for the pie chart's legend. Just use "Enter data" and input the following "Category" column:
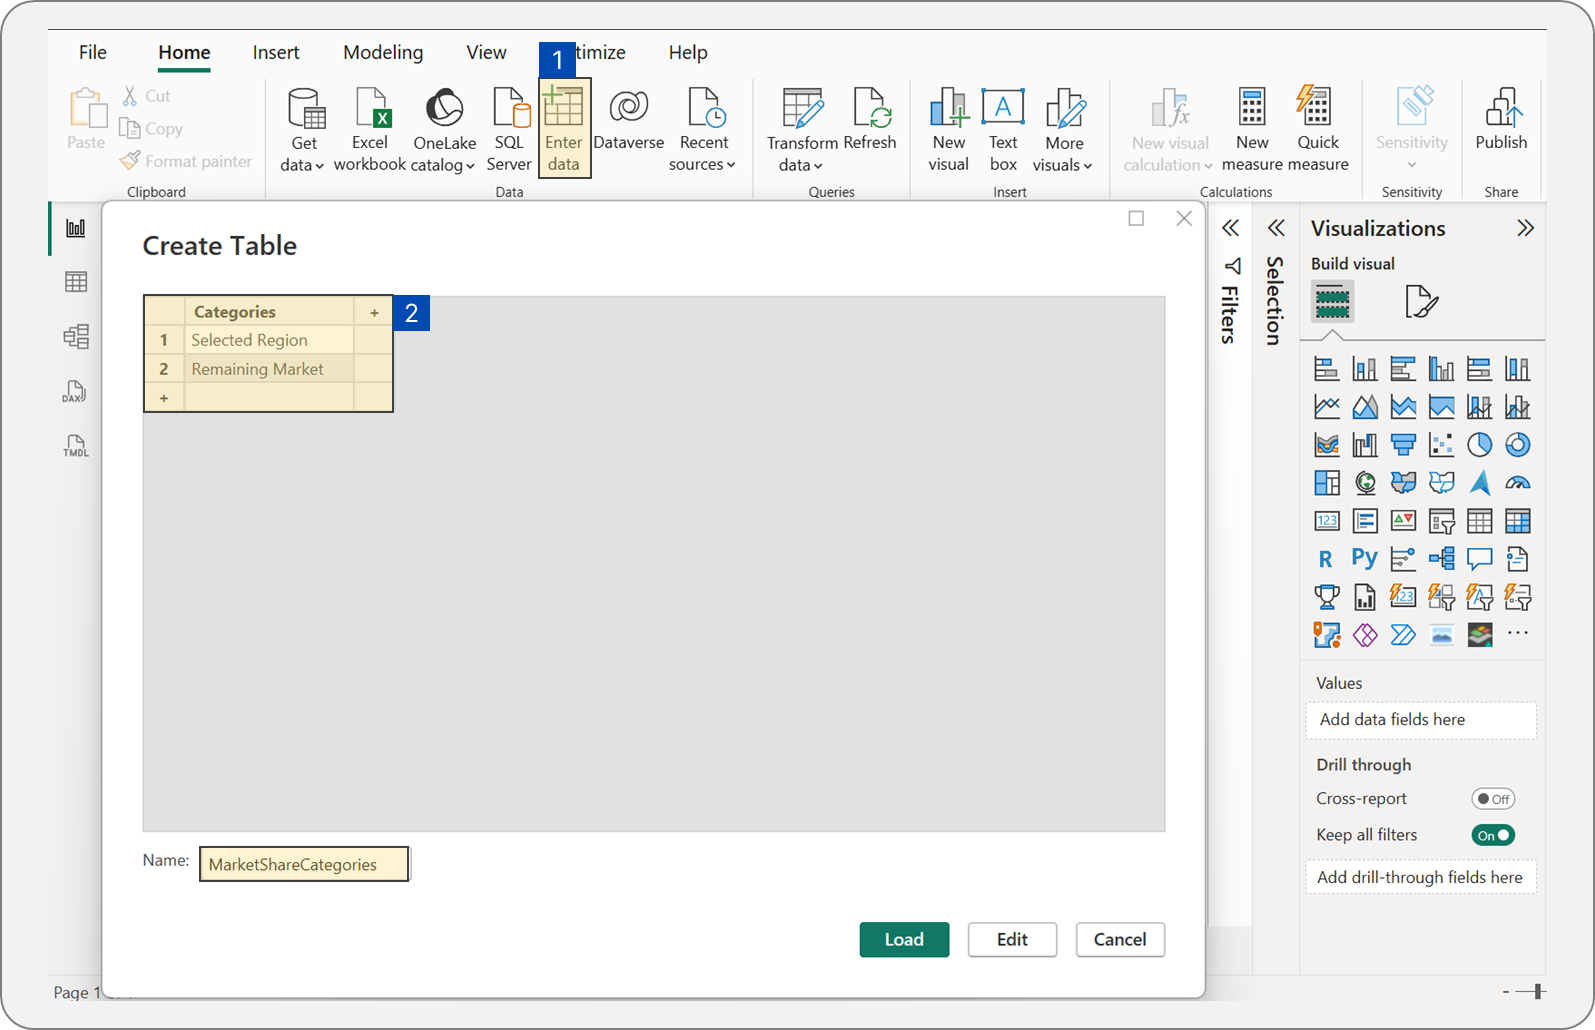 Creating a disconnected table to display selected region and remaining market shares
Next, generate a DAX measure to dynamically display the portion of these two categories based on the applied filters.
Measure #09: Dynamic Market Share Value
_03 Dynamic Market Share Value =
SWITCH(
  SELECTEDVALUE(MarketShareCategories[Category]),
  "Selected Region", [_01 Selected Region Market Share (AC%)],
  "Remaining Market", [_02 Remaining Market Share (AC%)]
)
Generate a pie chart. Add the 'Category' column to the Legend field and the [_03 Dynamic Market Share Value] to the Values field. Remember to filter the visual for each region by dragging the 'Region' column to the visual-level filter and selecting the desired region. For the remaining regions, simply copy and paste the pie chart and change the selected region.
Thanks to the latest Power BI update, we no longer need to create separate oval shapes for borders. You can now directly enable the pie chart's border and adjust color transparency. For the remaining market share section, simply display the pie chart border and set its fill color to transparent (100%). For the selected region's market share section, set its fill color to black (#323232).
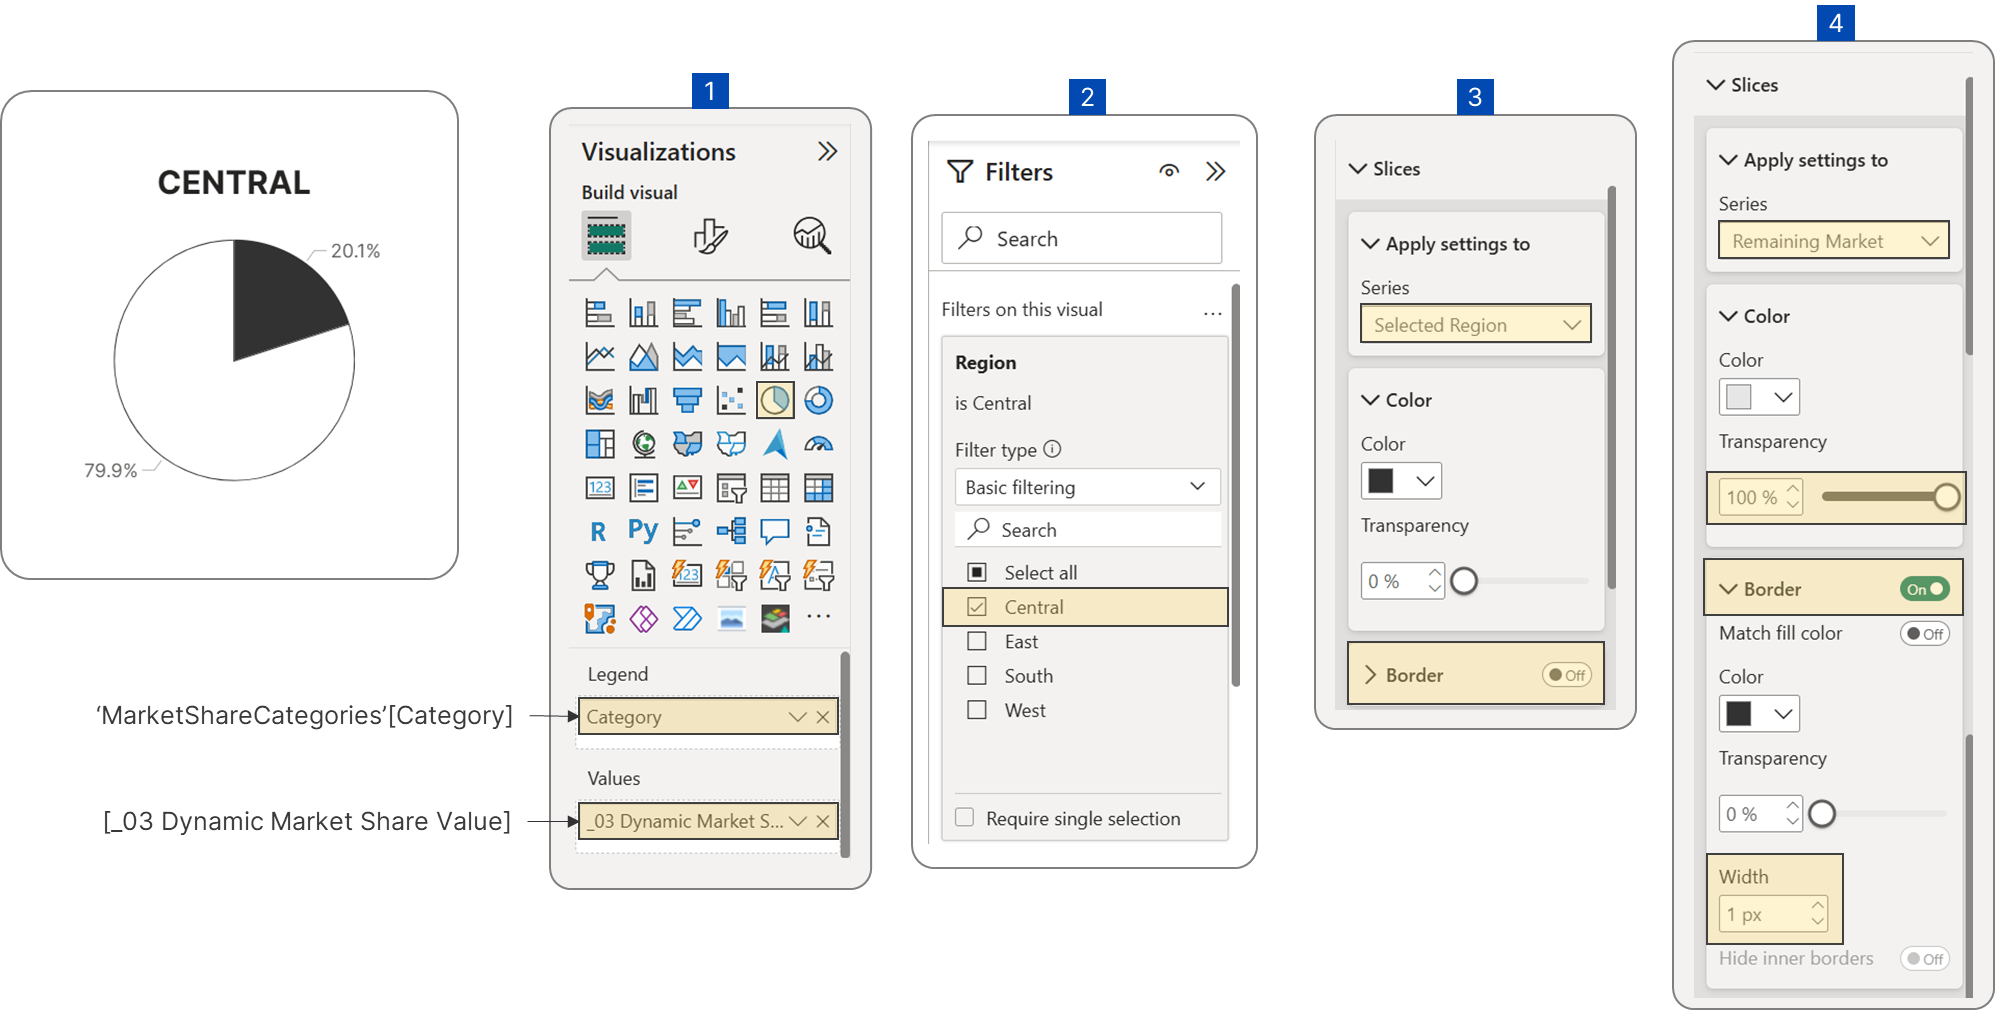 Configuring the first layer of IBCS-standard pie chart
4.2 Creating the Second Layer of IBCS-Standard Pie Charts
The second layer of the IBCS pie chart, positioned atop the first, illustrates market share growth or decline. To calculate the percentage point difference between the current and previous year's market share, we must first determine the previous year's market share for the selected region using the following DAX measure:
Measure #10: Prior Year Selected Region Market Share
_04 Selected Region Market Share (PY%) =
VAR TotalPY = CALCULATE(
  [_02 PY Dynamic Selected Metric (via Field Parameter)],
  ALL(Superstore[Region], Superstore[State])
)
RETURN
DIVIDE([_02 PY Dynamic Selected Metric (via Field Parameter)], TotalPY, 0)
Now, calculate the difference with the following DAX measure:
Measure #11: Dynamic Market Share Variance (Growth/Decline):
_05 Dynamic Market Share Variance (Growth/Decline) =
[_01 Selected Region Market Share (AC%)] - [_04 Selected Region Market Share (PY%)]
Next, we need a measure to determine which market share to display for the selected region (current or previous year's) based on the market share variance. If the market share declines (i.e., the variance is negative), the pie chart will display the current year's market share; otherwise, it will display the previous year's.
Measure #12: Market Share to Display
_06 Market Share to Display =
IF(
  [_05 Dynamic Market Share Variance (Growth/Decline)] < 0,
  [_01 Selected Region Market Share (AC%)],
  [_04 Selected Region Market Share (PY%)]
)
This measure intelligently chooses which market share percentage to display based on whether there was growth or decline in market share.
DAX Explained
Since pie and donut charts don't support conditional formatting for fill colors, we'll need to use two separate DAX measures to display market share variance. One measure will show negative variances in red, and the other will show positive variances in green. Each measure will define the specific condition under which it displays its respective variance.
Measure #13: Dynamic Market Share Growth (Positive Variance)
_09 Dynamic Market Share Growth =
IF(
  [_05 Dynamic Market Share Variance (Growth/Decline)] > 0,
  [_05 Dynamic Market Share Variance (Growth/Decline)]
)
This DAX measure is designed to show only positive market share changes (growth). It filters out any declines or negative changes.
DAX Explained
Measure #14: Dynamic Market Share Decline (Negative Variance)
_10 Dynamic Market Share Decline =
IF(
  [_05 Dynamic Market Share Variance (Growth/Decline)] < 0,
  ABS([_05 Dynamic Market Share Variance (Growth/Decline)])
)
This DAX measure is designed to show only negative market share changes (declines), but it displays them as positive numbers for easier reading and visualization.
DAX Explained
This DAX measure will calculate the remaining market share for the other regions:
Measure #15: Absolute Market Share Variance
_07 Market Share Variance (Absolute) =
ABS([_05 Dynamic Market Share Variance (Growth/Decline)])
Now, similar to the first layer, we need to calculate the remaining market share. This time, however, we'll subtract the sum of the market share to be displayed and the absolute market share variance from the whole portion, using the following DAX measure:
Measure #16: Remaining Market Share
_08 Remaining Market Share =
1 - [_06 Market Share to Display] - [_07 Market Share Variance (Absolute)]
Now that you have all the necessary measures, you can generate a donut chart. Place the measures into the Values field in this specific order: [_06 Market Share to Display], [_09 Dynamic Market Share Growth], [_10 Dynamic Market Share Decline], and [_08 Remaining Market Share]. Once these are in place, you can proceed with configuring the chart's settings.
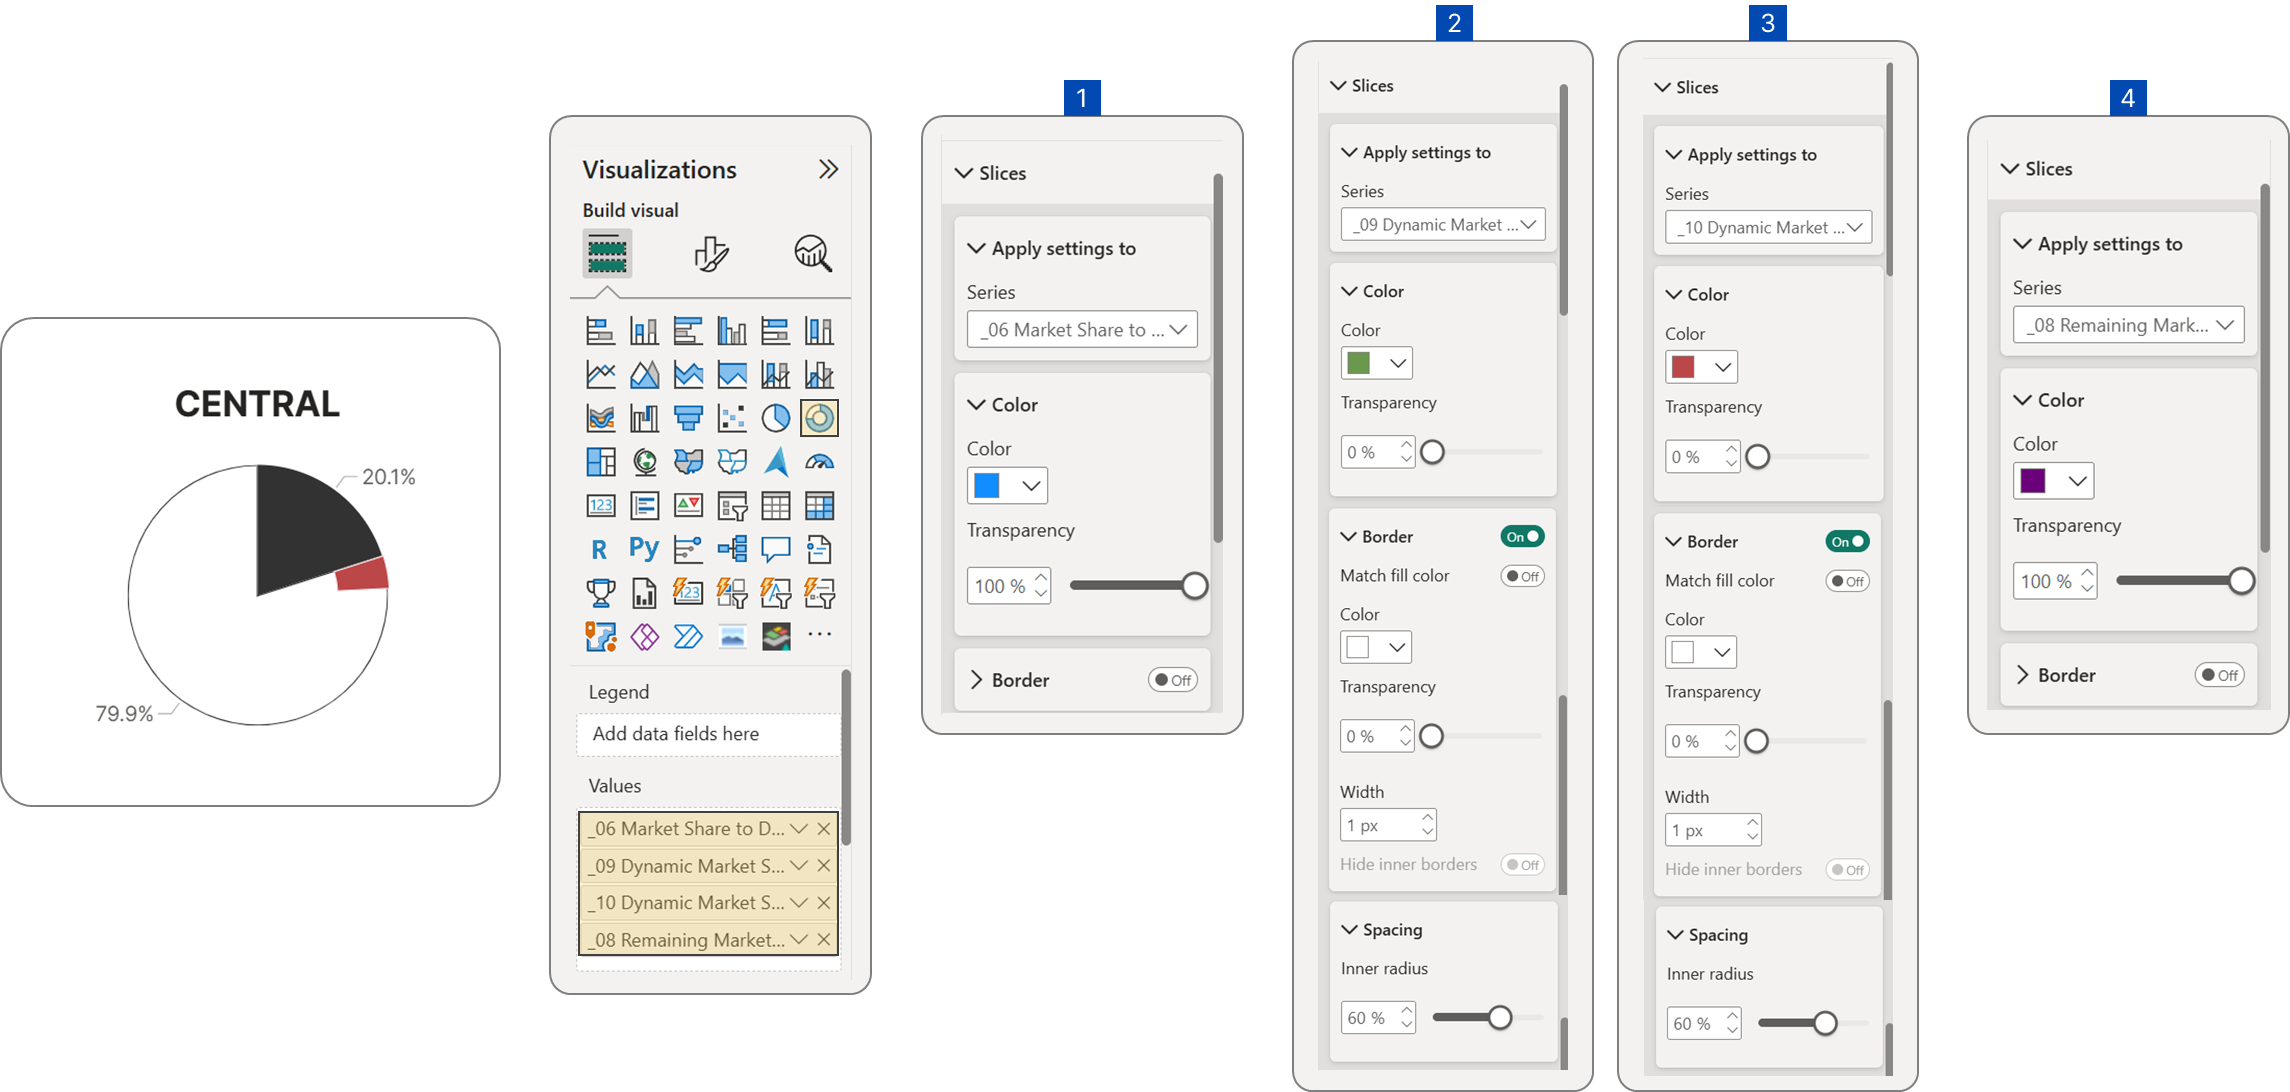 Configuring the first layer of IBCS-standard pie chart
Place this second pie chart layer directly on top of the first. Remember to filter this visual by region, just as you did with the first layer. For the pie charts representing other regions, simply copy and paste, then change the selected region accordingly.