Foreword
DAX Measures
_01 Transactions
Total Transactions
_01 Total Transactions = DISTINCTCOUNT(Superstore[Order ID])PY Total Transactions
_02 PY Total Transactions =
IF(
  HASONEVALUE(DimDate[Year]),
  CALCULATE(
      [_01 Total Transactions],
      SAMEPERIODLASTYEAR(DimDate[Date])
  ),
  BLANK()
)
Error Bars for Positive △PY Total Transactions
_03 Positive Error Bars_△PY Total Transactions =
VAR _CurrentYear = [_01 Total Transactions]
VAR _PreviousYear = [_02 PY Total Transactions]
VAR _HasSurplus = _CurrentYear > _PreviousYear
RETURN
  IF(
      NOT ISBLANK(_PreviousYear) && _HasSurplus,
      _CurrentYear,
      BLANK()
  )
Error Bars for Negative △PY Total Transactions
_03 Negative Error Bars_△PY Total Transactions =
VAR _CurrentYear = [_01 Total Transactions]
VAR _PreviousYear = [_02 PY Total Transactions]
VAR _HasDeficit = _PreviousYear > _CurrentYear
RETURN
  IF(
      NOT ISBLANK(_CurrentYear) && _HasDeficit,
      _PreviousYear,
      BLANK()
  )
_02 Revenue
Total Revenue
_01 Total Revenue = SUM(Superstore[Sales])PY Total Revenue
_02 PY Total Revenue =
IF(
  HASONEVALUE(DimDate[Year]),
  CALCULATE(
      [_01 Total Revenue],
      SAMEPERIODLASTYEAR(DimDate[Date])
  ),
  BLANK()
)
Error Bars for Positive △PY Total Revenue
_03 Positive Error Bars_△PY Total Revenue =
VAR _CurrentYear = [_01 Total Revenue]
VAR _PreviousYear = [_02 PY Total Revenue]
VAR _HasSurplus = _CurrentYear > _PreviousYear
RETURN
  IF(
      NOT ISBLANK(_PreviousYear) && _HasSurplus,
      _CurrentYear,
      BLANK()
  )
Error Bars for Negative △PY Total Revenue
_03 Negative Error Bars_△PY Total Revenue =
VAR _CurrentYear = [_01 Total Revenue]
VAR _PreviousYear = [_02 PY Total Revenue]
VAR _HasDeficit = _PreviousYear > _CurrentYear
RETURN
  IF(
      NOT ISBLANK(_CurrentYear) && _HasDeficit,
      _PreviousYear,
      BLANK()
  )
_03 Total Quantity
Total Quantity
_01 Total Quantity = SUM(Superstore[Quantity])PY Total Quantity
_02 PY Total Quantity =
IF(
  HASONEVALUE(DimDate[Year]),
  CALCULATE(
      [_01 Total Quantity,
      SAMEPERIODLASTYEAR(DimDate[Date])
  ),
  BLANK()
)
Error Bars for Positive △PY Total Quantity
_03 Positive Error Bars_△PY Total Quantity =
VAR _CurrentYear = [_01 Total Quantity]
VAR _PreviousYear = [_02 PY Total Quantity]
VAR _HasSurplus = _CurrentYear > _PreviousYear
RETURN
  IF(
      NOT ISBLANK(_PreviousYear) && _HasSurplus,
      _CurrentYear,
      BLANK()
  )
Error Bars for Negative △PY Total Quantity
_03 Negative Error Bars_△PY Total Quantity =
VAR _CurrentYear = [_01 Total Quantity]
VAR _PreviousYear = [_02 PY Total Quantity]
VAR _HasDeficit = _PreviousYear > _CurrentYear
RETURN
  IF(
      NOT ISBLANK(_CurrentYear) && _HasDeficit,
      _PreviousYear,
      BLANK()
  )
_00 Dynamic Selected Metric (via Disconnected Table)
Dynamic Selected Metric (via Disconnected Table)
_01 Dynamic Selected Metric (via Disconnected Table) =
VAR _SelectedMetric = SELECTEDVALUE('Selected Metric'[Metric])
RETURN
  SWITCH(
      _SelectedMetric,
      "Total Transactions", [_01 Total Transactions],
      "Total Revenue", [_01 Total Revenue],
      "Total Quantity", [_01 Total Quantity],
      BLANK()
  )
PY Dynamic Selected Metric (via Disconnected Table)
_02 PY Dynamic Selected Metric (via Disconnected Table) =
IF(
  HASONEVALUE(DimDate[Year]),
  CALCULATE(
      [_01 Dynamic Selected Metric (via Disconnected Table)],
      SAMEPERIODLASTYEAR(DimDate[Date])
  ),
  BLANK()
)
Error Bars for Positive △PY Dynamic Selected Metric (via Disconnected Table)
_03 Positive Error Bars_△PY Dynamic Selected Metric (via Disconnected Table) =
VAR _CurrentYear = [_01 Dynamic Selected Metric (via Disconnected Table)]
VAR _PreviousYear = [_02 PY Dynamic Selected Metric (via Disconnected Table)]
VAR _HasSurplus = _CurrentYear > _PreviousYear
RETURN
  IF(
      NOT ISBLANK(_PreviousYear) && _HasSurplus,
      _CurrentYear,
      BLANK()
  )
Error Bars for Negative △PY Dynamic Selected Metric (via Disconnected Table)
_03 Negative Error Bars_△PY Dynamic Selected Metric (via Disconnected Table) =
VAR _CurrentYear = [_01 Dynamic Selected Metric (via Disconnected Table)]
VAR _PreviousYear = [_02 PY Dynamic Selected Metric (via Disconnected Table)]
VAR _HasDeficit = _PreviousYear > _CurrentYear
RETURN
  IF(
      NOT ISBLANK(_CurrentYear) && _HasDeficit,
      _PreviousYear,
      BLANK()
  )
Dynamic Title (via Disconnected Table)
_04 Dynamic Title (via Disconnected Table) =
VAR SelectedMetric = SELECTEDVALUE('Selected Metric'[Metric])

RETURN
  SWITCH(
      SelectedMetric,
      "Total Transactions",   "Total Transactions by Sub-Category",
      "Total Revenue",        "Total Revenue by Sub-Category",
      "Total Quantity",       "Total Quantity by Sub-Category",
      "No Selection"          -- Default fallback text
  )
_00 Dynamic Selected Metric (via Field Parameter)
Dynamic Selected Metric (via Field Parameter)
_01 Dynamic Selected Metric (via Field Parameter) =
VAR SelectedVariableOrder = SELECTEDVALUE('PMetric'[PMetric Order])
RETURN
  SWITCH(
      SelectedVariableOrder,
      0, [_01 Total Transactions],
      1, [_01 Total Revenue],
      2, [_01 Total Quantity],
      BLANK()
  )
PY Dynamic Selected Metric (via Field Parameter)
_02 PY Dynamic Selected Metric (via Field Parameter) =
IF(
  HASONEVALUE(DimDate[Year]),
  CALCULATE(
      [_01 Dynamic Selected Metric (via Field Parameter)],
      SAMEPERIODLASTYEAR(DimDate[Date])
  ),
  BLANK()
)
Error Bars for Positive △PY Dynamic Selected Metric (via Field Parameter)
_03 Positive Error Bars_△PY Dynamic Selected Metric (via Field Parameter) =
VAR _CurrentYear = [_01 Dynamic Selected Metric (via Field Parameter)]
VAR _PreviousYear = [_02 PY Dynamic Selected Metric (via Field Parameter)]
VAR _HasSurplus = _CurrentYear > _PreviousYear
RETURN
  IF(
      NOT ISBLANK(_PreviousYear) && _HasSurplus,
      _CurrentYear,
      BLANK()
  )
Error Bars for Negative △PY Dynamic Selected Metric (via Field Parameter)
_03 Negative Error Bars_△PY Dynamic Selected Metric (via Field Parameter) =
VAR _CurrentYear = [_01 Dynamic Selected Metric (via Field Parameter)]
VAR _PreviousYear = [_02 PY Dynamic Selected Metric (via Field Parameter)]
VAR _HasDeficit = _PreviousYear > _CurrentYear
RETURN
  IF(
      NOT ISBLANK(_CurrentYear) && _HasDeficit,
      _PreviousYear,
      BLANK()
  )
Dynamic Title (via Field Parameter)
_04 Dynamic Title (via Field Parameter) =
VAR _SelectedVariableOrder = SELECTEDVALUE('PMetric'[PMetric Order])

RETURN
SWITCH(
  _SelectedVariableOrder,

  -- Transaction Metrics
  0, "Total Transactions by Sub-Category",

  -- Revenue Metrics
  1, "Total Revenue by Sub-Category",

  -- Quantity Metrics
  2, "Total Quantity by Sub-Category",

  -- Default when no selection
  "No Selection"
)
Calendar ‘DimDate’ Table
DimDate =
ADDCOLUMNS (
  CALENDAR ("2017-01-01", "2021-12-31"),
  "DateInt", FORMAT ( [Date], "YYYYMMDD" ),
  "Year", YEAR ( [Date] ),
  "Monthnumber", FORMAT ( [Date], "MM" ),
  "MonthNameShort", FORMAT ( [Date], "mmm" ),
  "MonthNameLong", FORMAT ( [Date], "mmmm" ),
  "DayOfWeekNumber", WEEKDAY ( [Date], 2 ),  // Monday = 1
  "DayOfWeek", FORMAT ( [Date], "dddd"),
  "DayOfWeekShort", FORMAT ( [Date], "ddd" ),
  "DayNumber", DAY ( [Date] ),
  "Quarter", "Q" & FORMAT ( [Date], "Q" ),
  "YearQuarter", FORMAT ( [Date], "YYYY" ) & "/Q" & FORMAT ( [Date], "Q" ),
  "EndOfMonth", EOMONTH([Date], 0),
  "WeekNumber", WEEKNUM([Date], 2),  // Week starts on Monday
  "YearMonth", FORMAT ( [Date], "MMMM YYYY" ),
  "YearMonthNumber", FORMAT ( [Date], "YYYYMM" )
)
Documentation
Step 1: Build Your DimDate (Calendar) Table
Once you've imported the dataset (available on my GitHub repository), the first step is to create a calendar table. This table will serve as our reference for all time-intelligence functions. To begin, create a new table and use the following DAX measure:
DAX measure to create a calendar table:
DimDate =
ADDCOLUMNS (
  CALENDAR ("2017-01-01", "2021-12-31"),
  "DateInt", FORMAT ( [Date], "YYYYMMDD" ),
  "Year", YEAR ( [Date] ),
  "Monthnumber", FORMAT ( [Date], "MM" ),
  "MonthNameShort", FORMAT ( [Date], "mmm" ),
  "MonthNameLong", FORMAT ( [Date], "mmmm" ),
  "DayOfWeekNumber", WEEKDAY ( [Date], 2 ),  // Monday = 1
  "DayOfWeek", FORMAT ( [Date], "dddd"),
  "DayOfWeekShort", FORMAT ( [Date], "ddd" ),
  "DayNumber", DAY ( [Date] ),
  "Quarter", "Q" & FORMAT ( [Date], "Q" ),
  "YearQuarter", FORMAT ( [Date], "YYYY" ) & "/Q" & FORMAT ( [Date], "Q" ),
  "EndOfMonth", EOMONTH([Date], 0),
  "WeekNumber", WEEKNUM([Date], 2),  // Week starts on Monday
  "YearMonth", FORMAT ( [Date], "MMMM YYYY" ),
  "YearMonthNumber", FORMAT ( [Date], "YYYYMM" )
)
Be sure to mark your 'date' column as a date table. For proper sorting, arrange your month columns by their month number and your day columns by their day number.
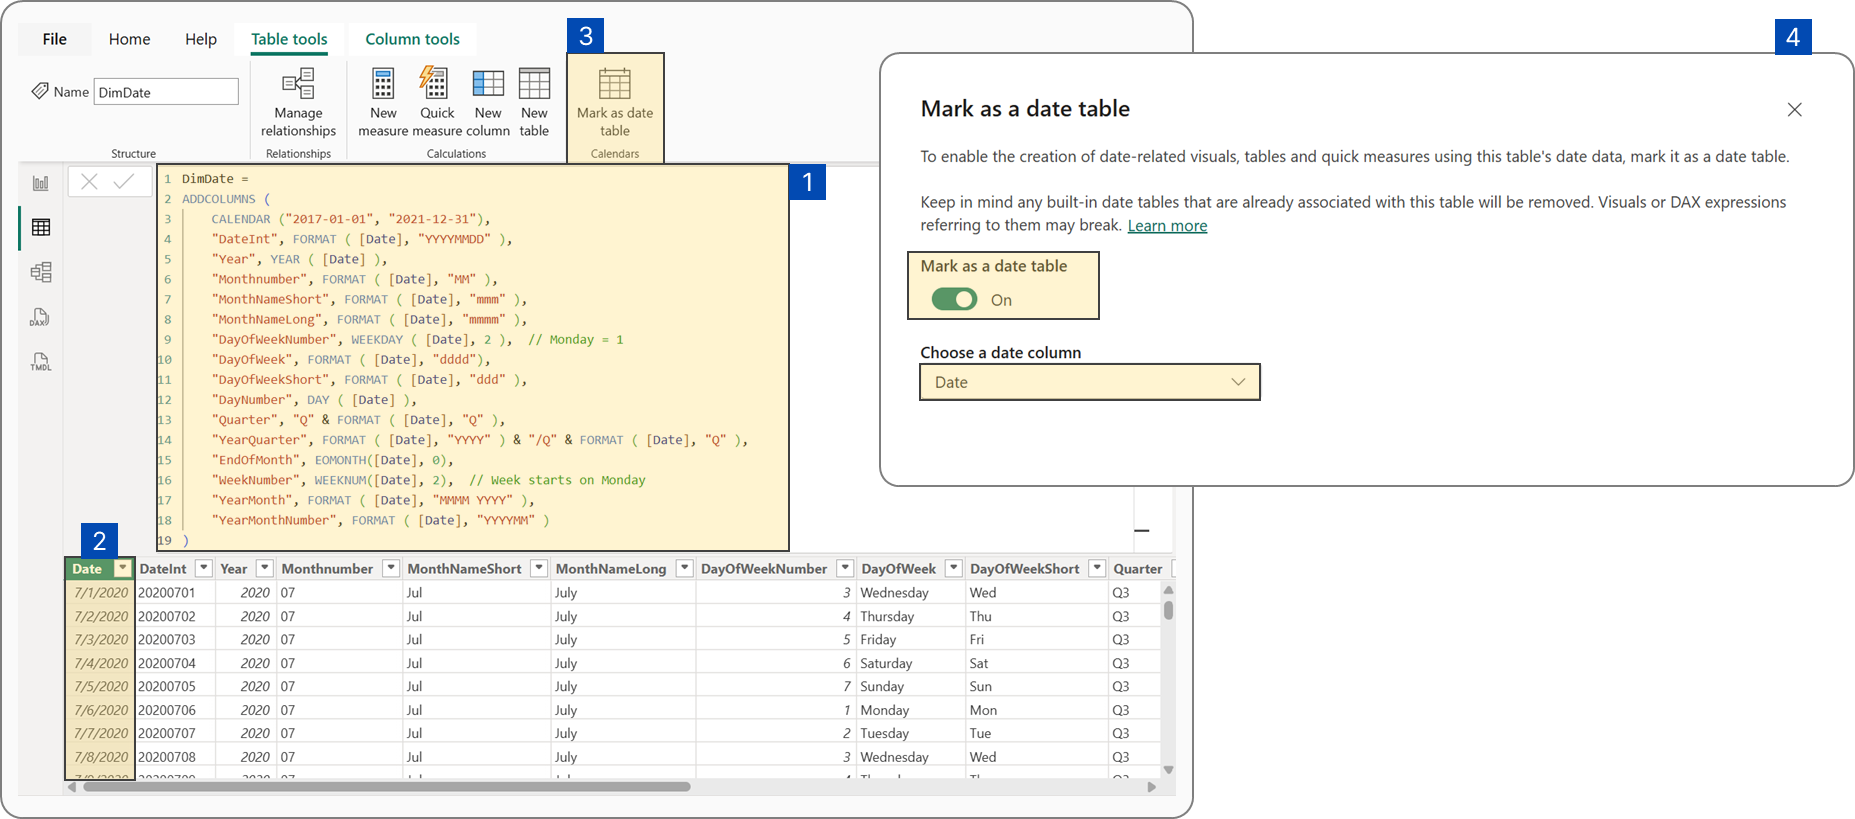 Mark the date column as a date table
In the data model, establish a many-to-one, single-direction relationship between the dimdate (calendar) table and your fact table.
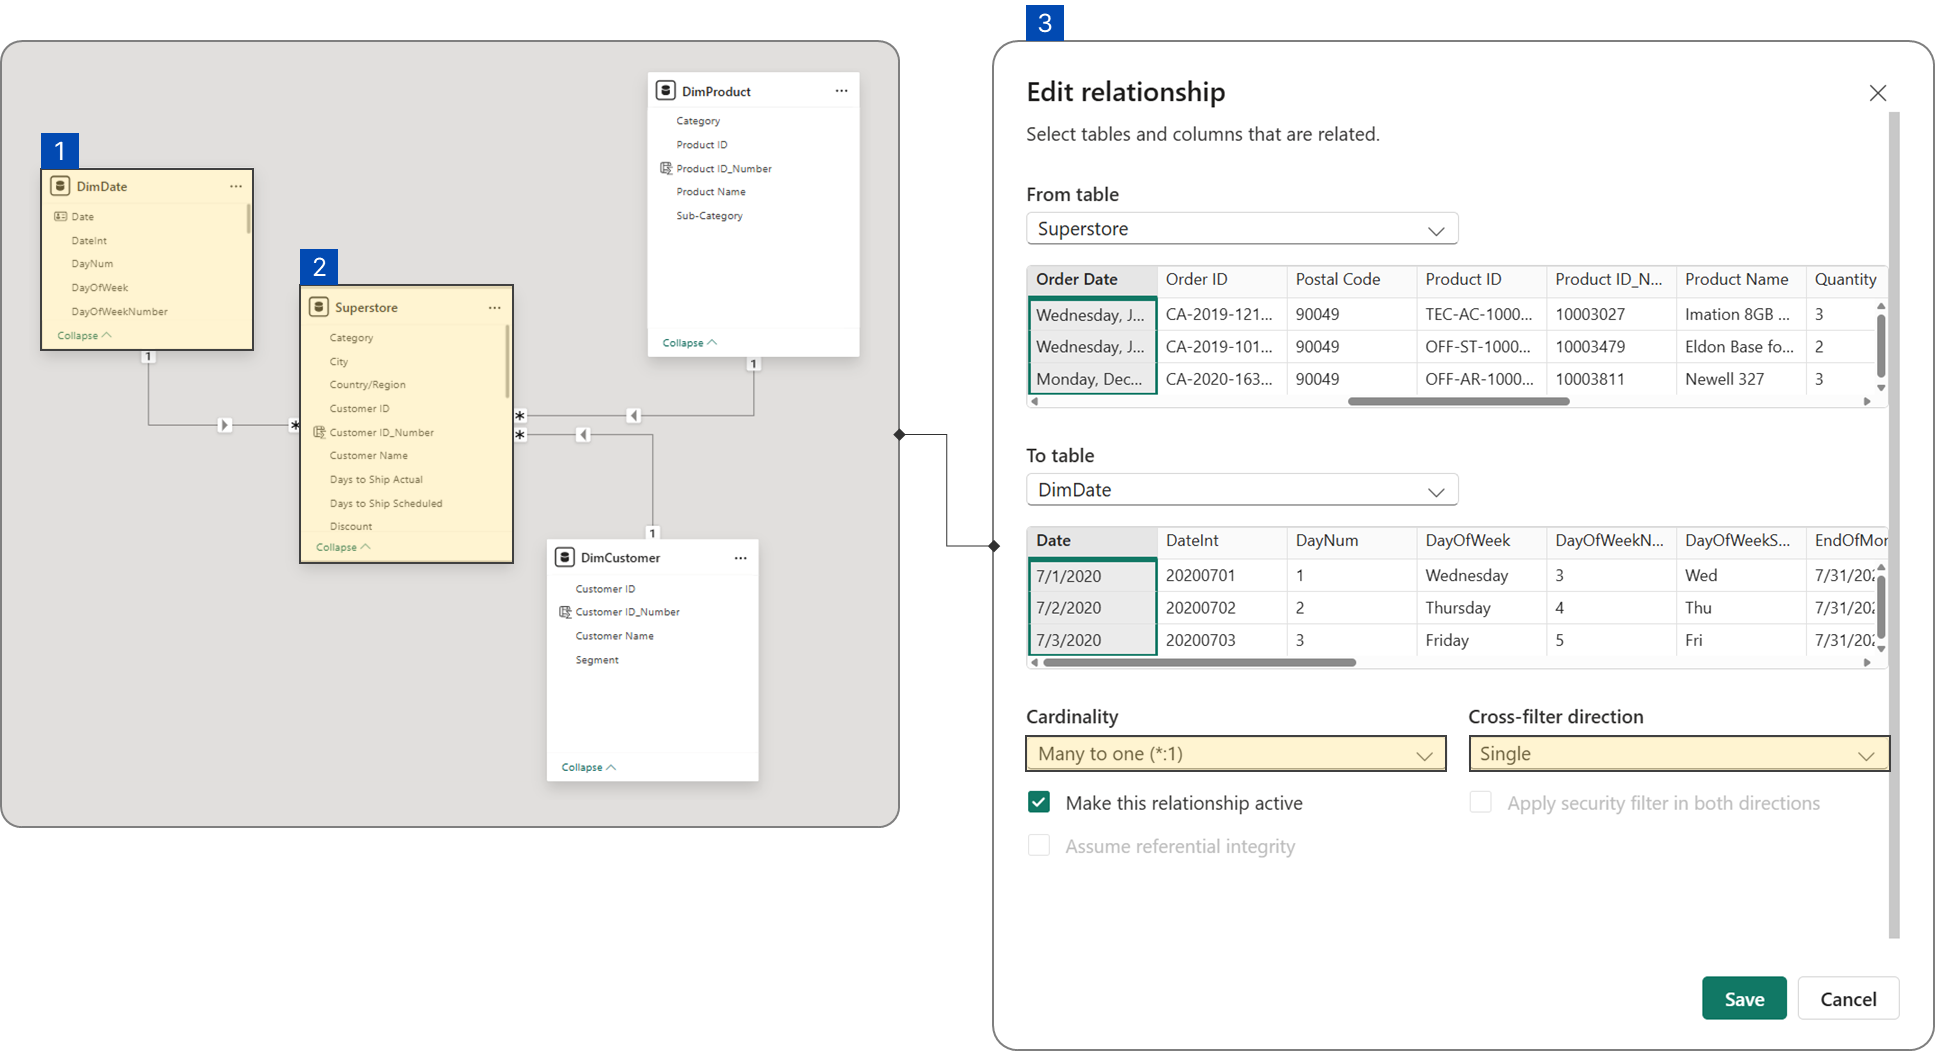 Establish relationship between calendar table and fact table
Step 2: Establishing Essential Base Measures
Next, we'll aggregate the columns relevant to our analysis. For this guide, we'll define three key metrics: total transactions, total revenue, and total quantity.
Measure #01: Total Transactions
Total Transactions
_01 Total Transactions = DISTINCTCOUNT(Superstore[Order ID])Measure #02: Total Revenue
Total Revenue
_01 Total Revenue = SUM(Superstore[Sales])Measure #03: Total Quantity
Total Quantity
_01 Total Quantity = SUM(Superstore[Quantity])Calculate each metric's previous year value with the following DAX measures:
Measure #04: Prior Year Total Transactions
PY Total Transactions
_02 PY Total Transactions =
IF(
  HASONEVALUE(DimDate[Year]),
  CALCULATE(
      [_01 Total Transactions],
      SAMEPERIODLASTYEAR(DimDate[Date])
  ),
  BLANK()
)
Measure #05: Prior Year Total Revenue
PY Total Revenue
_02 PY Total Revenue =
IF(
  HASONEVALUE(DimDate[Year]),
  CALCULATE(
      [_01 Total Revenue],
      SAMEPERIODLASTYEAR(DimDate[Date])
  ),
  BLANK()
)
Measure #06: Prior Year Total Quantity
PY Total Quantity
_02 PY Total Quantity =
IF(
  HASONEVALUE(DimDate[Year]),
  CALCULATE(
      [_01 Total Quantity,
      SAMEPERIODLASTYEAR(DimDate[Date])
  ),
  BLANK()
)
Create a bar chart to visualize each sub-category's performance across various metrics. Place the sub-category column on the Y-axis and each metric (along with its previous year's value) on the X-axis. Following IBCS standards, the previous period's value should be positioned above the current year's value on the bar chart, allowing for easy comparison.
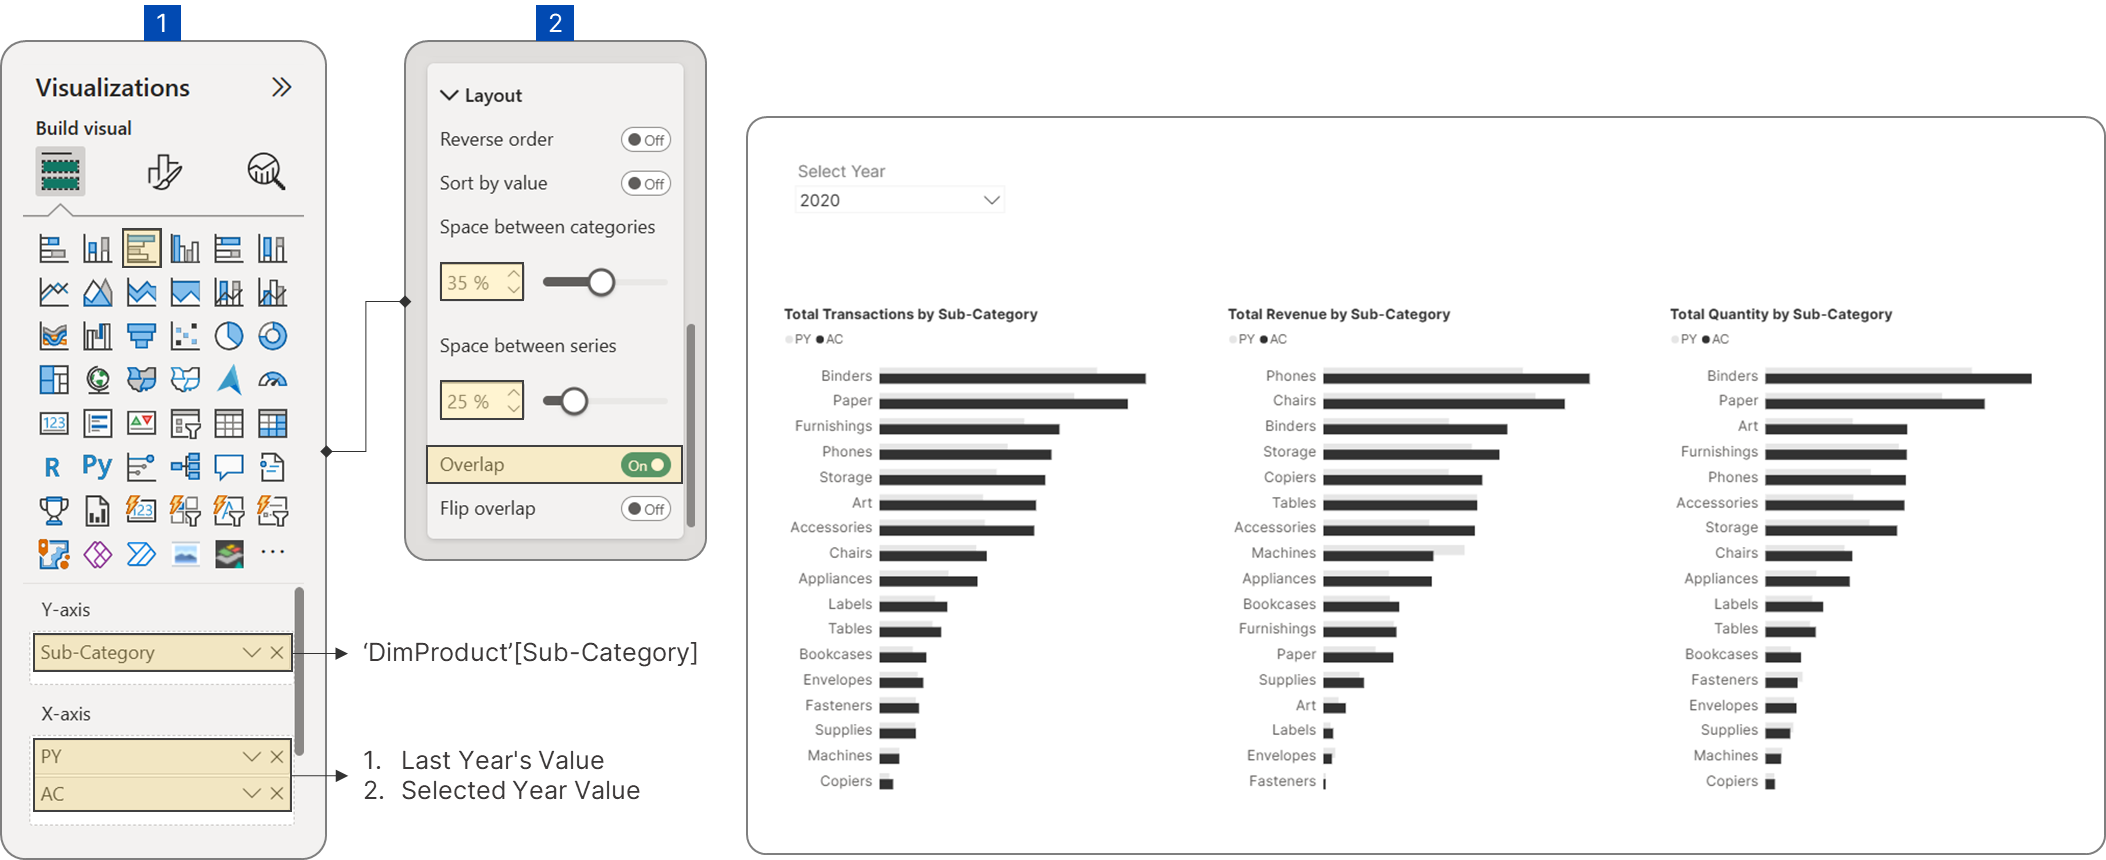 Create bar charts to display last year's and the selected year's values.
Step 3: Visualizing Current vs. Prior Year Variance
After setting up your bar chart, the final step is to visualize the variance between the previous and current year's values using error bars. Since Power BI's error bars don't support conditional formatting directly, we'll need to display positive and negative variances separately. This allows us to apply distinct colors: green for positive variance and red for negative variance.
To create the error bars for positive variance, use the following DAX measure:
Measure #07: Positive Error Bars for △PY Total Transactions
_03 Positive Error Bars_△PY Total Transactions =
VAR _CurrentYear = [_01 Total Transactions]
VAR _PreviousYear = [_02 PY Total Transactions]
VAR _HasSurplus = _CurrentYear > _PreviousYear
RETURN
  IF(
      NOT ISBLANK(_PreviousYear) && _HasSurplus,
      _CurrentYear,
      BLANK()
  )
To display positive variance for other metrics, simply change the metric within the DAX formula or copy and paste the formula from the 'DAX Measures' section.
DAX Explained
This measure helps visualize when your current year performance is better than the previous year by only showing values when there's growth.
Step-by-Step Breakdown
Variables Section:
VAR _CurrentYear = [_01 Total Transactions]
VAR _PreviousYear = [_02 PY Total Transactions]
VAR _HasSurplus = _CurrentYear > _PreviousYear-
CurrentYear- Gets the current year's total transactions from another measure -
PreviousYear- Gets the previous year's total transactions from another measure -
HasSurplus- Creates a TRUE/FALSE check: "Is current year greater than previous year?"
Logic Section:
IF(
  NOT ISBLANK(_PreviousYear) && _HasSurplus,
  _CurrentYear,
  BLANK()
)
This says: "IF we have previous year data AND current year is higher than previous year, THEN show the current year value, OTHERWISE show nothing (blank)."
To create the error bars for negative variance, use the following DAX measure:
Measure #08: Negative Error Bars for △PY Total Transactions
_03 Negative Error Bars_△PY Total Transactions =
VAR _CurrentYear = [_01 Total Transactions]
VAR _PreviousYear = [_02 PY Total Transactions]
VAR _HasDeficit = _PreviousYear > _CurrentYear
RETURN
  IF(
      NOT ISBLANK(_CurrentYear) && _HasDeficit,
      _PreviousYear,
      BLANK()
  )
To display positive variance for other metrics, simply change the metric within the DAX formula or copy and paste the formula from the 'DAX Measures' section.
DAX Explained
This measure helps visualize when your current year performance is worse than the previous year by only showing values when there's a decline.
Step-by-Step Breakdown
Variables Section:
VAR _CurrentYear = [_01 Total Transactions]
VAR _PreviousYear = [_02 PY Total Transactions]
VAR _HasDeficit = _PreviousYear > _CurrentYear-
CurrentYear- Gets the current year's total transactions -
PreviousYear- Gets the previous year's total transactions -
HasDeficit- Creates a TRUE/FALSE check: "Is previous year greater than current year?" (meaning we declined)
Logic Section:
IF(
  NOT ISBLANK(_CurrentYear) && _HasDeficit,
  _PreviousYear,
  BLANK()
)
This says: "IF we have current year data AND current year is lower than previous year, THEN show the previous year value, OTHERWISE show nothing (blank)."
Key Difference from Positive Error Bars
Notice that when there's a deficit, it returns _PreviousYear (the higher value), not the current year. This creates the visual "error bar" effect showing how high you used to be.
Next, place these measures in the upper bound of your error bars. Assign the positive variance (Measure #07) to the previous year's value and the negative variance (Measure #08) to the current selected year's value.
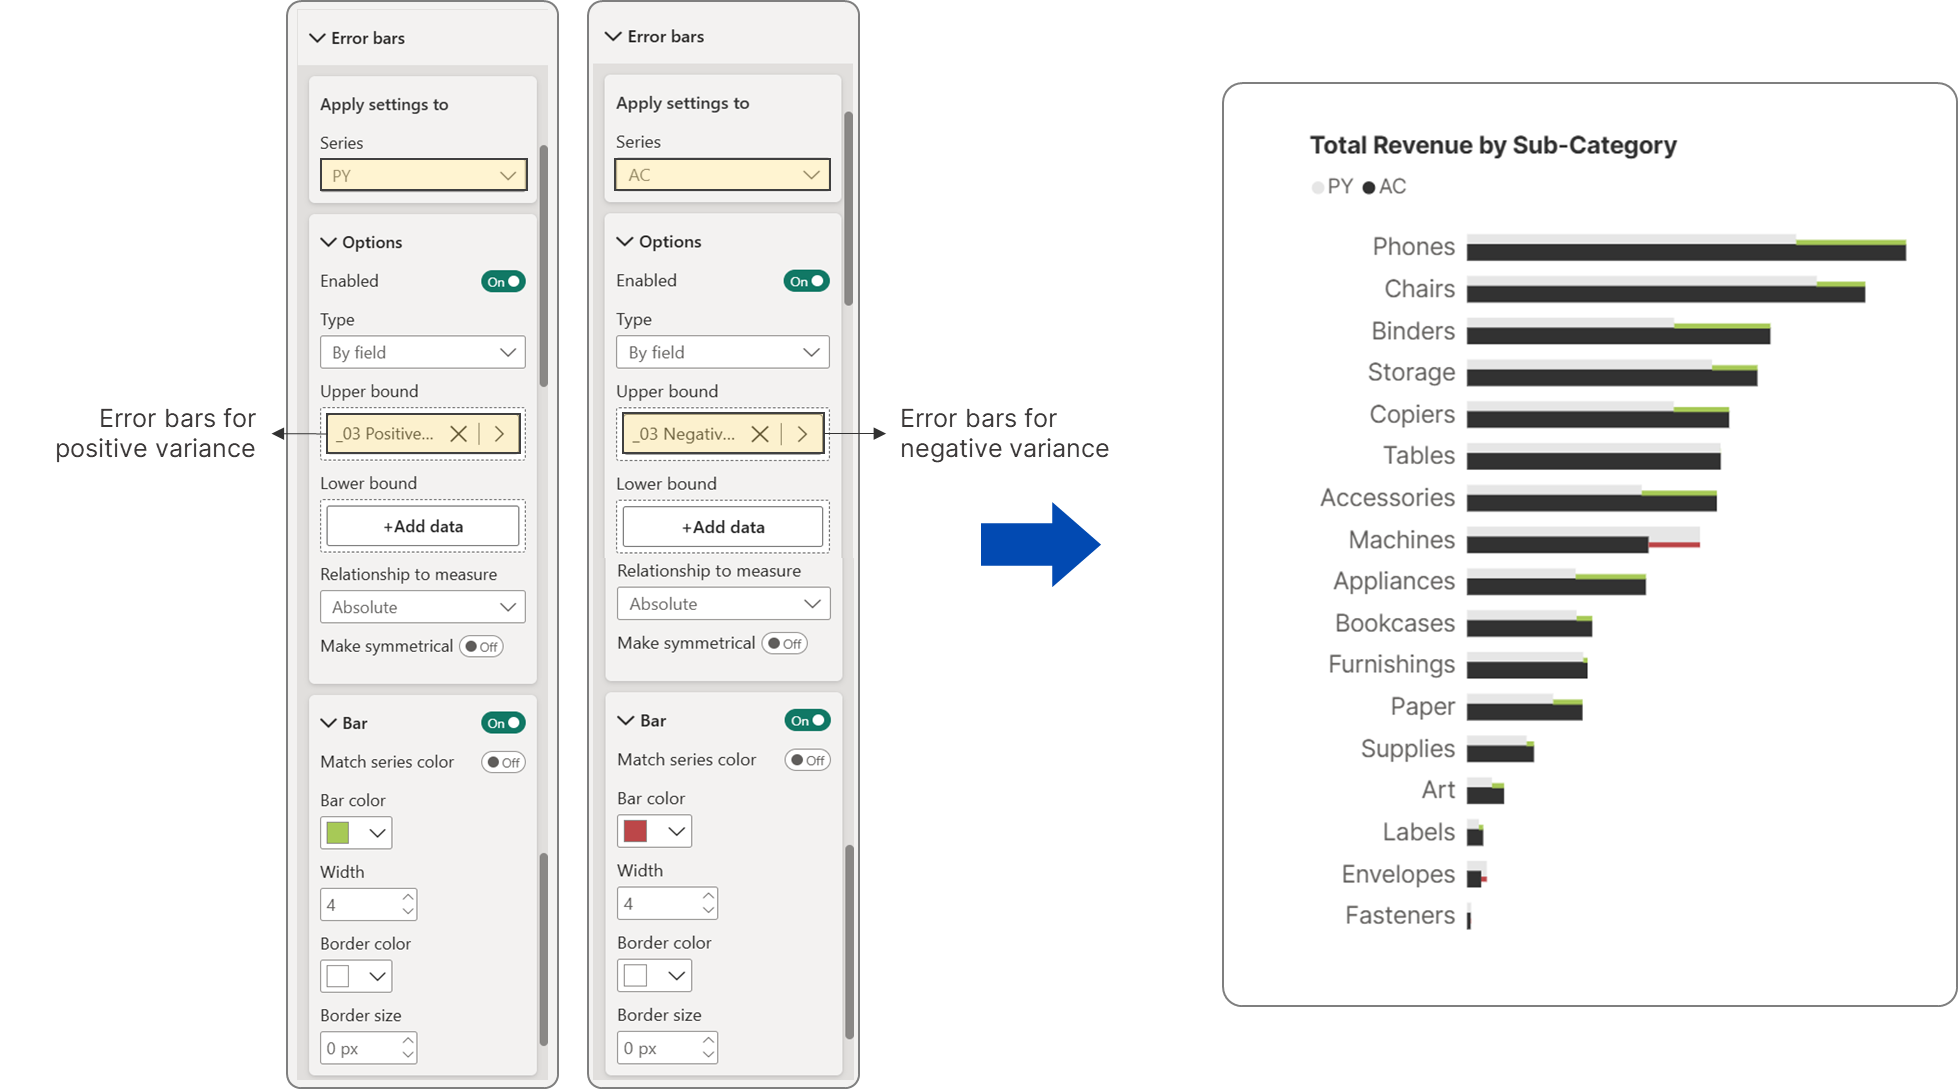 Visualize positive and negative variances using error bars.
Step 4: Adapting Error Bar Variances to Selected Metrics
Error bars can also dynamically adjust based on the selected metric. This can be achieved in two ways: by creating a disconnected table for metric selection or by using field parameters.
4.1. Dynamic Metric Selection with a Disconnected Table
If you prefer a disconnected table, use the following DAX measure to generate a table containing your desired metrics:
Disconnected Table #01: Selected Metric
Selected Metric =
DATATABLE (
  "Metric", STRING,
  "Order", INTEGER,
  {
      {"Total Transactions", 1},
      {"Total Revenue", 2},
      {"Total Quantity", 3},
  }
)
Sort the 'Metric' column by the 'Order' column to ensure chronological order.
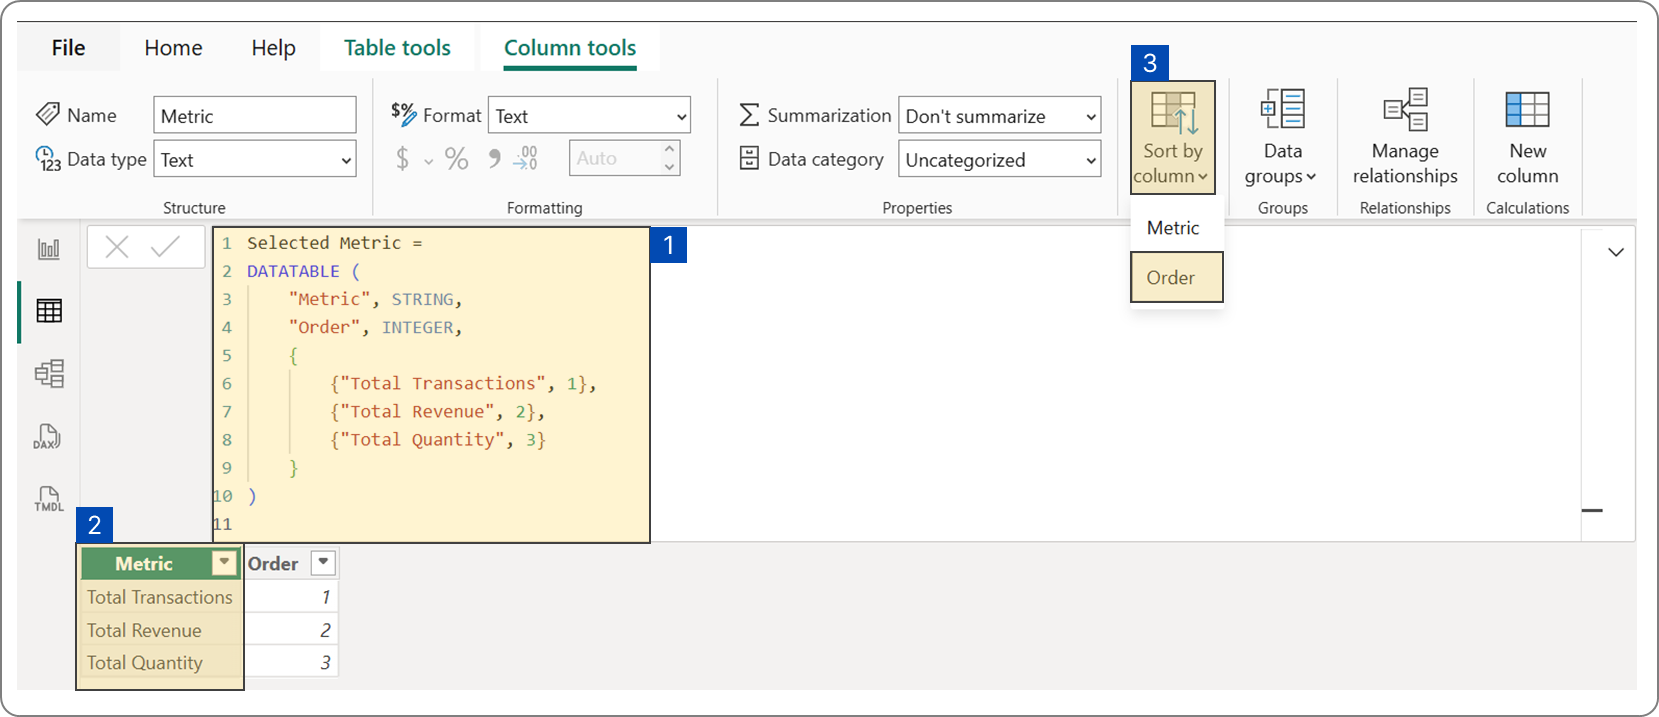 Create a disconnected table for metric selection.
Create a dropdown slicer, placing the 'Metric' column in its field and setting it to 'Single Select'.
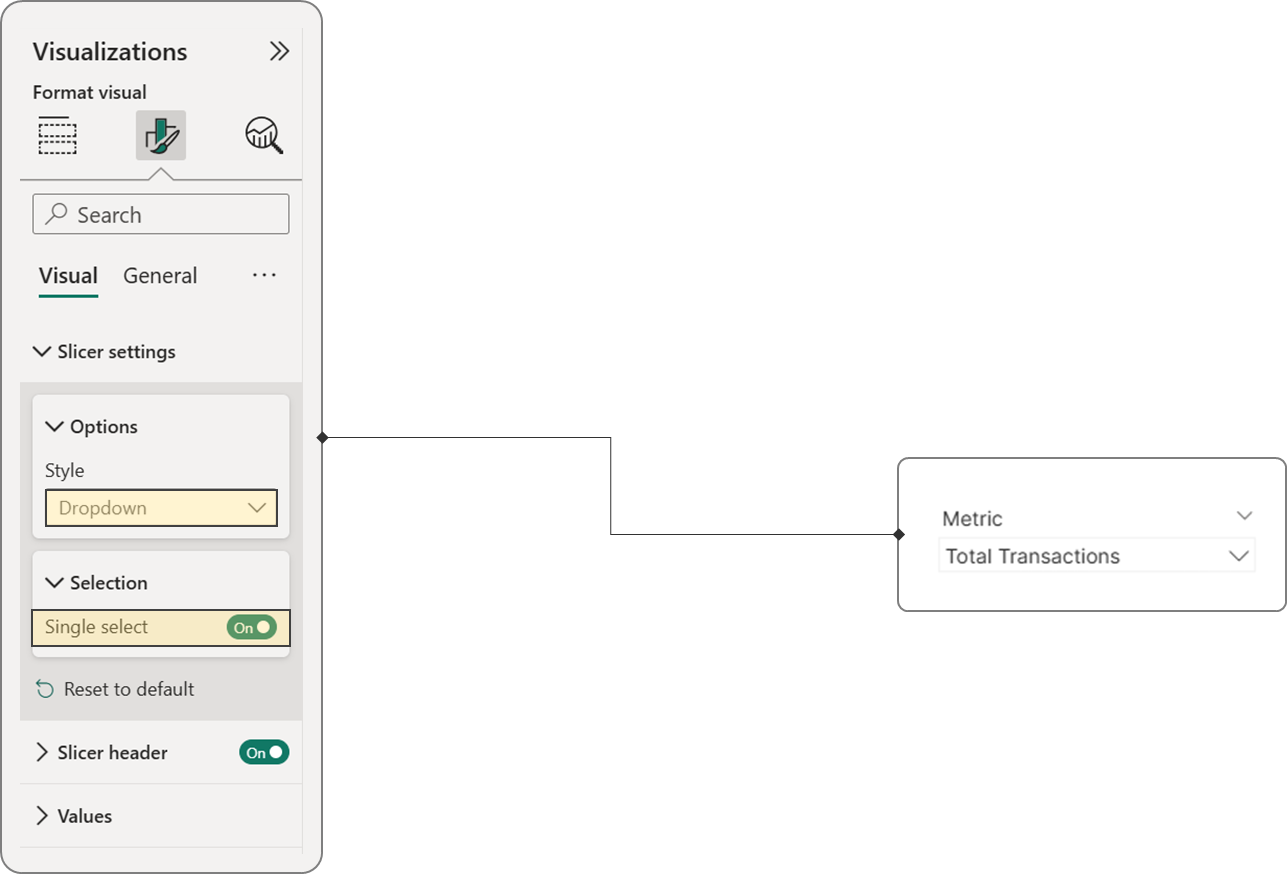 Create the metric selection Slicer
Now, to connect this table with your bar chart, generate the following DAX measures. These will calculate both the current (selected) year's value and the previous year's value, dynamically based on your slicer selection:
Measure #09: Dynamic Selected Metric (via Disconnected Table)
_01 Dynamic Selected Metric (via Disconnected Table)) =
VAR _SelectedMetric = SELECTEDVALUE('Selected Metric'[Metric])
RETURN
  SWITCH(
      _SelectedMetric,
      "Total Transactions", [_01 Total Transactions],
      "Total Revenue", [_01 Total Revenue],
      "Total Quantity", [_01 Total Quantity],
      BLANK()
  )
To calculate the previous year's value, simply replace the existing previous year's metric value with the dynamic one.
Measure #10: Prior Year Dynamic Selected Metric (via Disconnected Table)
_02 PY Dynamic Selected Metric (via Disconnected Table) =
IF(
  HASONEVALUE(DimDate[Year]),
  CALCULATE(
      [_01 Dynamic Selected Metric (via Disconnected Table)],
      SAMEPERIODLASTYEAR(DimDate[Date])
  ),
  BLANK()
)
Apply the same steps to display positive and negative variances with error bars.
Measure #11: Error Bars for Positive △PY Dynamic Selected Metric (via Disconnected Table)
_03 Positive Error Bars_△PY Dynamic Selected Metric (via Disconnected Table) =
VAR _CurrentYear = [_01 Dynamic Selected Metric (via Disconnected Table)]
VAR _PreviousYear = [_02 PY Dynamic Selected Metric (via Disconnected Table)]
VAR _HasSurplus = _CurrentYear > _PreviousYear
RETURN
  IF(
      NOT ISBLANK(_PreviousYear) && _HasSurplus,
      _CurrentYear,
      BLANK()
  )
Measure #12: Error Bars for Negative △PY Dynamic Selected Metric (via Disconnected Table)
_03 Negative Error Bars_△PY Dynamic Selected Metric (via Disconnected Table) =
VAR _CurrentYear = [_01 Dynamic Selected Metric (via Disconnected Table)]
VAR _PreviousYear = [_02 PY Dynamic Selected Metric (via Disconnected Table)]
VAR _HasDeficit = _PreviousYear > _CurrentYear
RETURN
  IF(
      NOT ISBLANK(_CurrentYear) && _HasDeficit,
      _PreviousYear,
      BLANK()
  )
Next, simply replace your current 'static' metrics with the new dynamic ones. Your chart will then update automatically based on your slicer selection. To further enhance clarity, apply conditional formatting to the chart title so it dynamically reflects the currently selected metric.
Measure #13: Dynamic Title (via Disconnected Table)
_04 Dynamic Title (via Disconnected Table) =
VAR SelectedMetric = SELECTEDVALUE('Selected Metric'[Metric])
RETURN
SWITCH(
SelectedMetric,
"Total Transactions", "Total Transactions by Sub-Category",
"Total Revenue", "Total Revenue by Sub-Category",
"Total Quantity", "Total Quantity by Sub-Category",
"No Selection" -- Default fallback text
)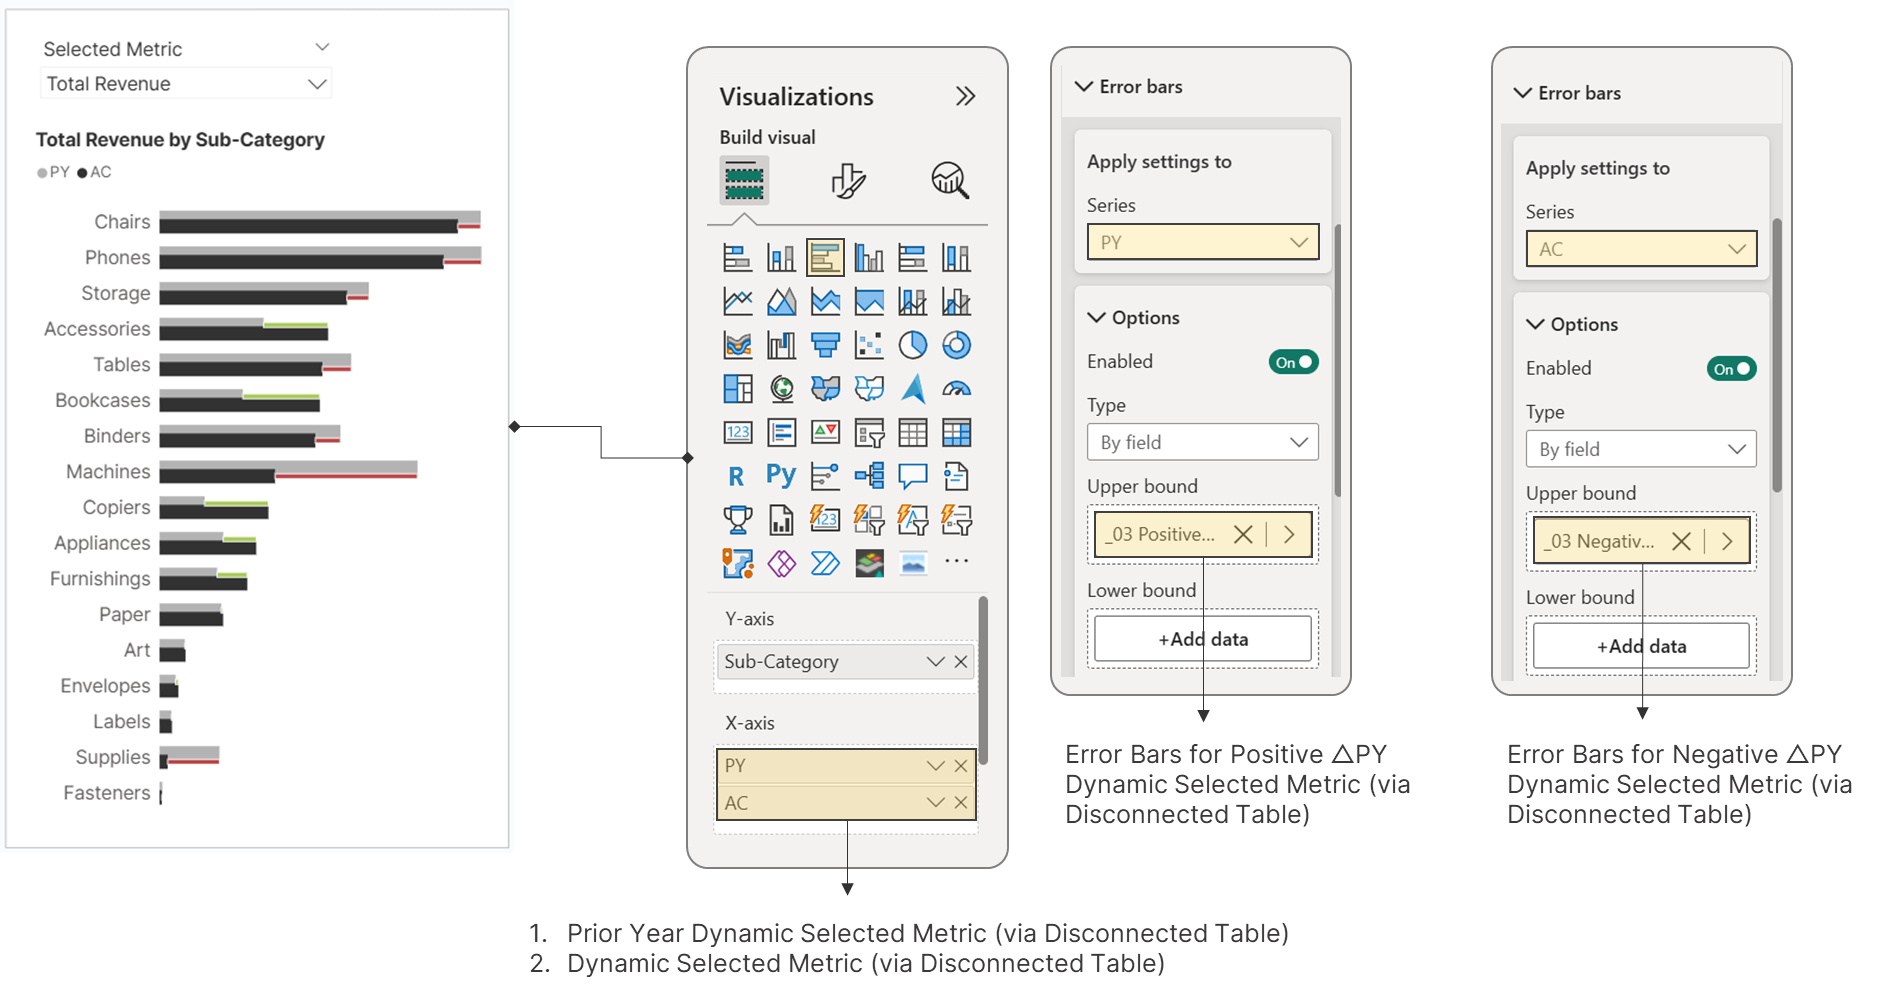 Replace your current 'static' metrics with the new dynamic ones.
4.2. Dynamic Metric Selection with a Field Parameter
If you prefer field parameters, create one and include the measures you want to select from. Don't forget to add a slicer to your page.
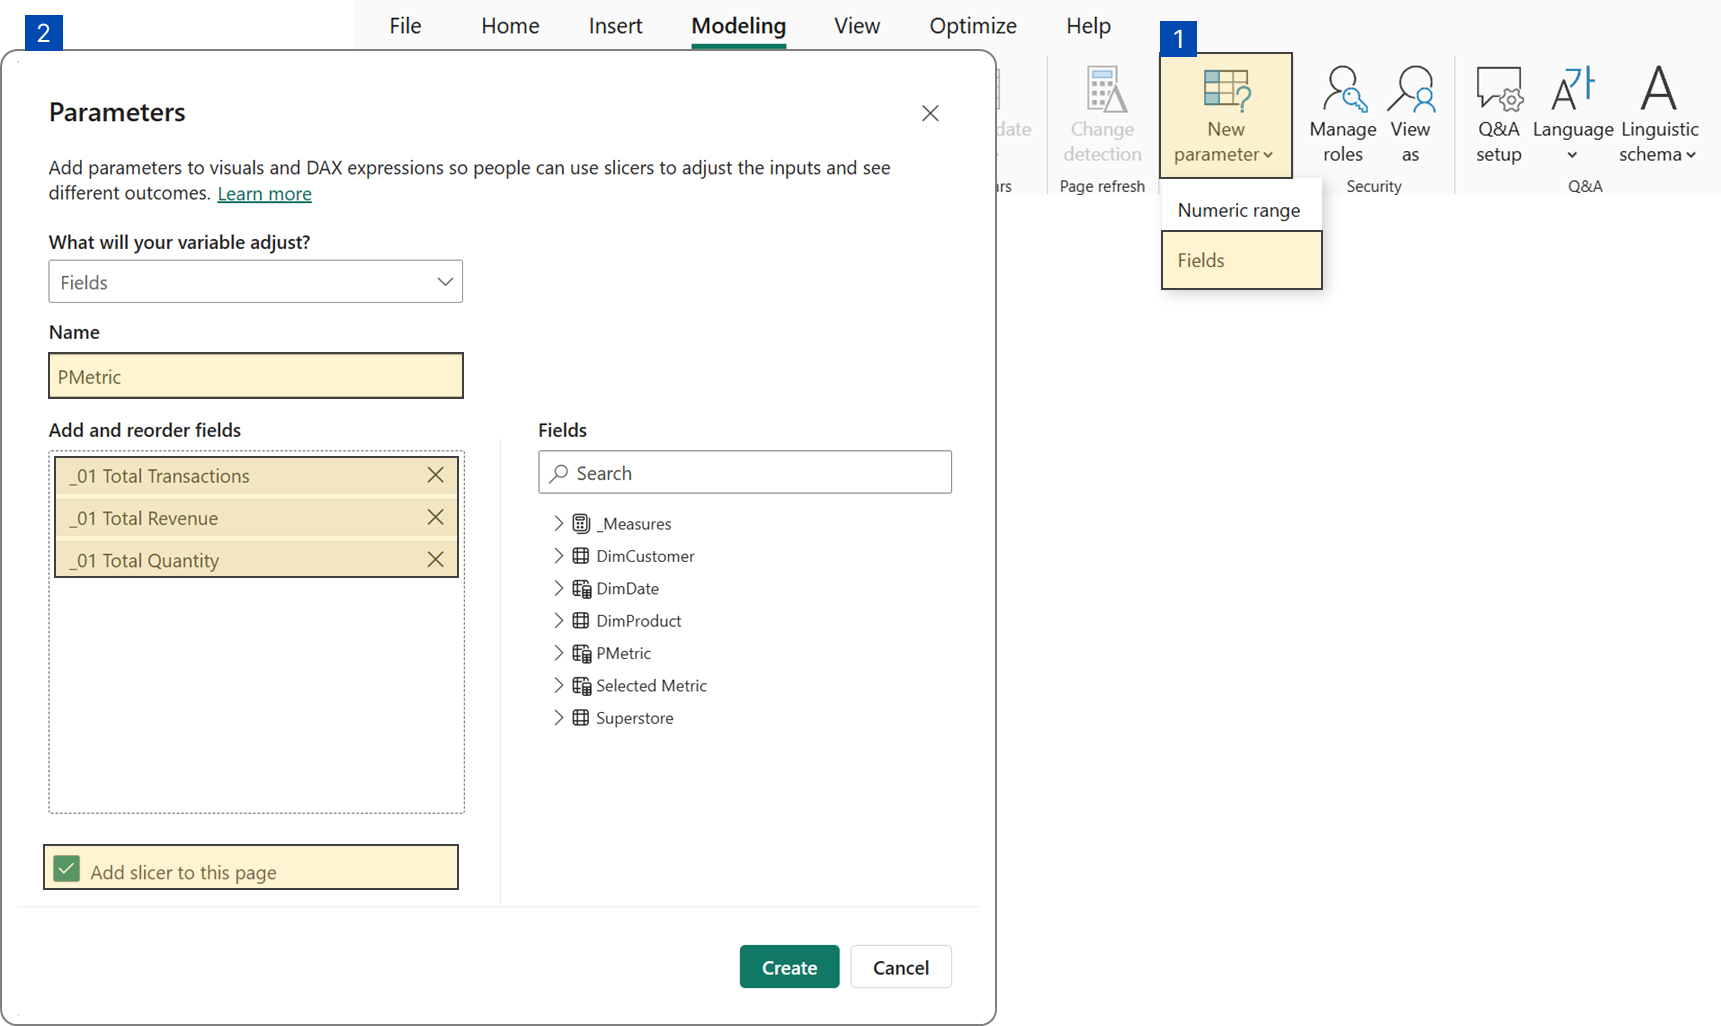 Create a field parameter for metric selection
Create a bar chart and replace the selected year's metric value on the X-axis with the 'PMetric' parameter.
Now, to dynamically display the previous year's value and error bars for your selected metric using a field parameter, you have two approaches. For the first option, you'll simply create a reference measure—this is your dynamic selected metric, which adjusts based on the metric order from the parameter.
Measure #14: Dynamic Title (via Field Parameter)
_01 Dynamic Selected Metric (via Field Parameter) =
VAR SelectedVariableOrder = SELECTEDVALUE('PMetric'[PMetric Order])
RETURN
  SWITCH(
      SelectedVariableOrder,
      0, [_01 Total Transactions],
      1, [_01 Total Revenue],
      2, [_01 Total Quantity],
      BLANK()
  )
The DAX measures for calculating the previous year's value and the positive and negative variances (for error bars) will follow the same logic as those used with the disconnected table approach. However, we first need to establish the dynamic selected metric. This is similar to the disconnected table method, but the reference will now be based on the selected metric order from the field parameter.
Measure #14 will serve as the reference for both the previous year's value and the error bars.
Measure #15: Dynamic Selected Metric for Previous Year (via Field Parameter)
_02 PY Dynamic Selected Metric (via Field Parameter) =
IF(
  HASONEVALUE(DimDate[Year]),
  CALCULATE(
      [_01 Dynamic Selected Metric (via Field Parameter)],
      SAMEPERIODLASTYEAR(DimDate[Date])
  ),
  BLANK()
)
Measure #16: Error Bars for Positive △PY Dynamic Selected Metric (via Field Parameter)
_03 Positive Error Bars_△PY Dynamic Selected Metric (via Field Parameter) =
VAR _CurrentYear = [_01 Dynamic Selected Metric (via Field Parameter)]
VAR _PreviousYear = [_02 PY Dynamic Selected Metric (via Field Parameter)]
VAR _HasSurplus = _CurrentYear > _PreviousYear
RETURN
  IF(
      NOT ISBLANK(_PreviousYear) && _HasSurplus,
      _CurrentYear,
      BLANK()
  )
Measure #17: Error Bars for Negative △PY Dynamic Selected Metric (via Field Parameter)
_03 Negative Error Bars_△PY Dynamic Selected Metric (via Field Parameter) =
VAR _CurrentYear = [_01 Dynamic Selected Metric (via Field Parameter)]
VAR _PreviousYear = [_02 PY Dynamic Selected Metric (via Field Parameter)]
VAR _HasDeficit = _PreviousYear > _CurrentYear
RETURN
  IF(
      NOT ISBLANK(_CurrentYear) && _HasDeficit,
      _PreviousYear,
      BLANK()
  )
To further enhance clarity, apply conditional formatting to the chart title so it dynamically reflects the currently selected metric.
Measure #18: Dynamic Title (via Field Parameter)
_04 Dynamic Title (via Field Parameter) =
VAR _SelectedMetricOrder = SELECTEDVALUE('PMetric'[PMetric Order])
RETURN
SWITCH(
_SelectedMetricOrder,
-- Transaction Metrics
0, "Total Transactions by Sub-Category",
-- Revenue Metrics
1, "Total Revenue by Sub-Category",
-- Quantity Metrics
2, "Total Quantity by Sub-Category",
-- Default when no selection
"No Selection"
)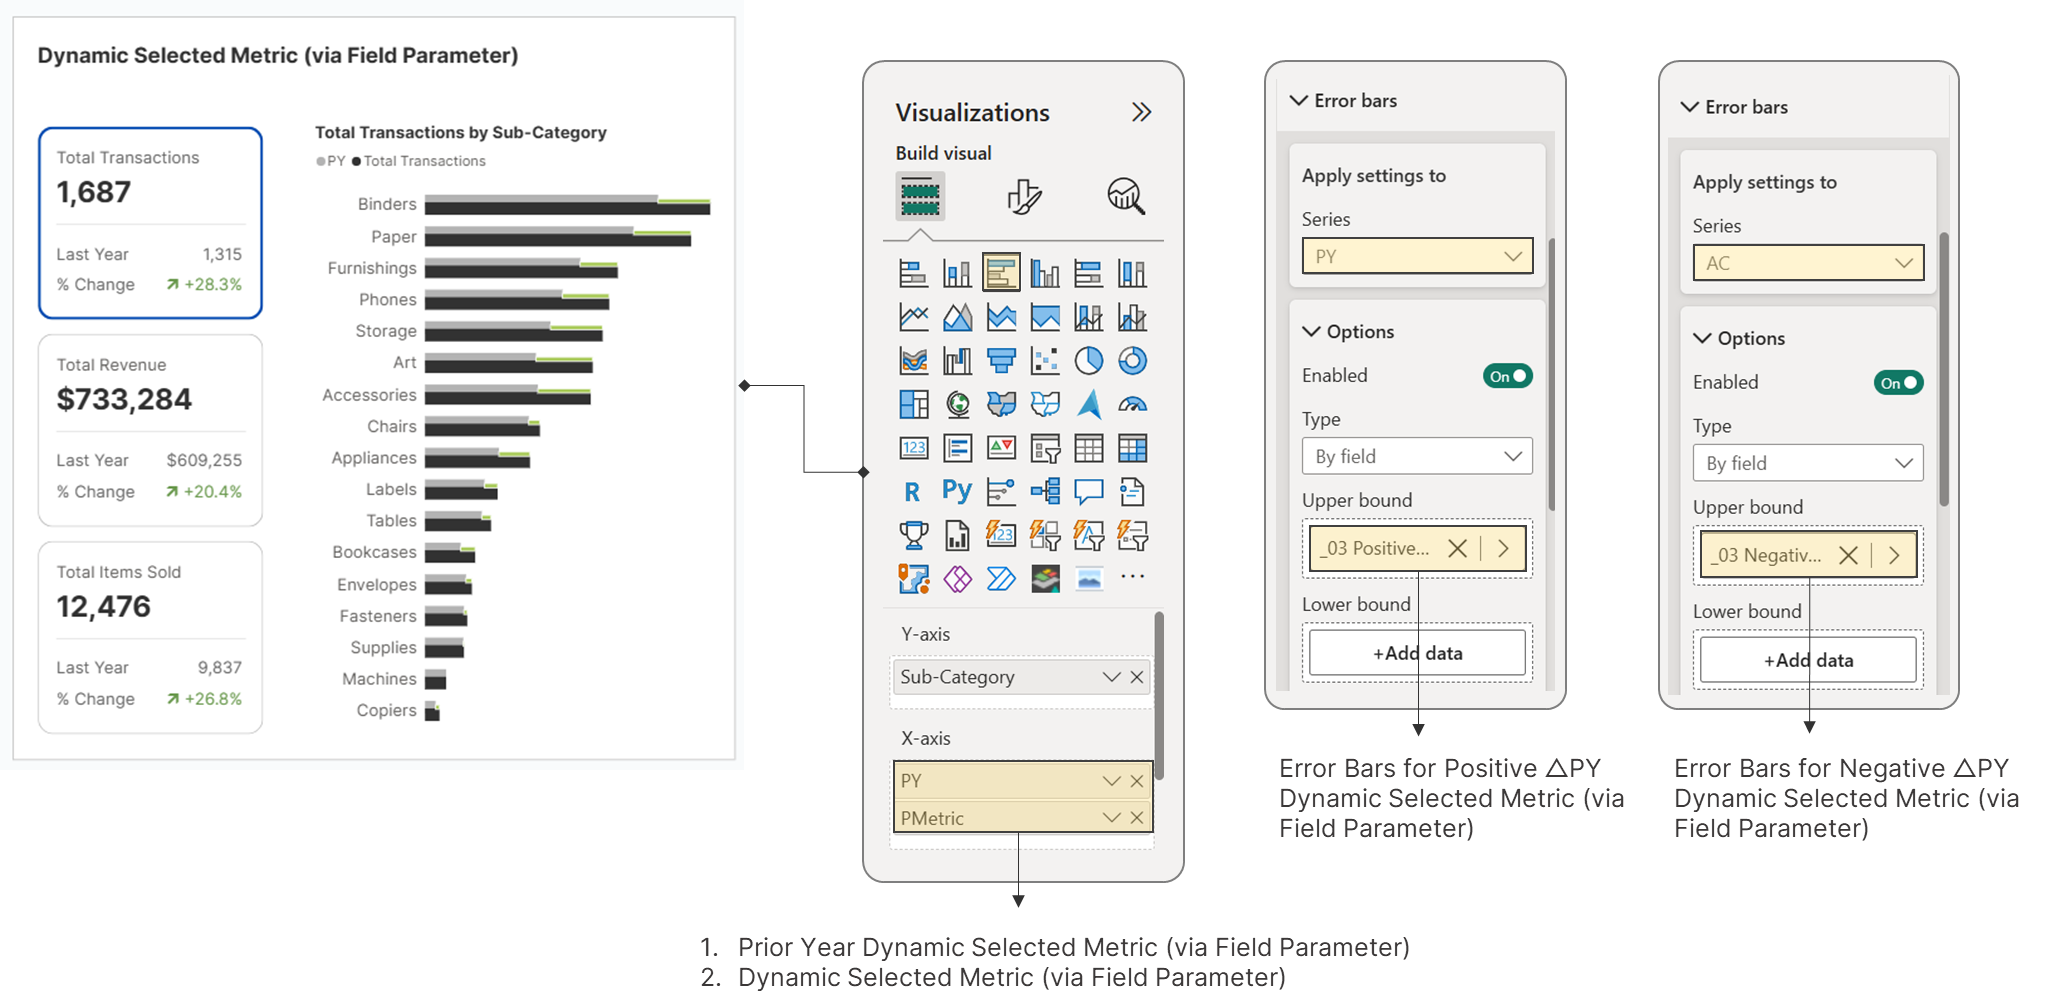 Replace your current 'static' metrics with the new dynamic ones.
A key advantage of field parameters is that they provide the flexibility to apply distinct configurations to each metric.
Alternatively, these DAX measures calculate the prior year's dynamic selected metric and generate error bars based on your selected metric card (via a field parameter).
Measure #19: Dynamic Selected Metric for Previous Year (via Field Parameter)
_02 PY Dynamic Selected Metric (via Field Parameter) =
VAR _SelectedMetricOrder = SELECTEDVALUE('PMetric'[PMetric Order])
RETURN
  SWITCH(
      _SelectedMetricOrder,
      0, [_01 PY Total Transactions],
      1, [_01 PY Total Revenue],
      2, [_01 PY Total Quantity],
      BLANK()
  )
Measure #20: Error Bars for Positive △PY Dynamic Selected Metric (via Field Parameter)
_03 Positive Error Bars_△PY Dynamic Selected Metric (via Field Parameter) =
VAR _SelectedMetricOrder = SELECTEDVALUE('PMetric'[PMetric Order])
RETURN
  SWITCH(
      _SelectedMetricOrder,
      0, [_03 Positive Error Bars_△PY Total Transactions],
      1, [_03 Positive Error Bars_△PY Total Revenue],
      2, [_03 Positive Error Bars_△PY Total Quantity],
      BLANK()
  )
Measure #21: Error Bars for Negative △PY Dynamic Selected Metric (via Field Parameter)
_03 Negative Error Bars_△PY Dynamic Selected Metric (via Field Parameter) =
VAR _SelectedMetricOrder = SELECTEDVALUE('PMetric'[PMetric Order])
RETURN
  SWITCH(
      _SelectedMetricOrder,
      0, [_03 Negative Error Bars_△PY Total Transactions],
      1, [_03 Negative Error Bars_△PY Total Revenue],
      2, [_03 Negative Error Bars_△PY Total Quantity],
      BLANK()
  )