BarMember-Only
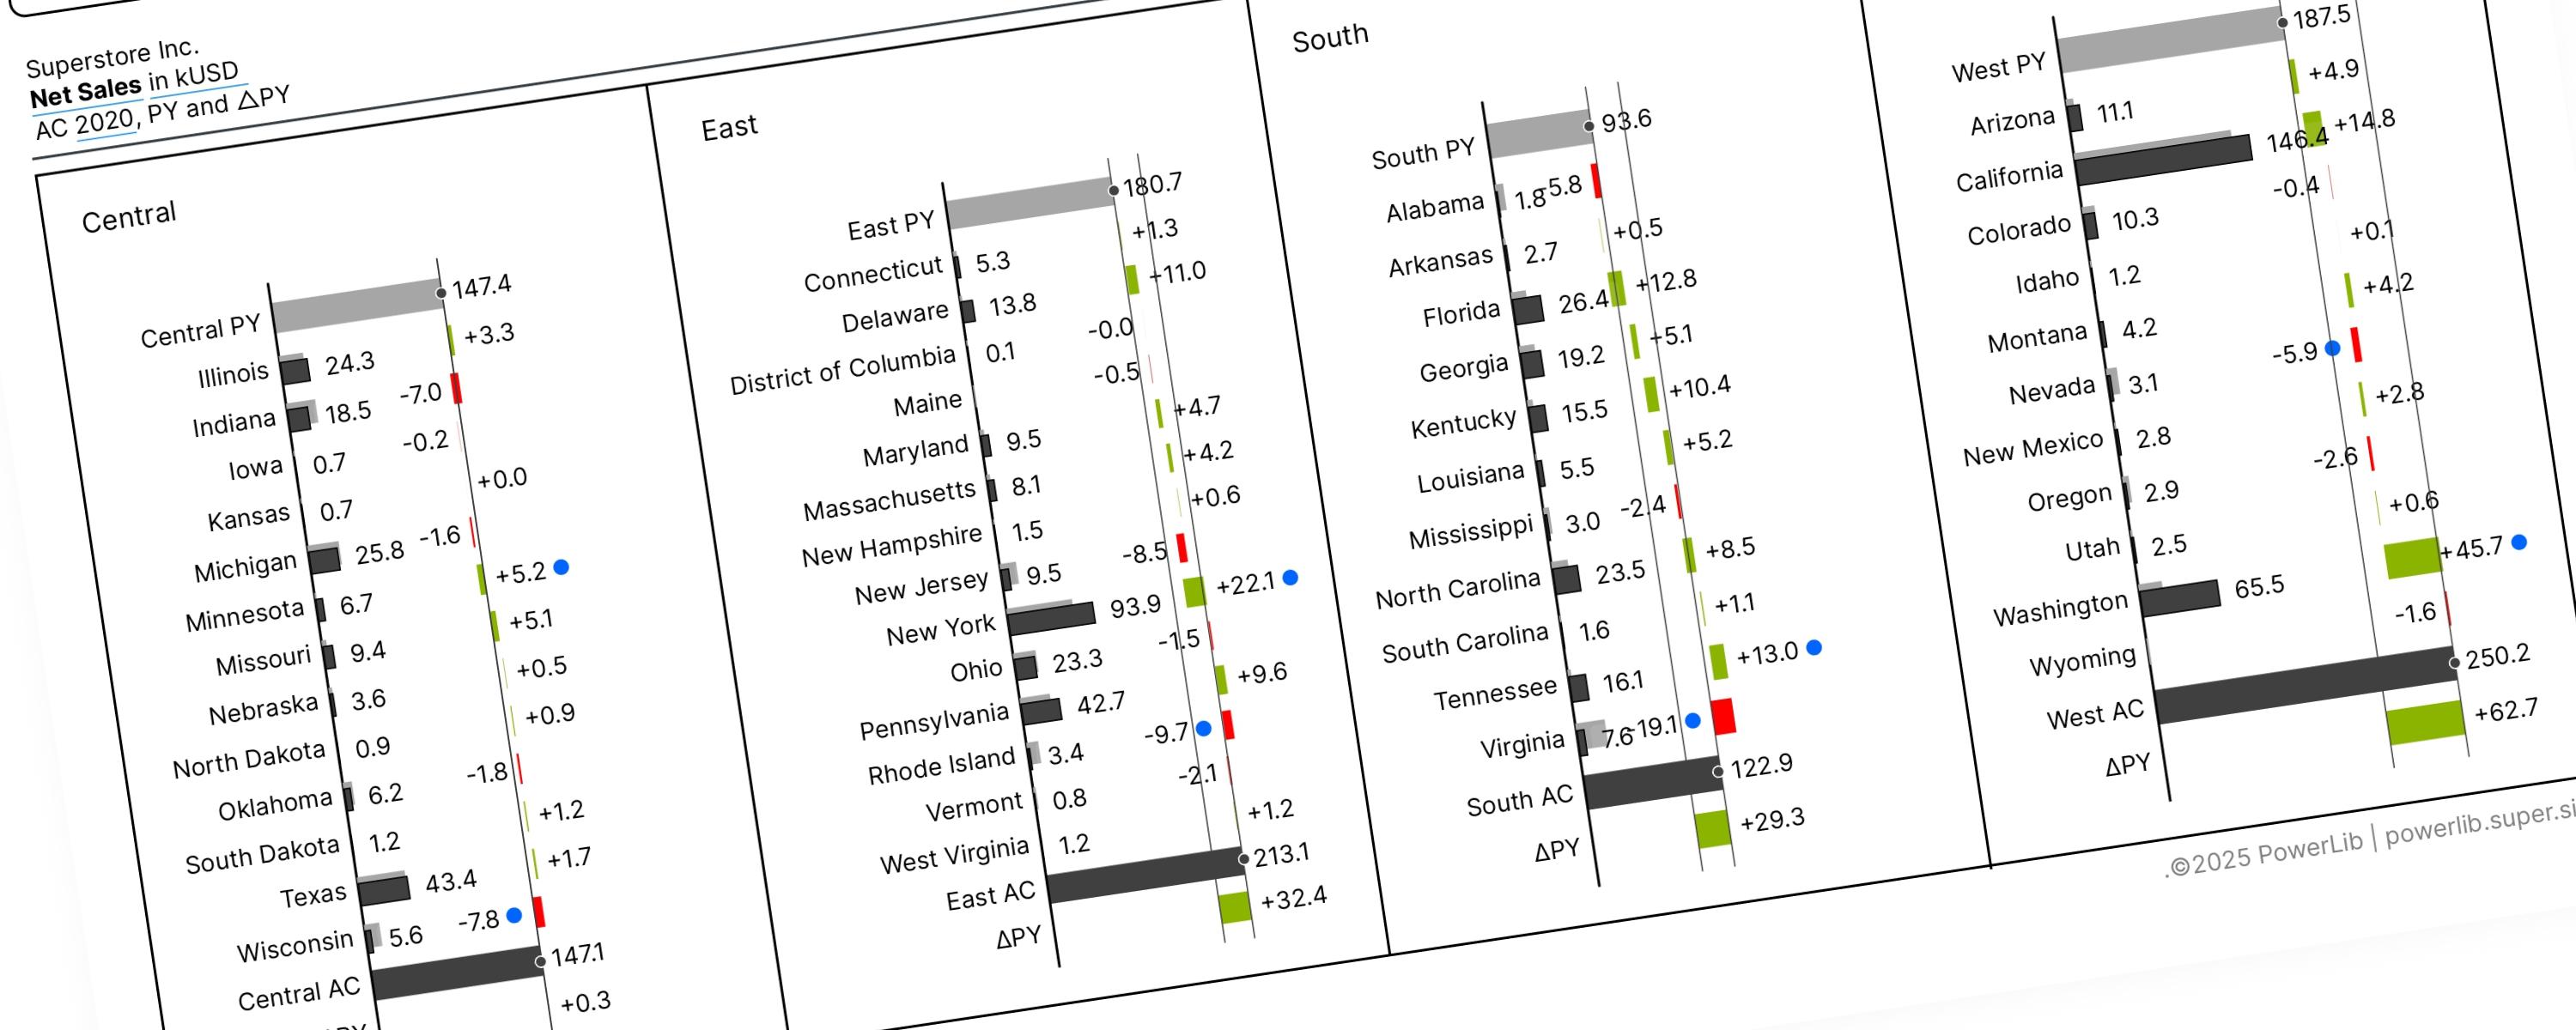
Bars with Vertical Waterfall Chart (Version 2)
A Vertical Waterfall Chart is a way to clearly show why two numbers are different by breaking down the changes that happened in between.
23 November 202568 min read
Documented Power BI techniques — the model change, the DAX, and the exact visual settings. Most are free to read; the rest come with the model files for members.
BarMember-Only
A Vertical Waterfall Chart is a way to clearly show why two numbers are different by breaking down the changes that happened in between.
BarFree
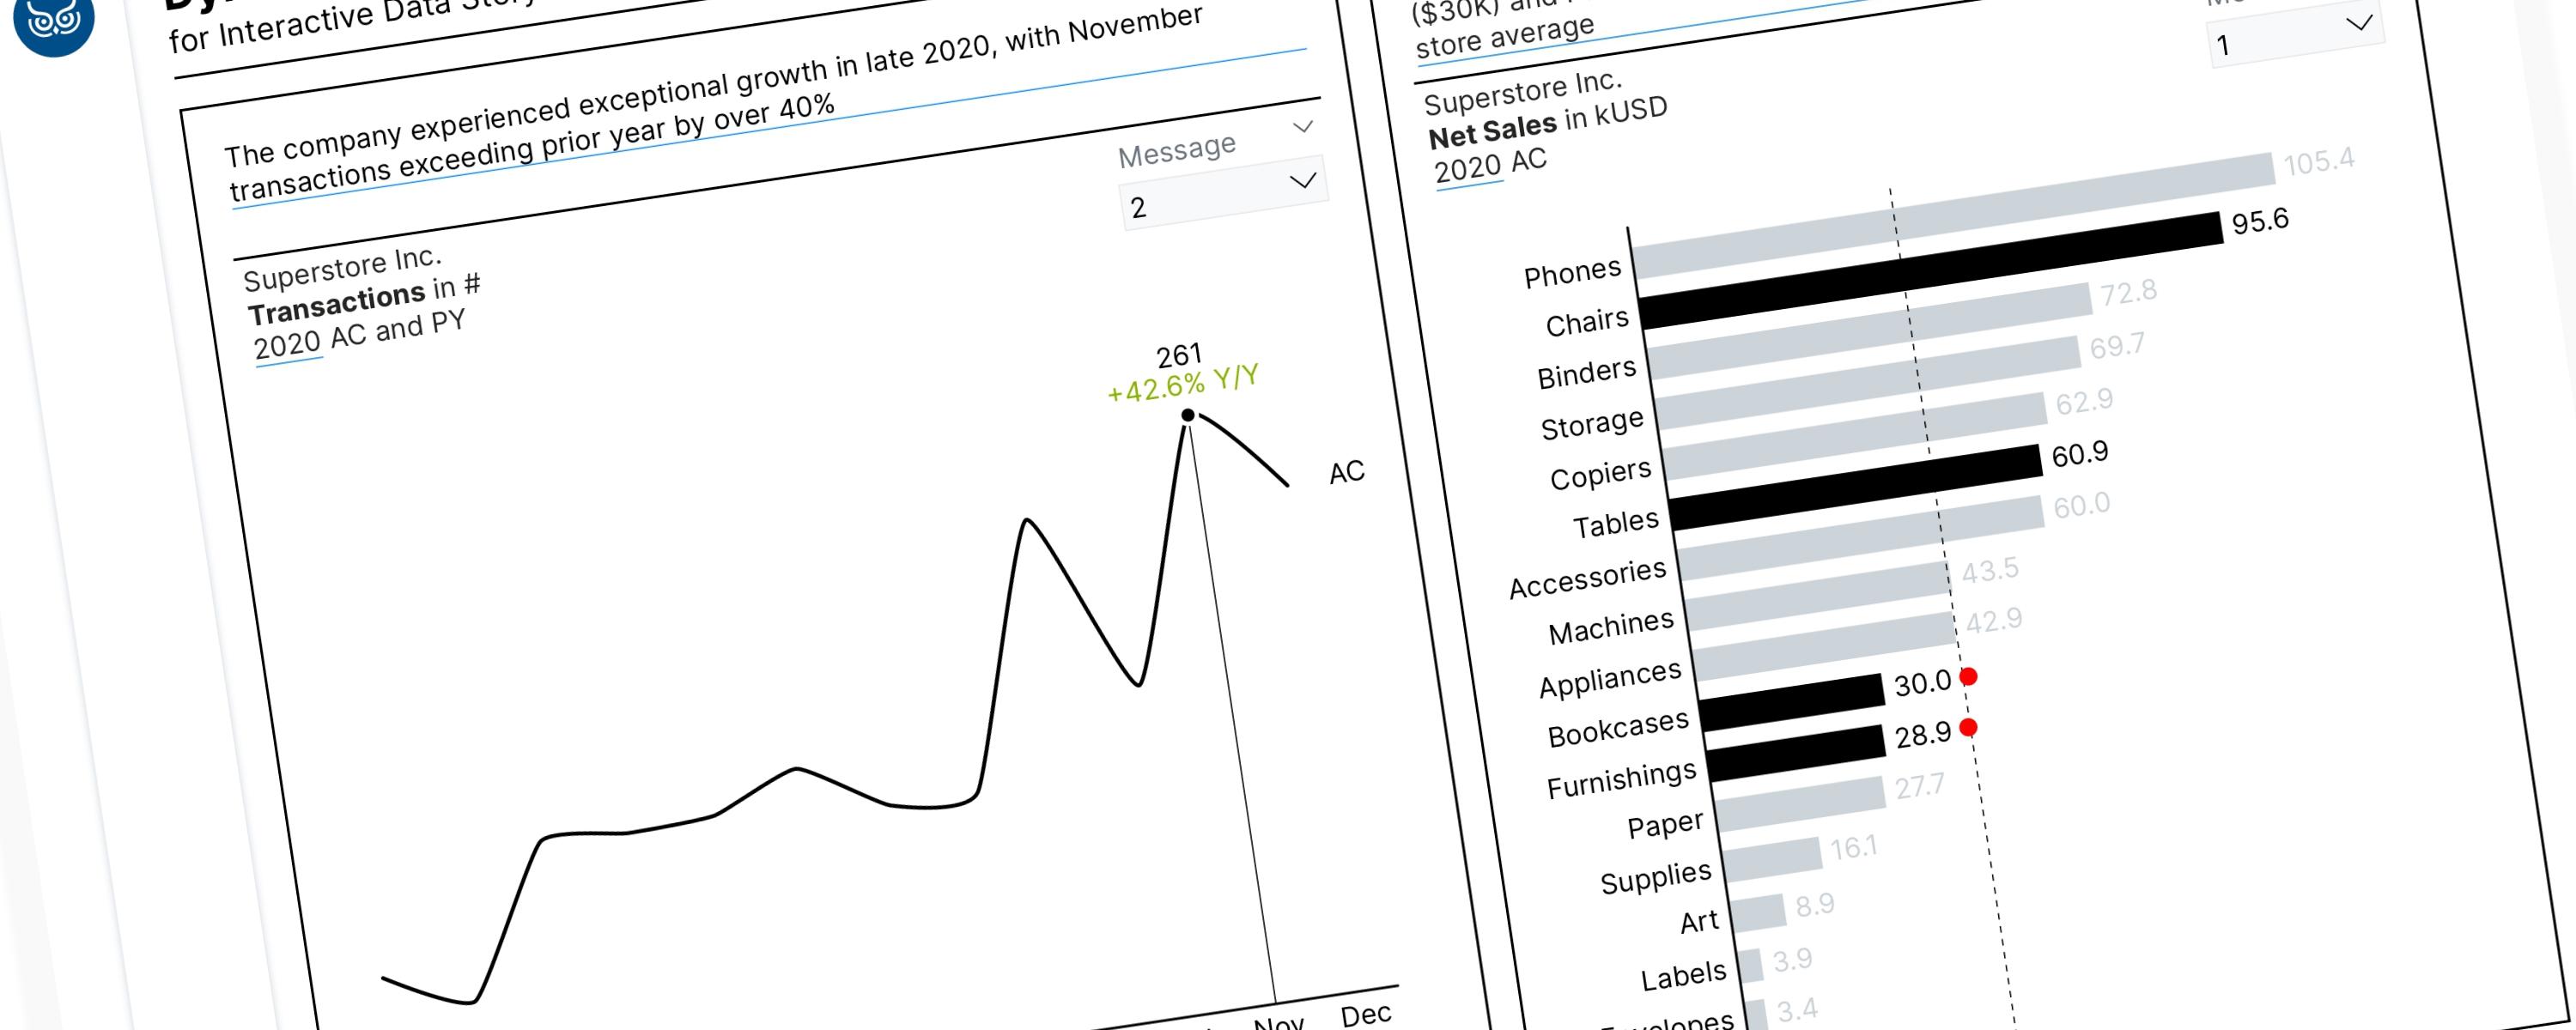
Field parameters are a powerful feature in Power BI. When combined with the SWITCH() function, these tools allow us to tell a compelling data story by dynamically highlighting…
BarFree
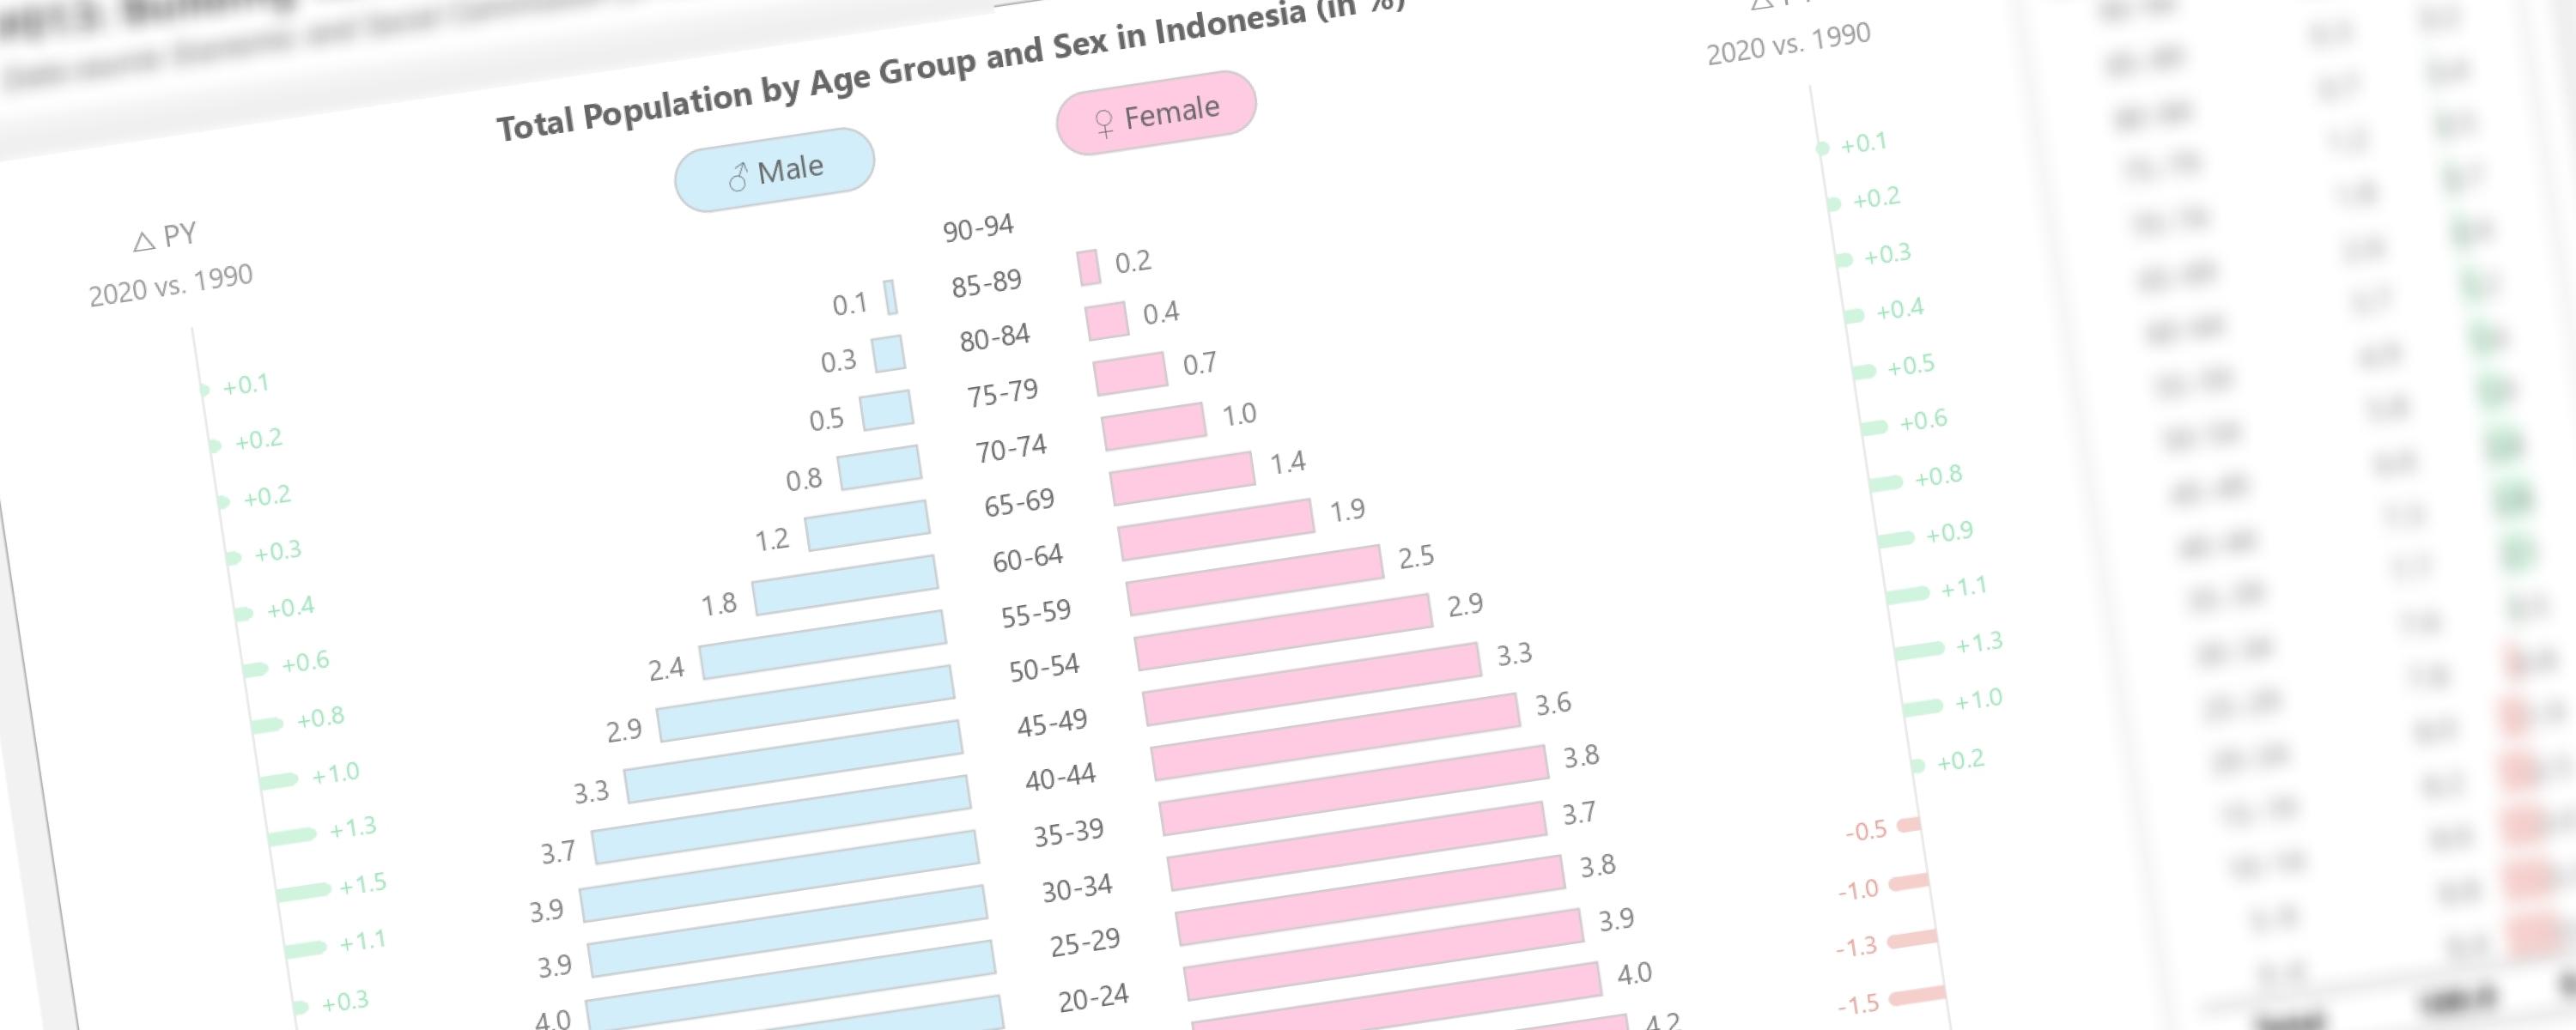
This documentation will guide you how to create tornado chart, also known as tornado diagram or butterfly chart, in Power BI using entirely native visuals.
BarFree
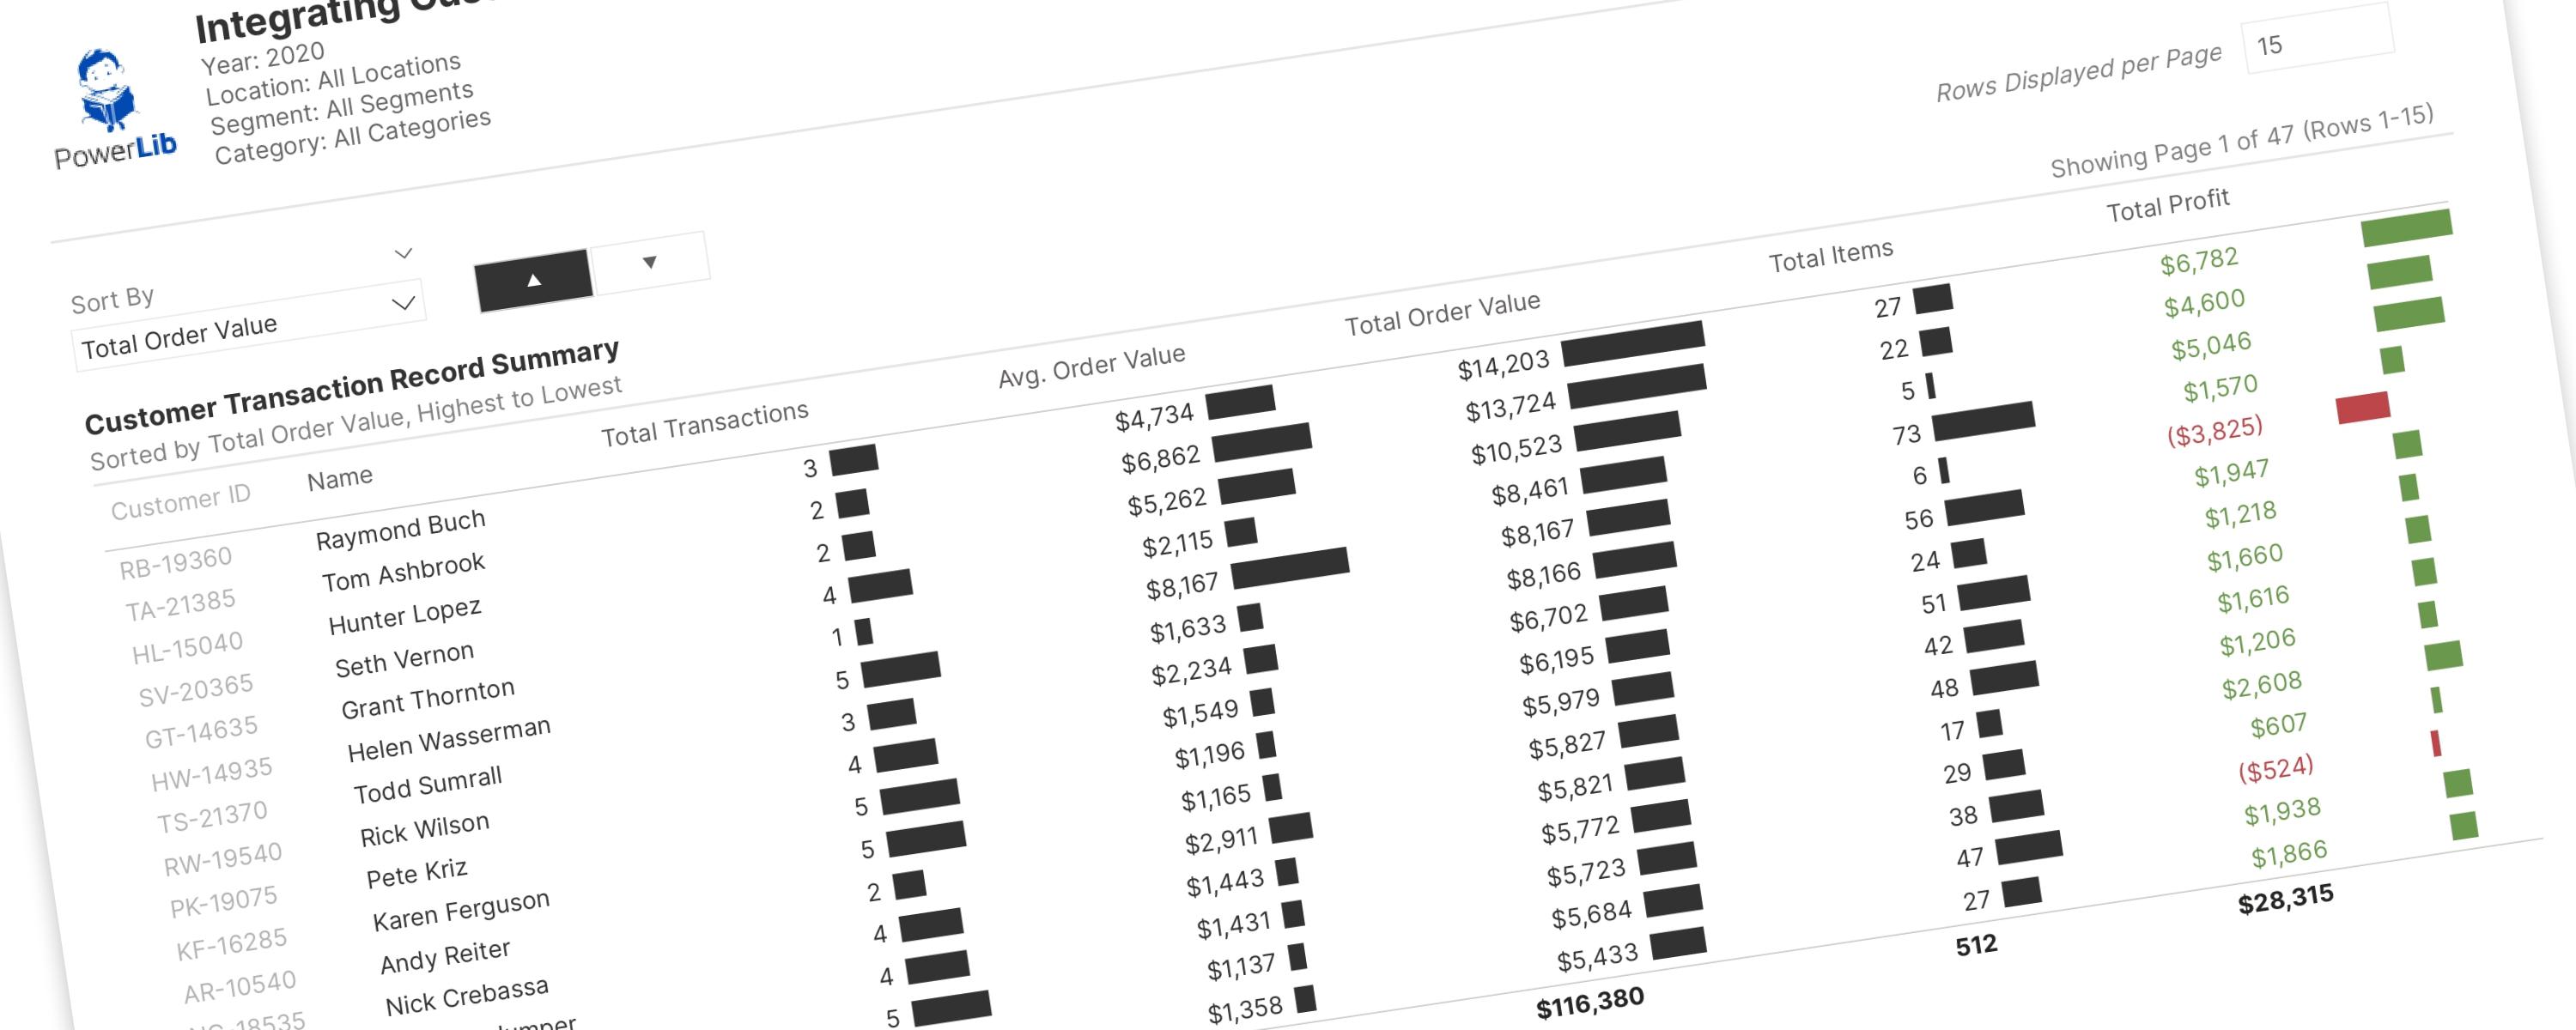
This documentation details advanced pagination techniques, extending my previous tutorial and documentation.
BarFree
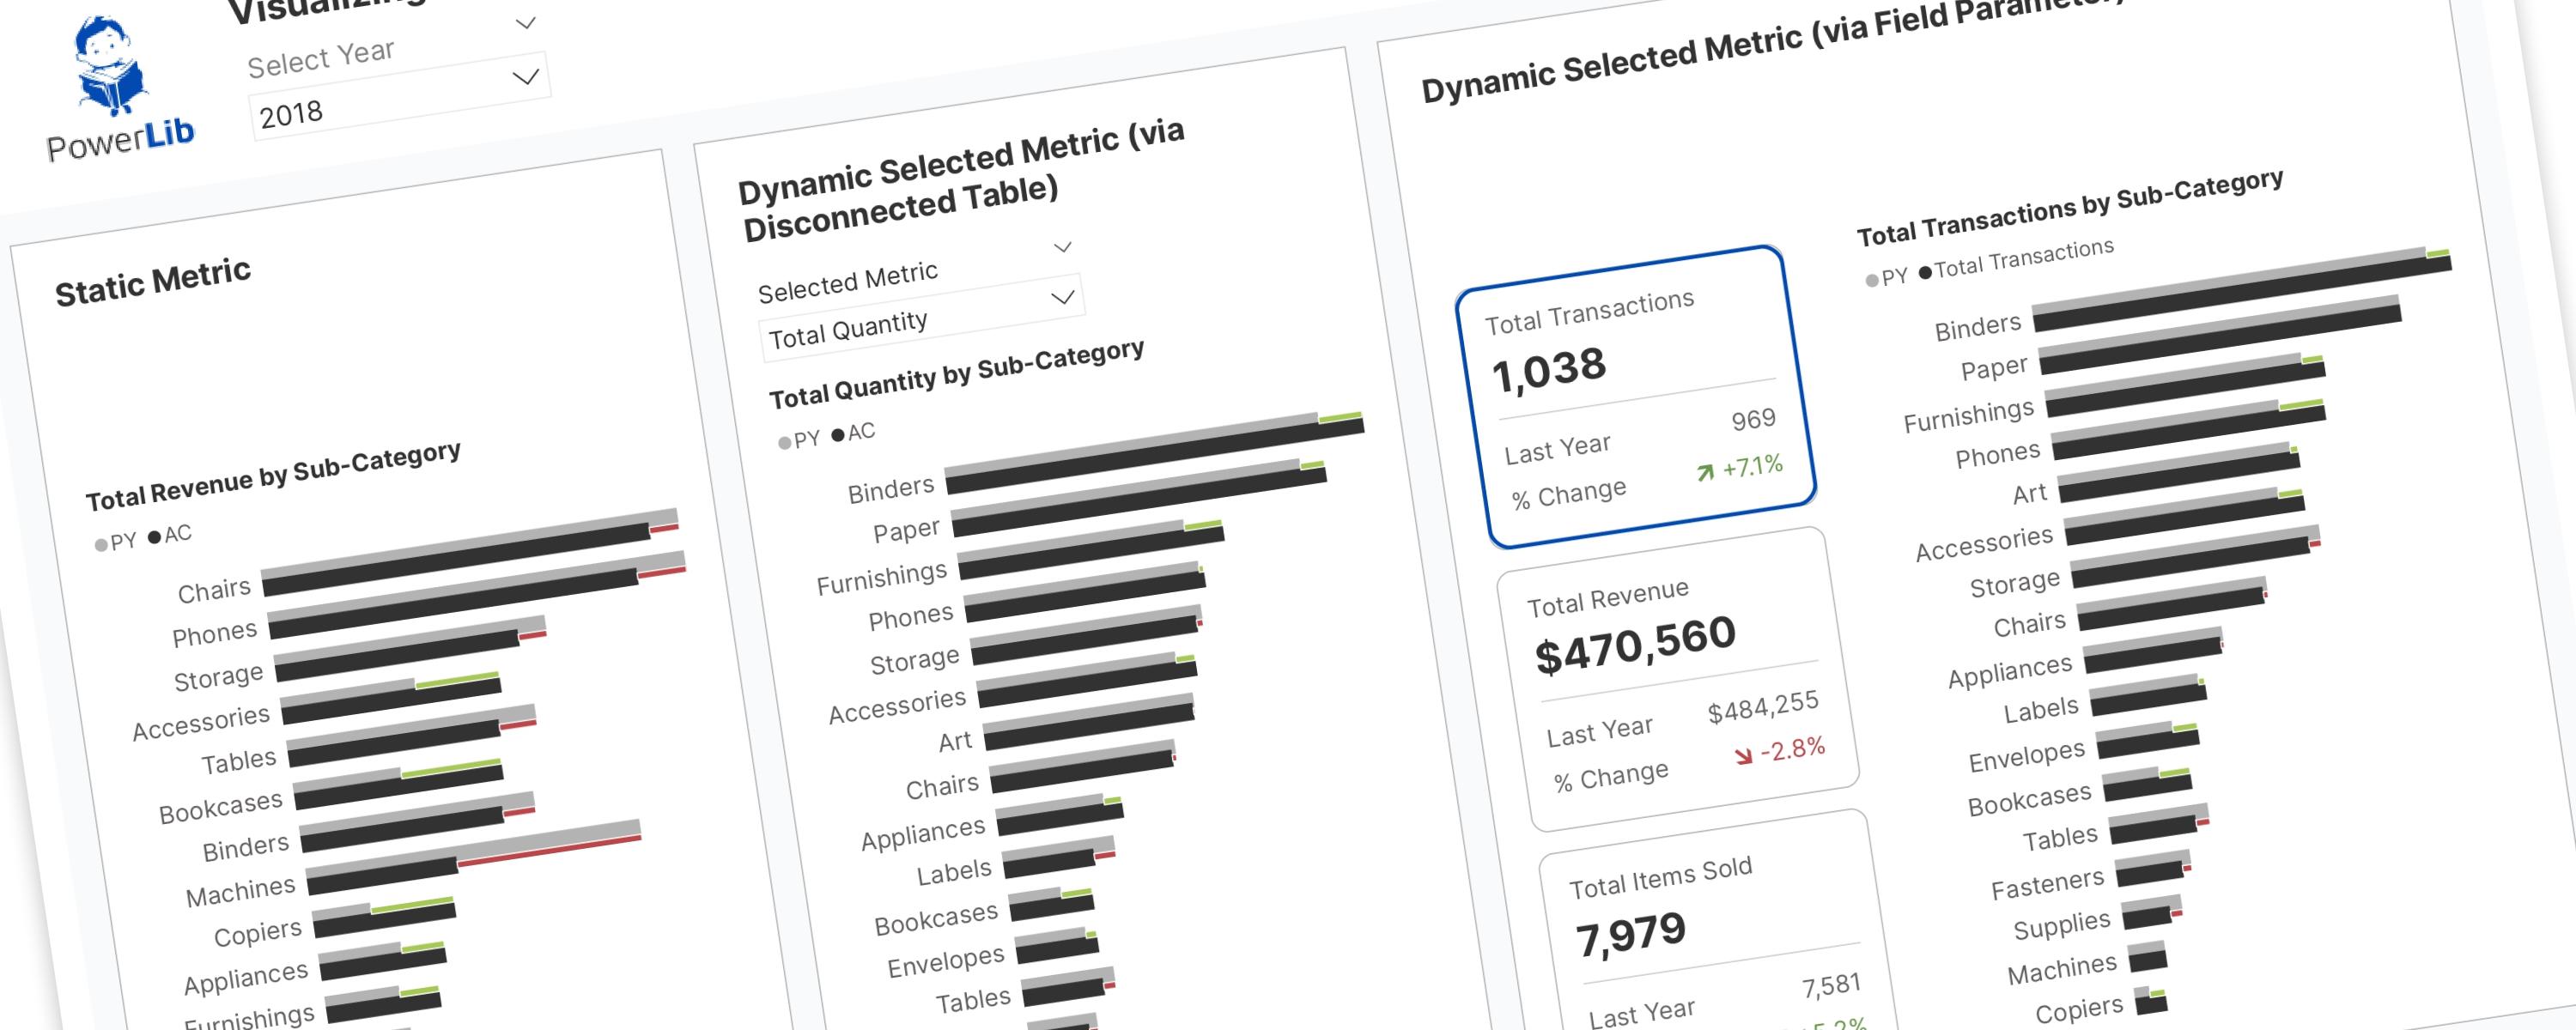
RETURN SWITCH( SelectedMetric, "Total Transactions", "Total Transactions by Sub-Category", "Total Revenue", "Total Revenue by Sub-Category", "Total Quantity", "Total Quantity by…
Scatter PlotMember-Only
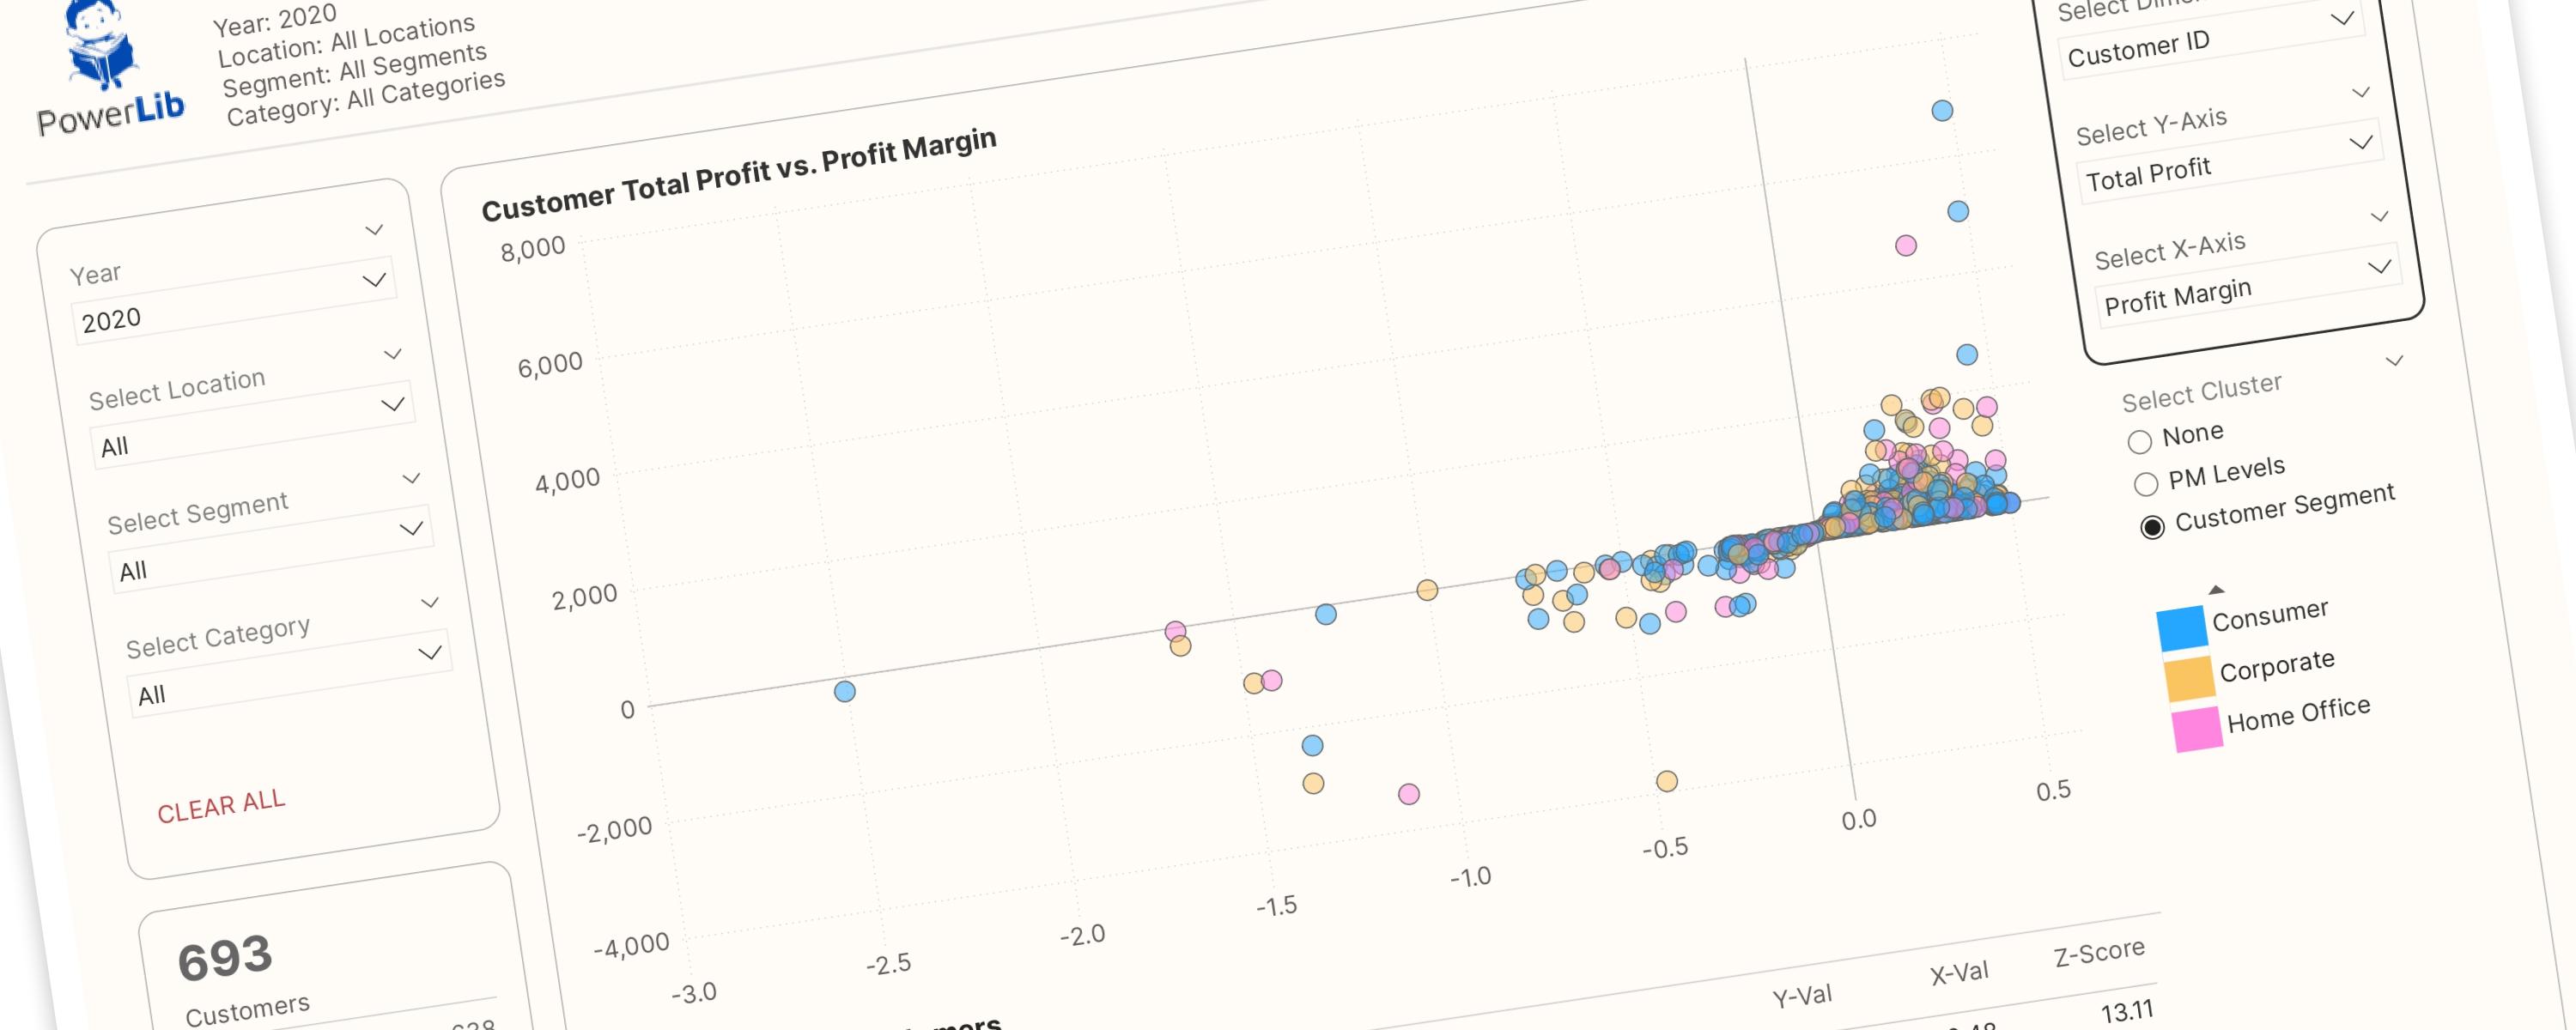
This interactive scatter plot is designed to empower users to interactively explore relationships between different dimensions and metrics. Key features include:
BarFree
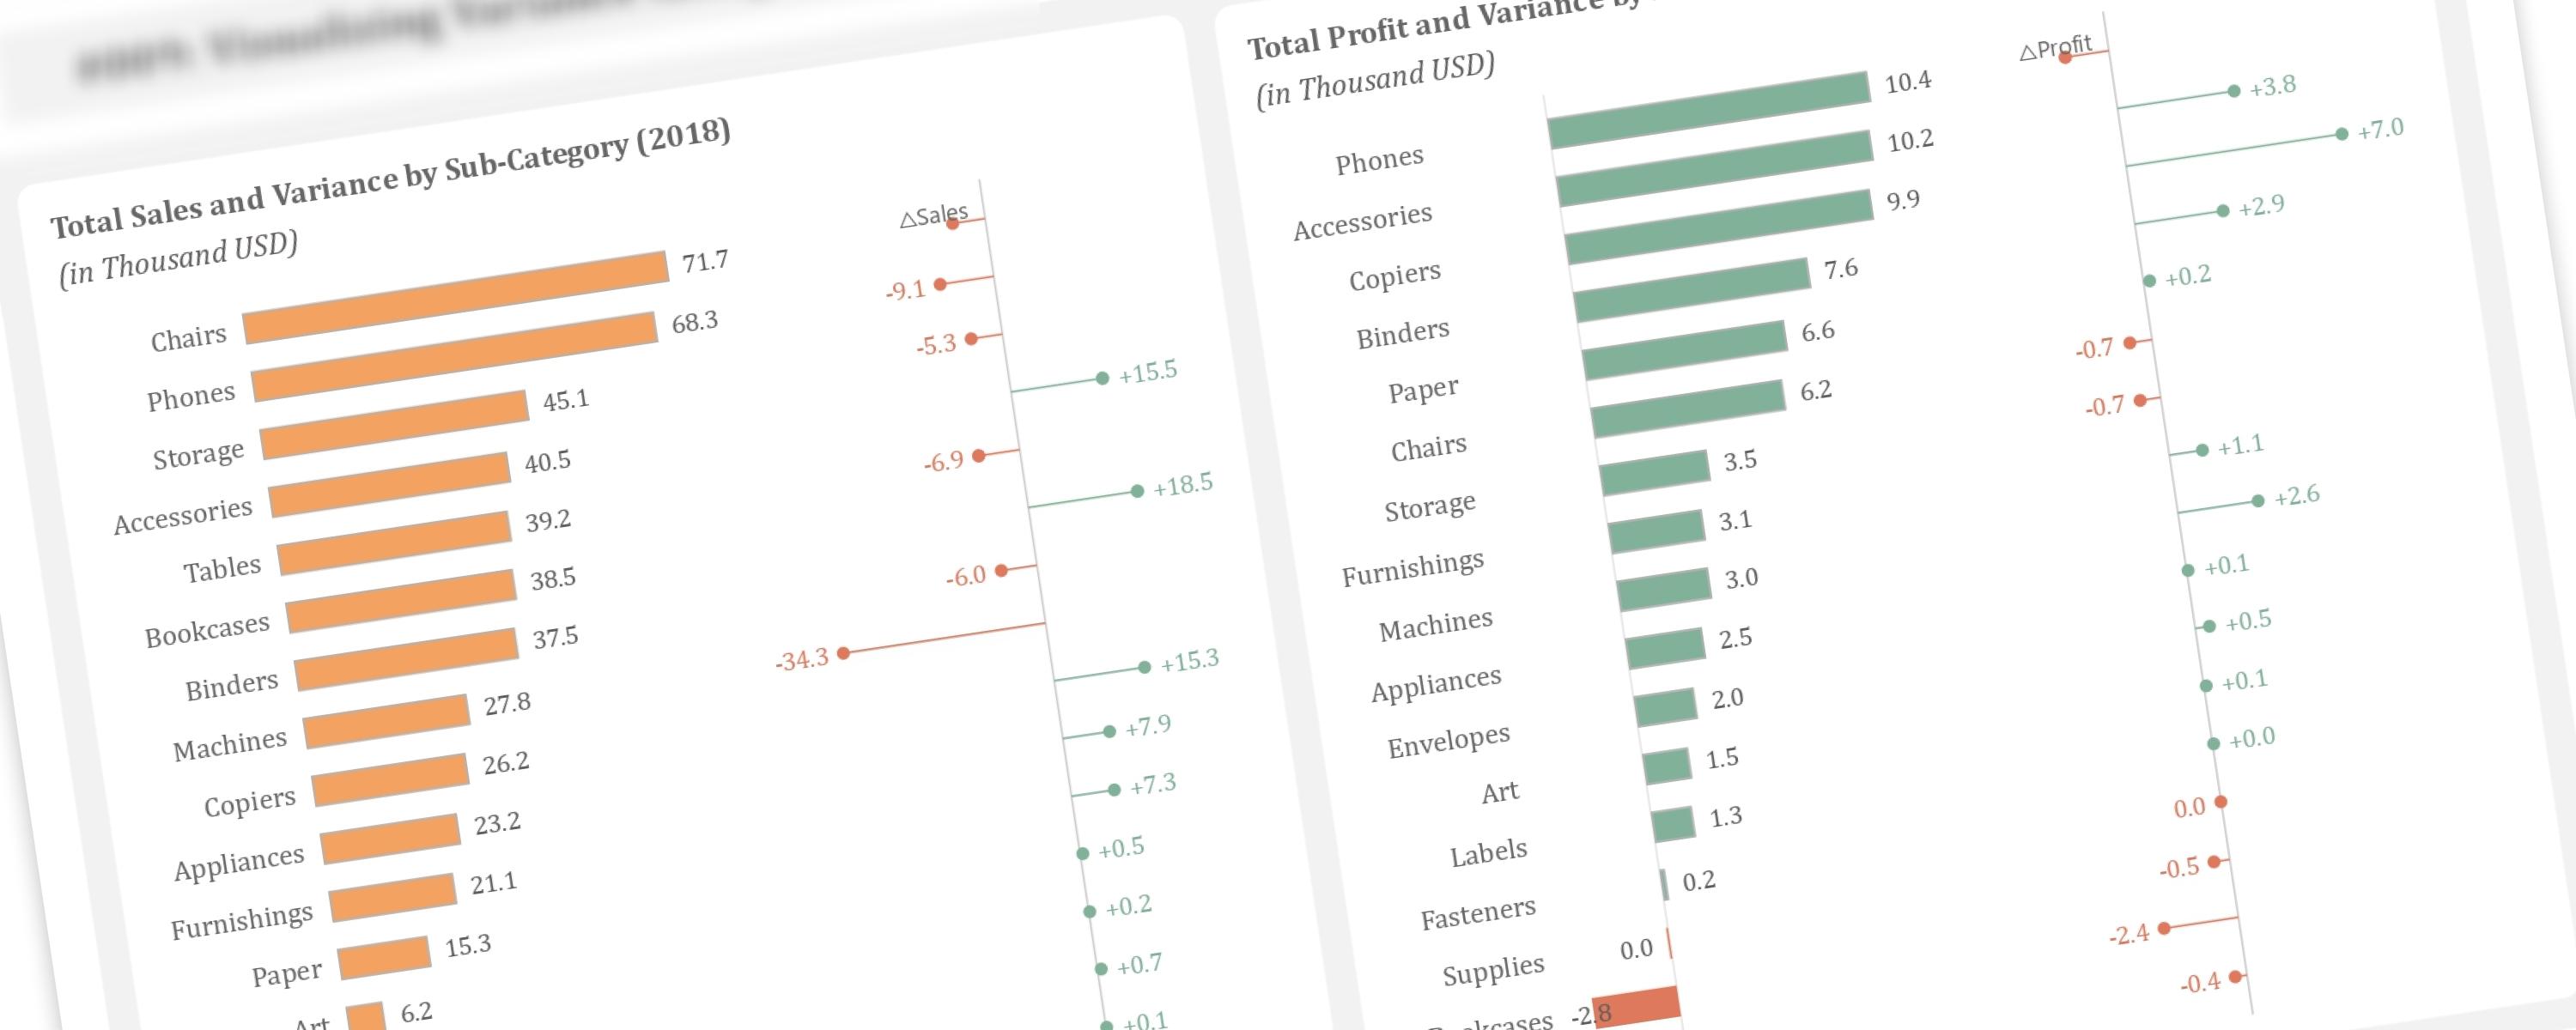
This article demonstrates how to create additional lollipop charts alongside bar charts to visualize year-over-year variance, a technique inspired by Bas Dohmen.
BarFree
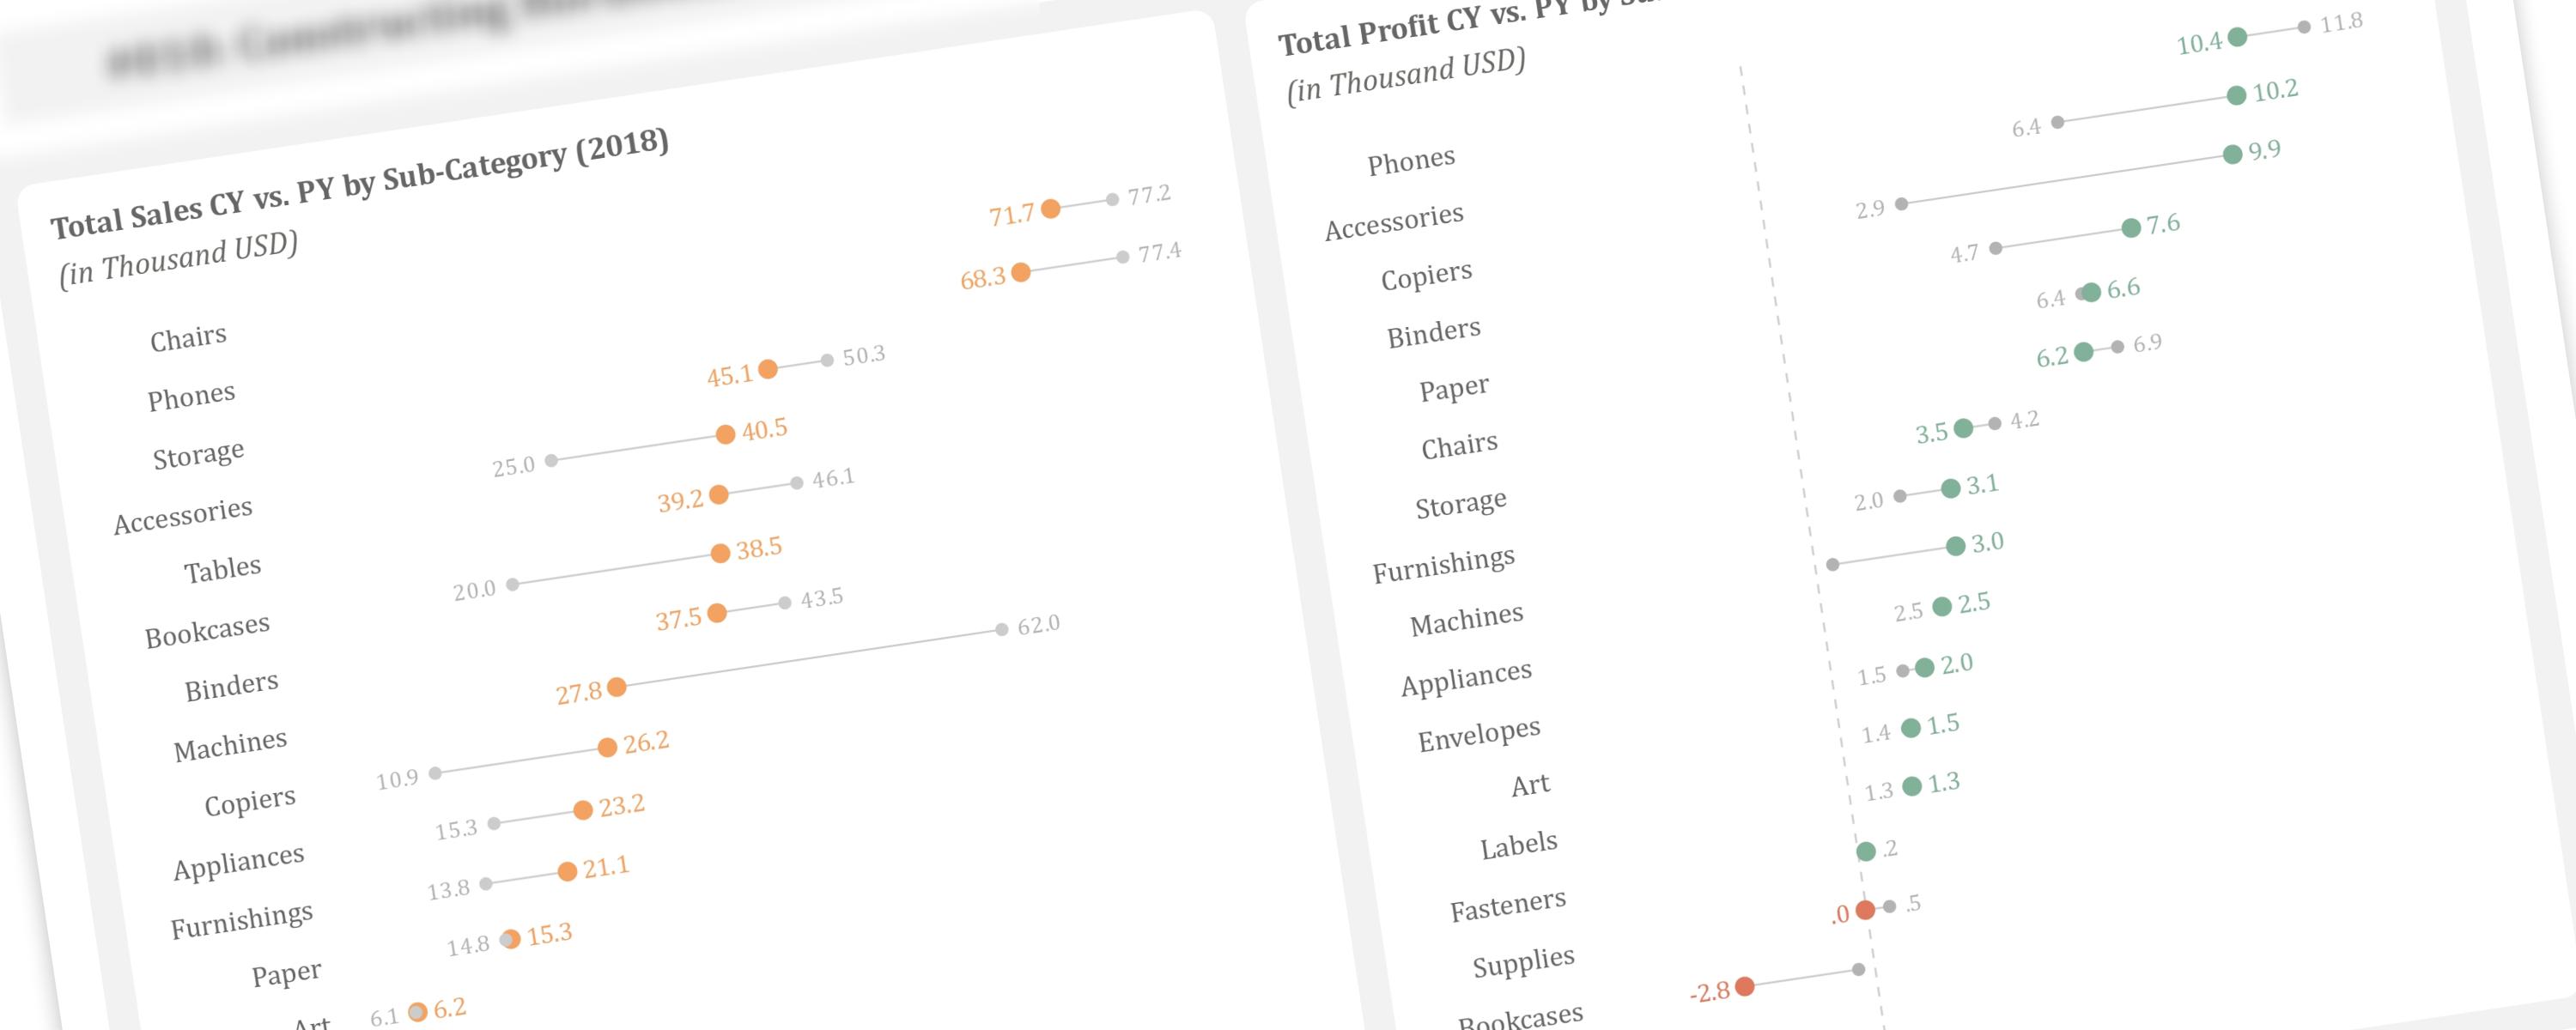
In the previous article, we discussed creating vertical dumbbell plots using line markers and error bars.
BarFree
Creating complex visualizations in Power BI can be challenging when working with native visuals.