Foreword
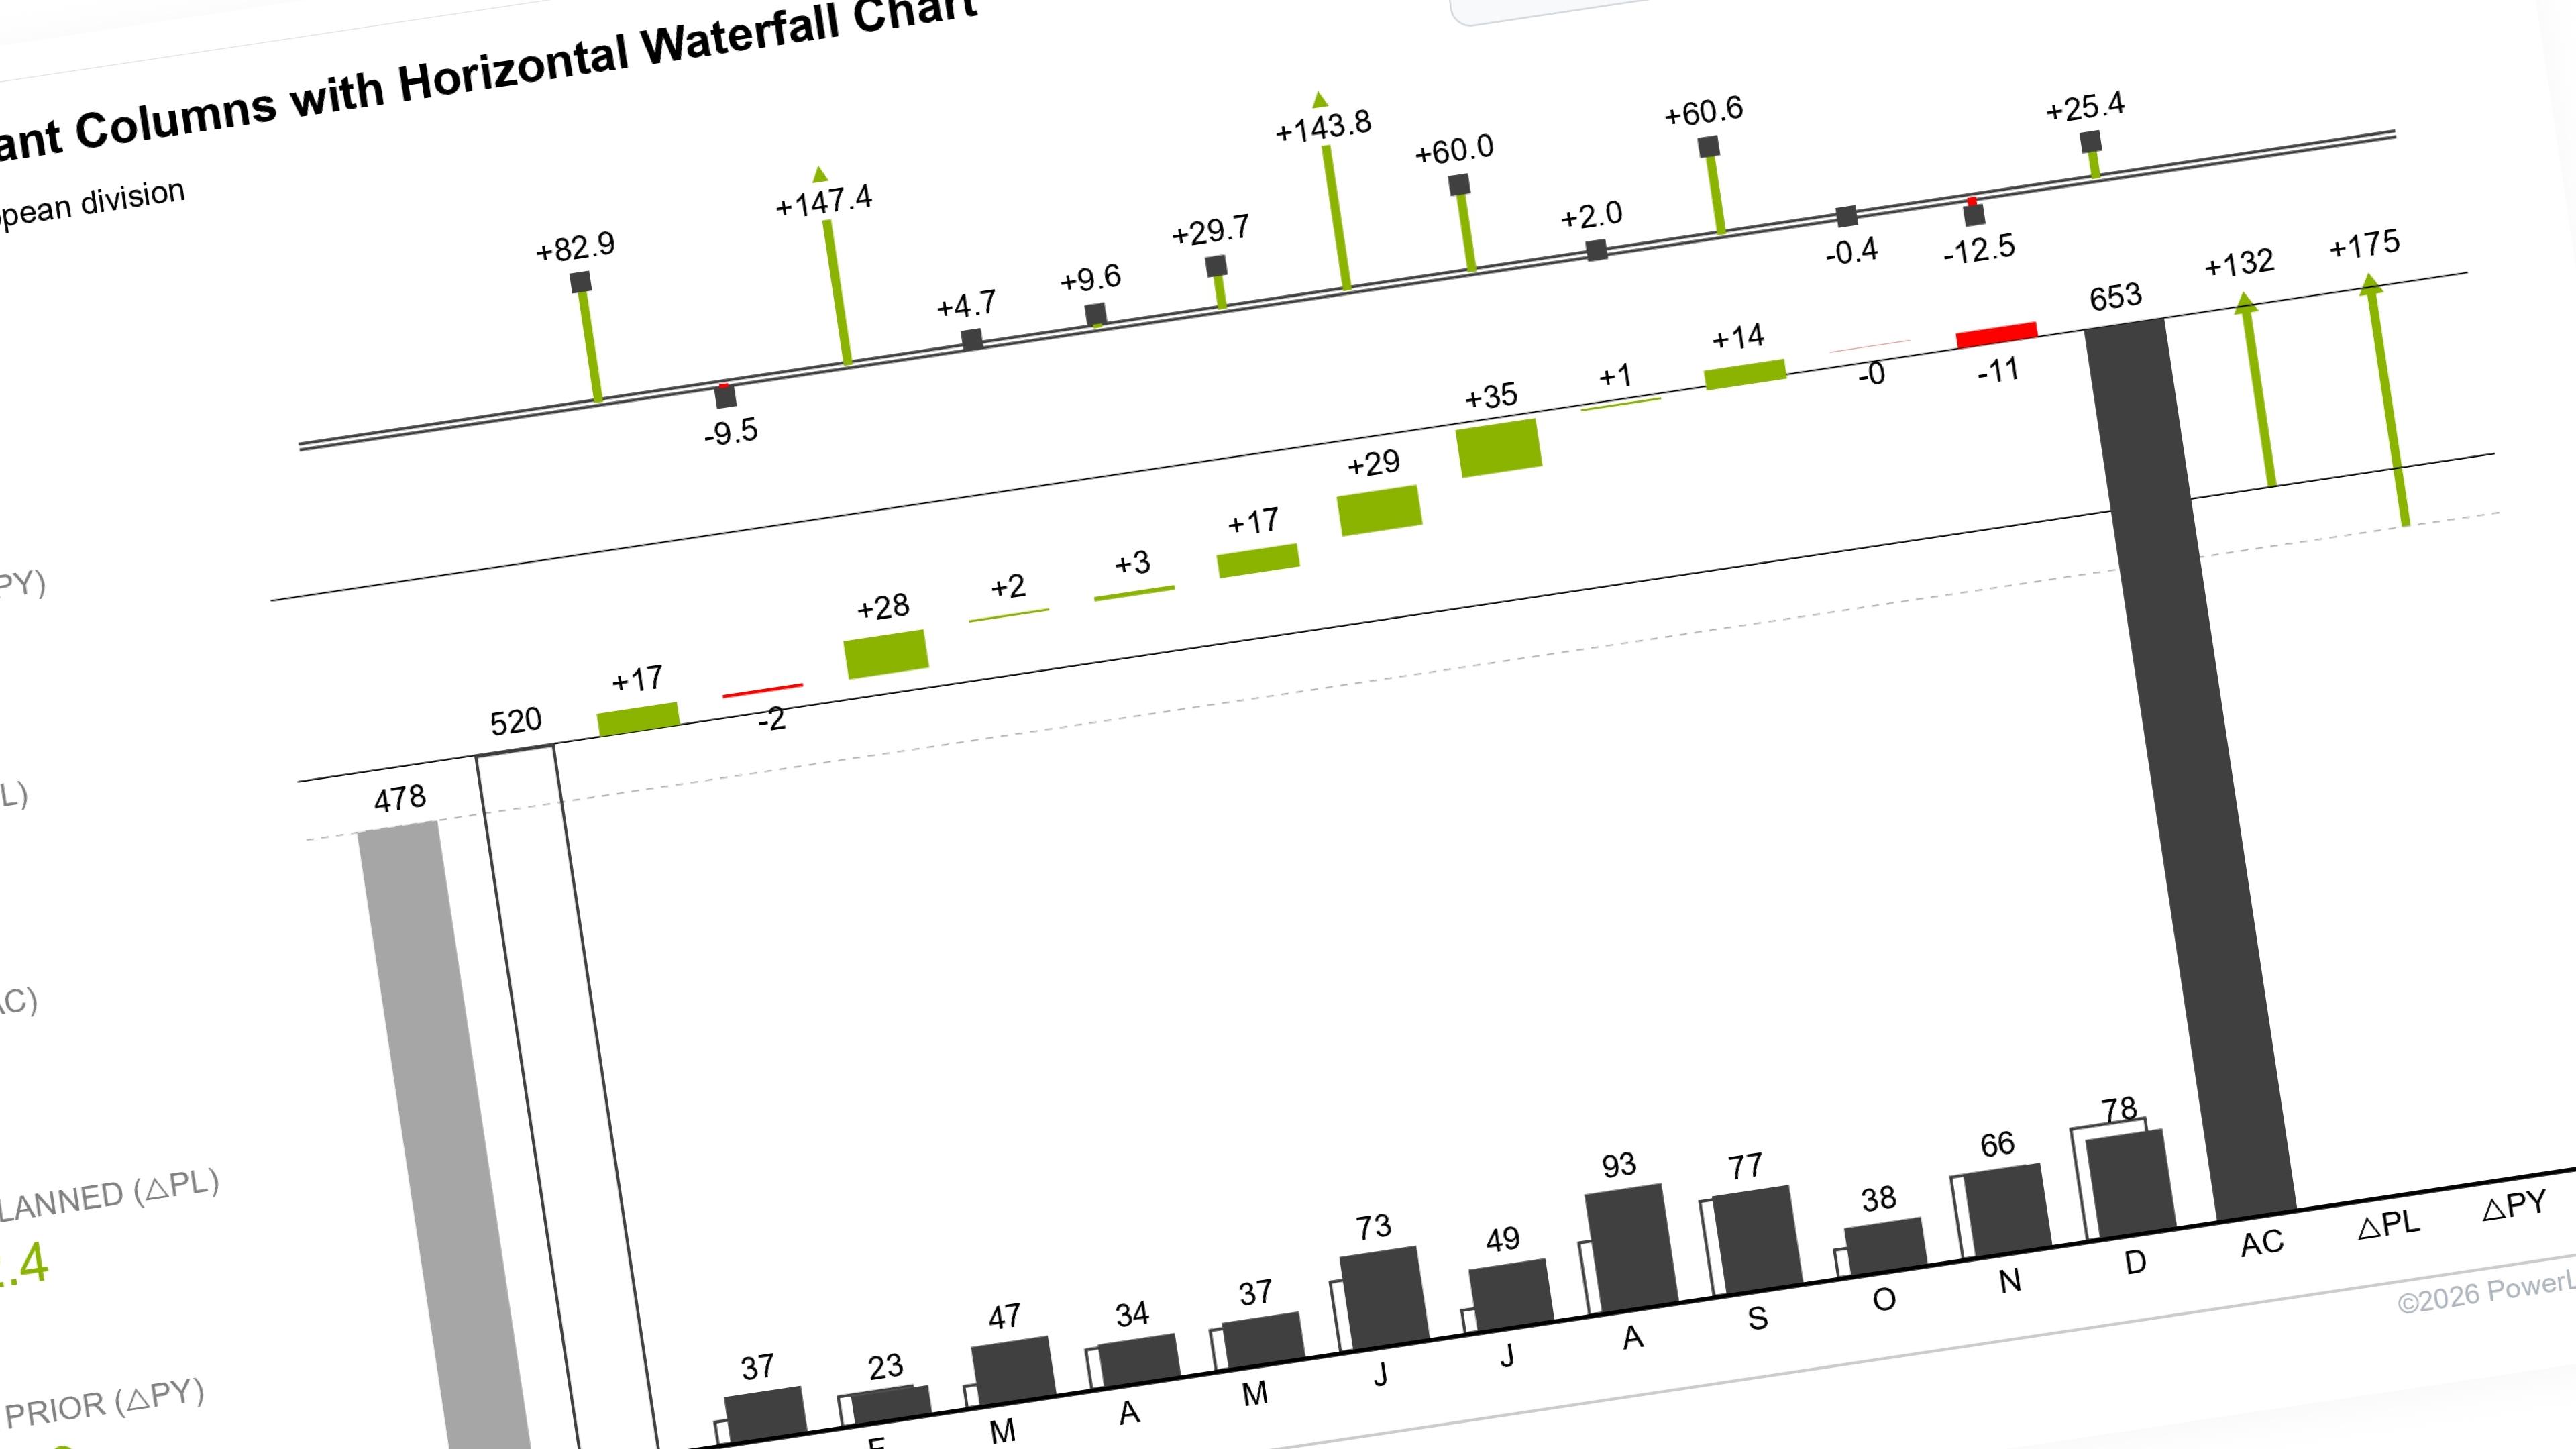
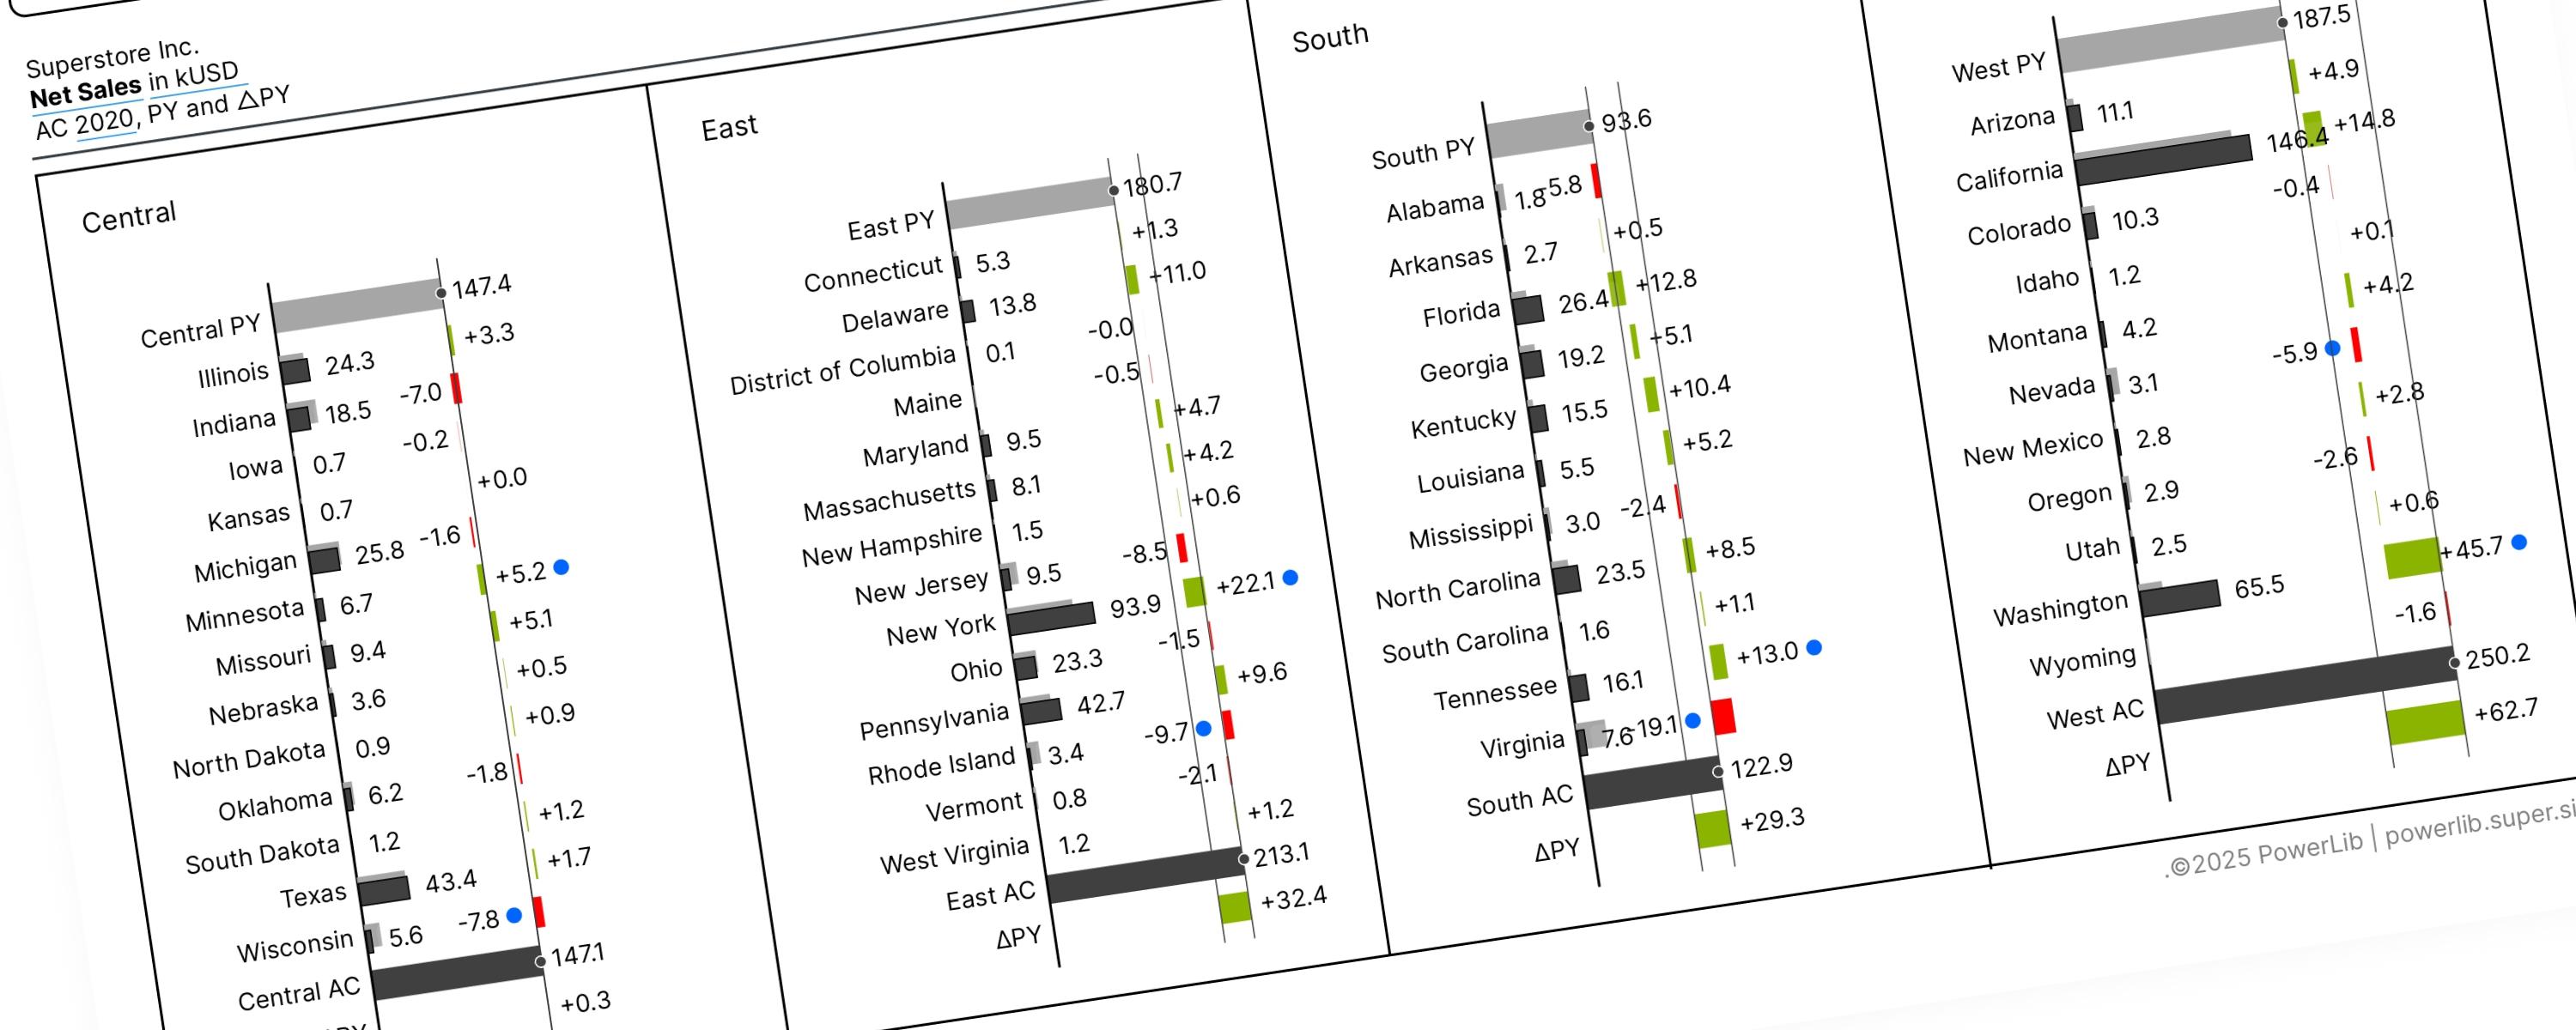
A Vertical Waterfall Chart is a way to clearly show why two numbers are different by breaking down the changes that happened in between.
Imagine you have a starting amount and an ending amount. This chart shows the individual steps (the "drops" or "rises" of the waterfall) that move you from the start to the end.
-
Base Bars and Totals Bars: These are the starting points (Base) and ending results (Totals). They are the main numbers you are comparing.
-
Contribution Bars: These are the bars in between. They represent the individual positive or negative changes (additions or subtractions) that explain the difference.
Starting from the top bar, each contribution bar begins exactly where the last one ended, showing how the total amount is changing step-by-step until it reaches the next total.
The rest of this walkthrough is for members
You have read the problem. What is behind the paywall is the fix:
- The full step-by-step build, from measures to formatting
- Every DAX measure with the reasoning behind it
- The .pbix with the model already wired up
Already a member? Sign in with your email