WaterfallMember-Only
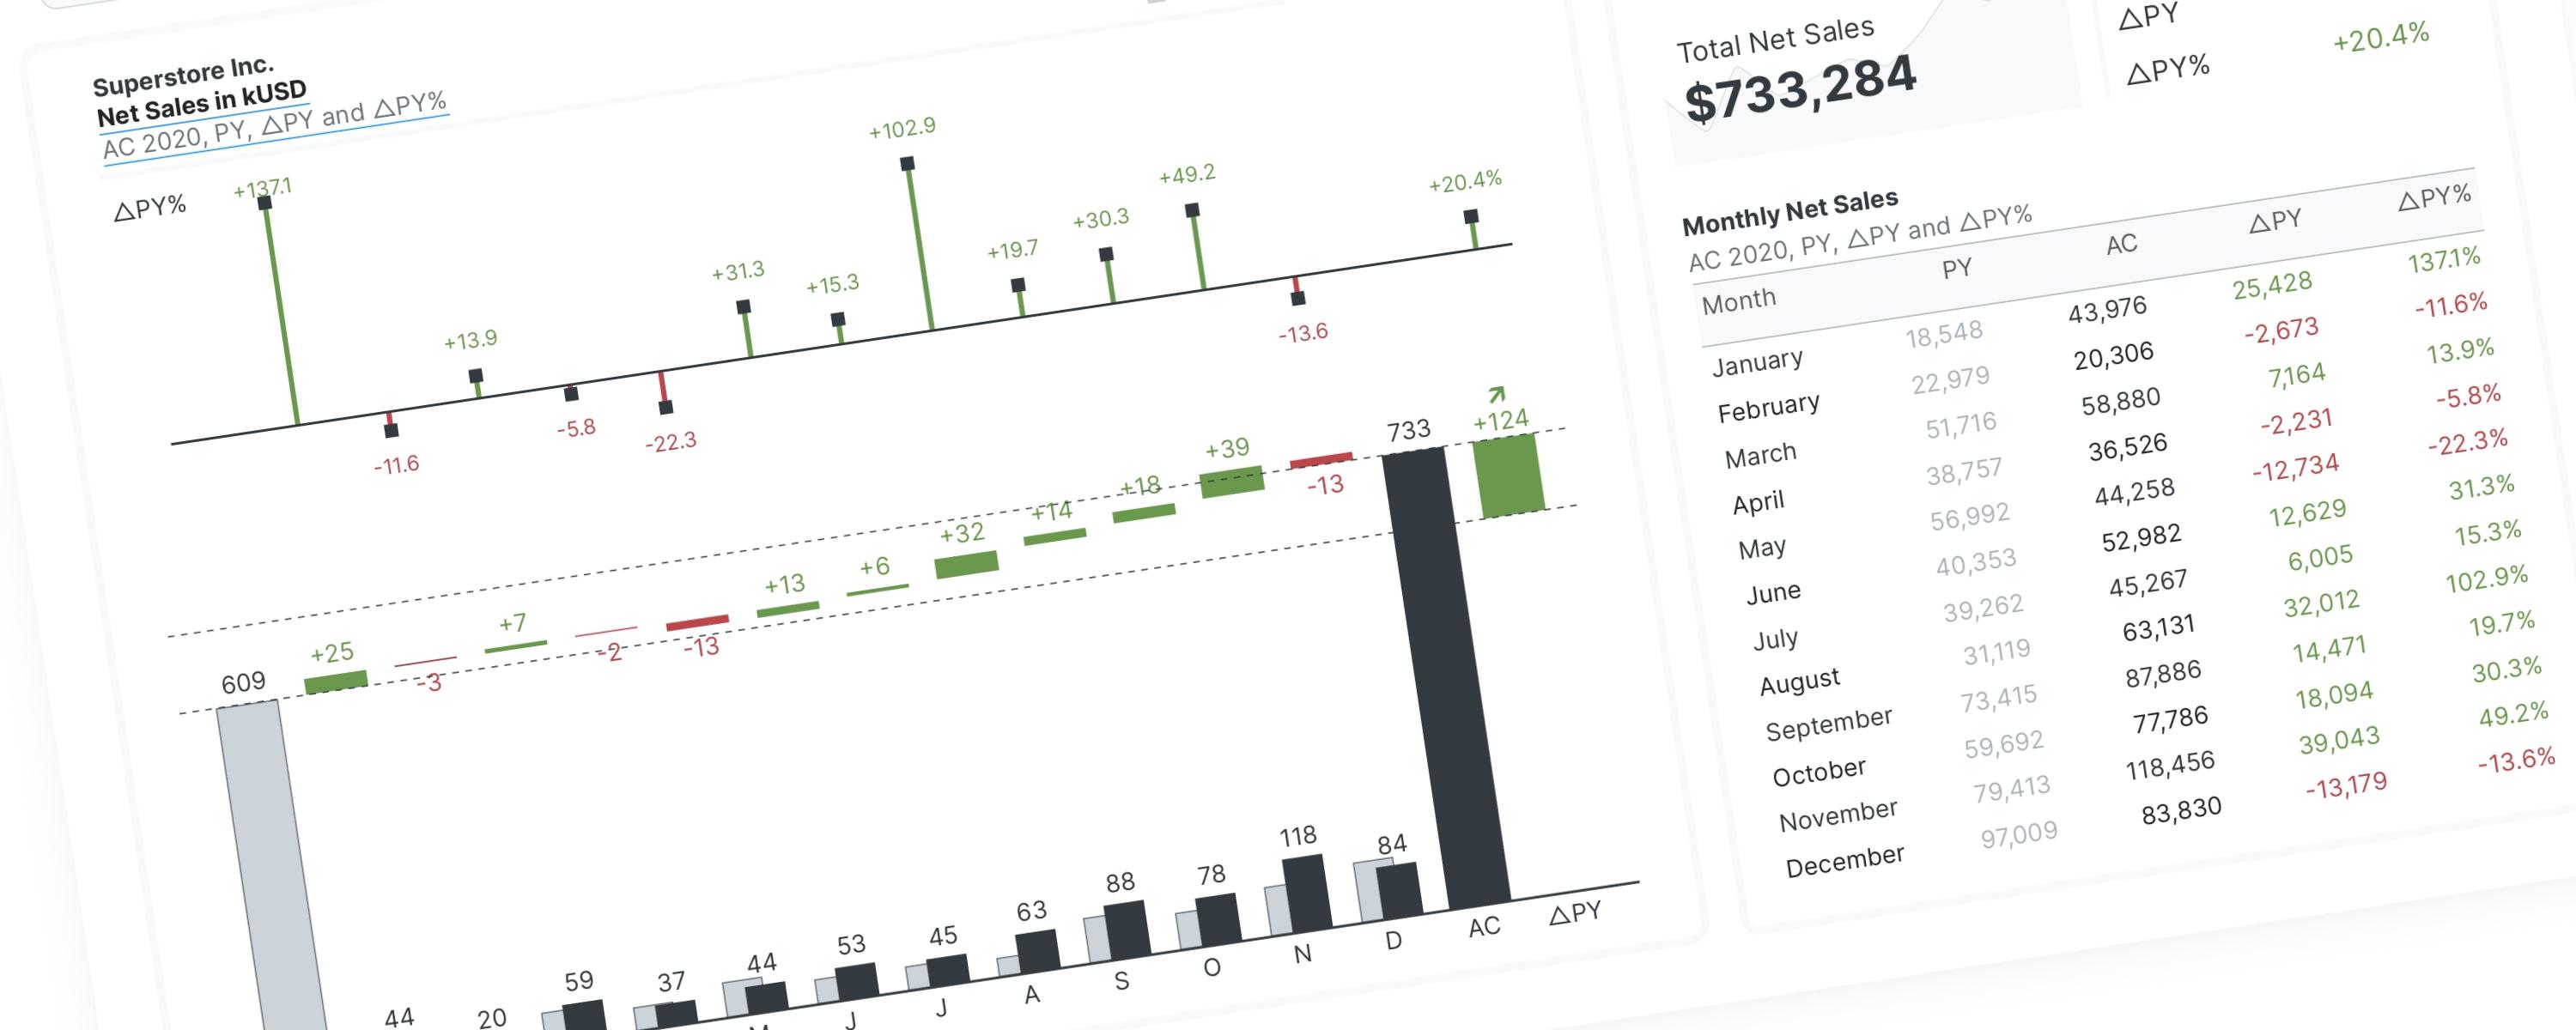
Columns with Horizontal Waterfall Chart (Version 2)
You can find my explanation of the IBCS horizontal waterfall chart's construction logic in Power BI on LinkedIn:
28 October 202515 min read
Documented Power BI techniques — the model change, the DAX, and the exact visual settings. Most are free to read; the rest come with the model files for members.
WaterfallMember-Only
You can find my explanation of the IBCS horizontal waterfall chart's construction logic in Power BI on LinkedIn:
BarFree
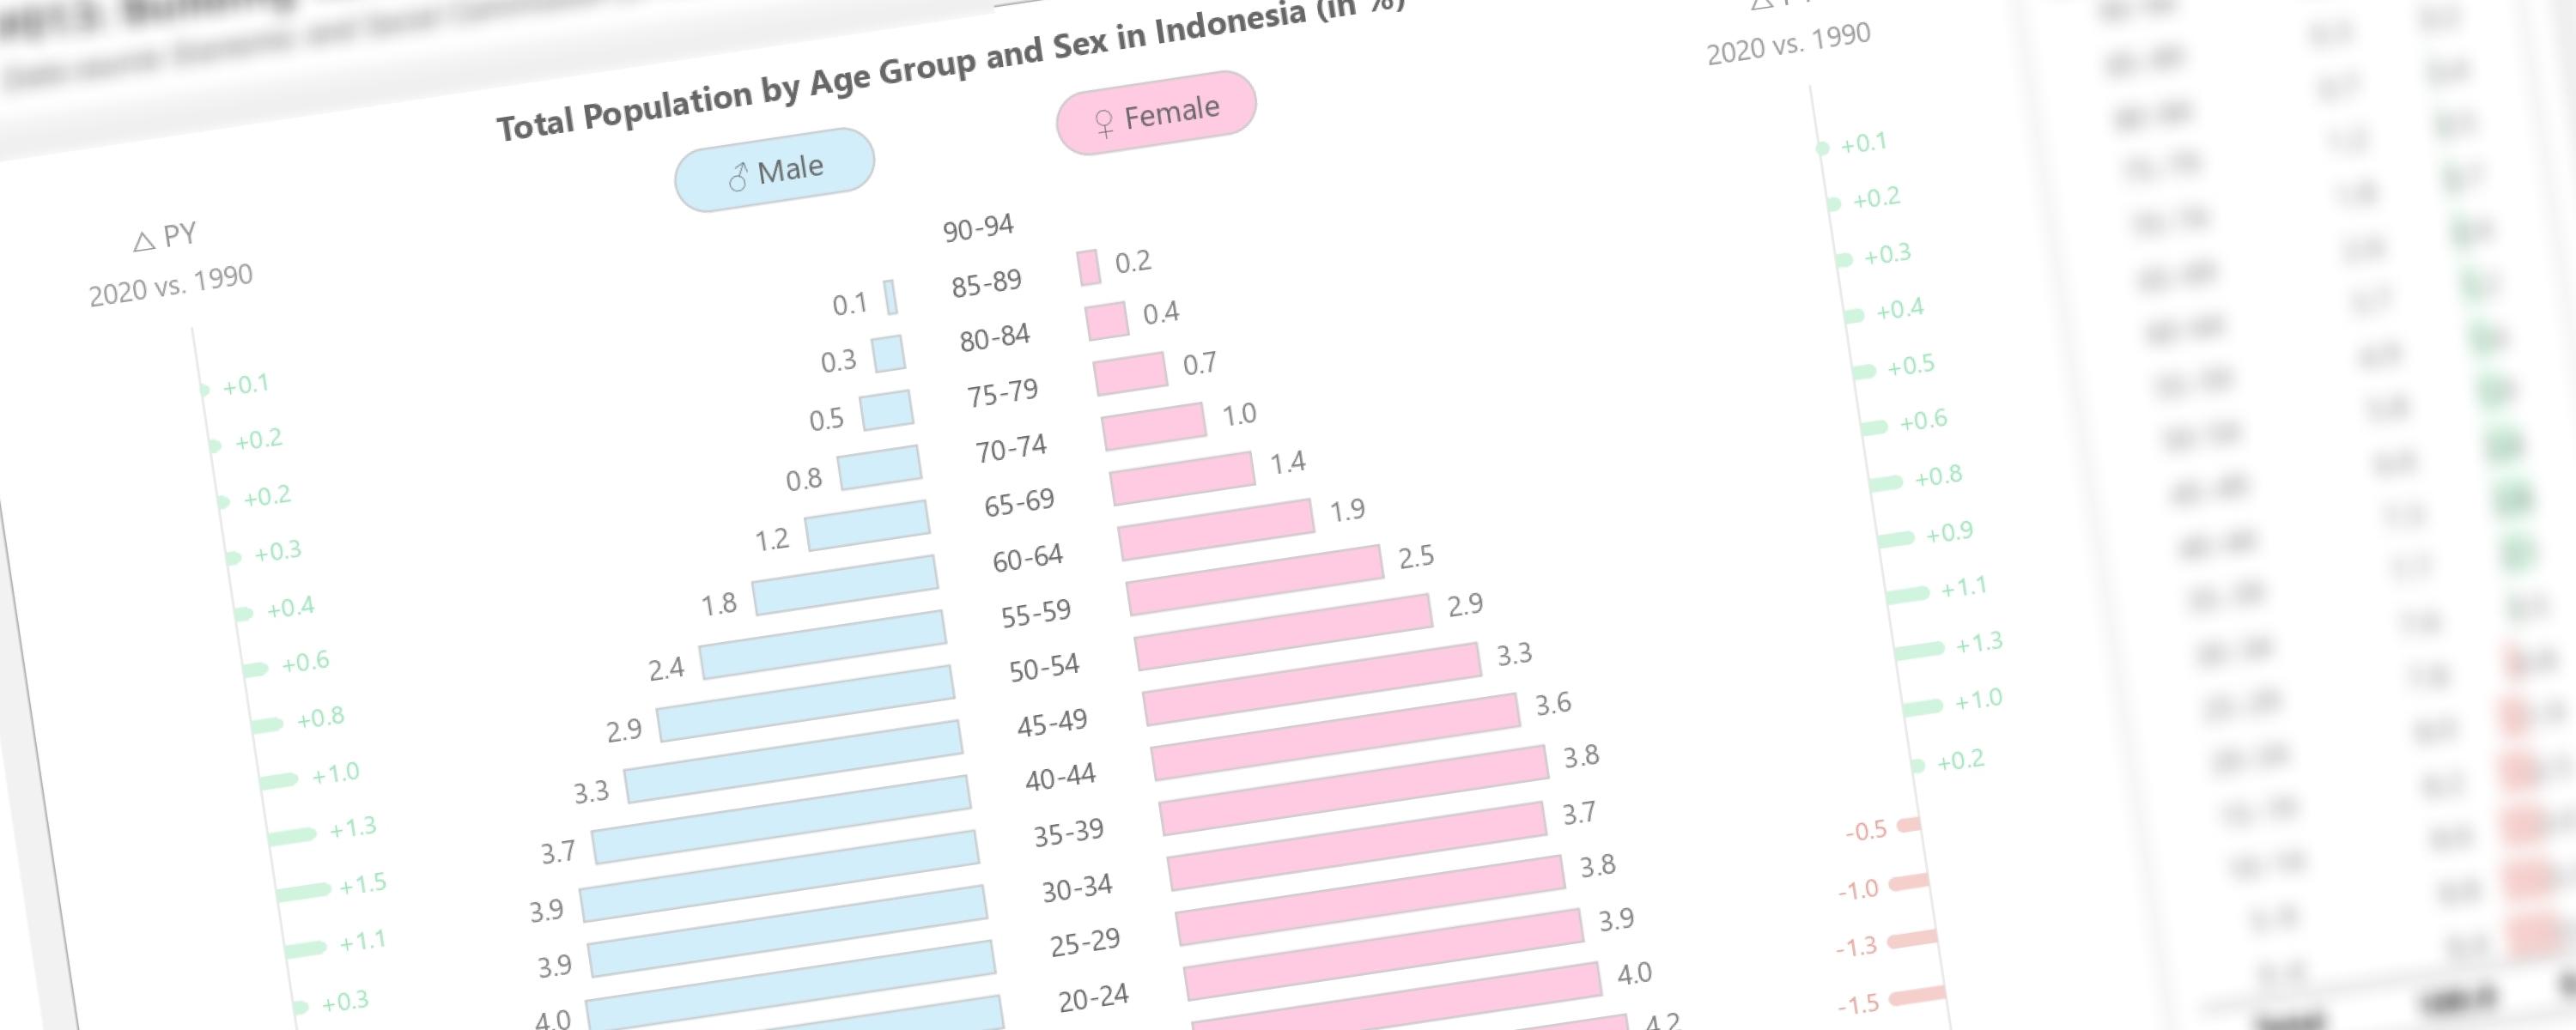
This documentation will guide you how to create tornado chart, also known as tornado diagram or butterfly chart, in Power BI using entirely native visuals.
Matrix/TableFree
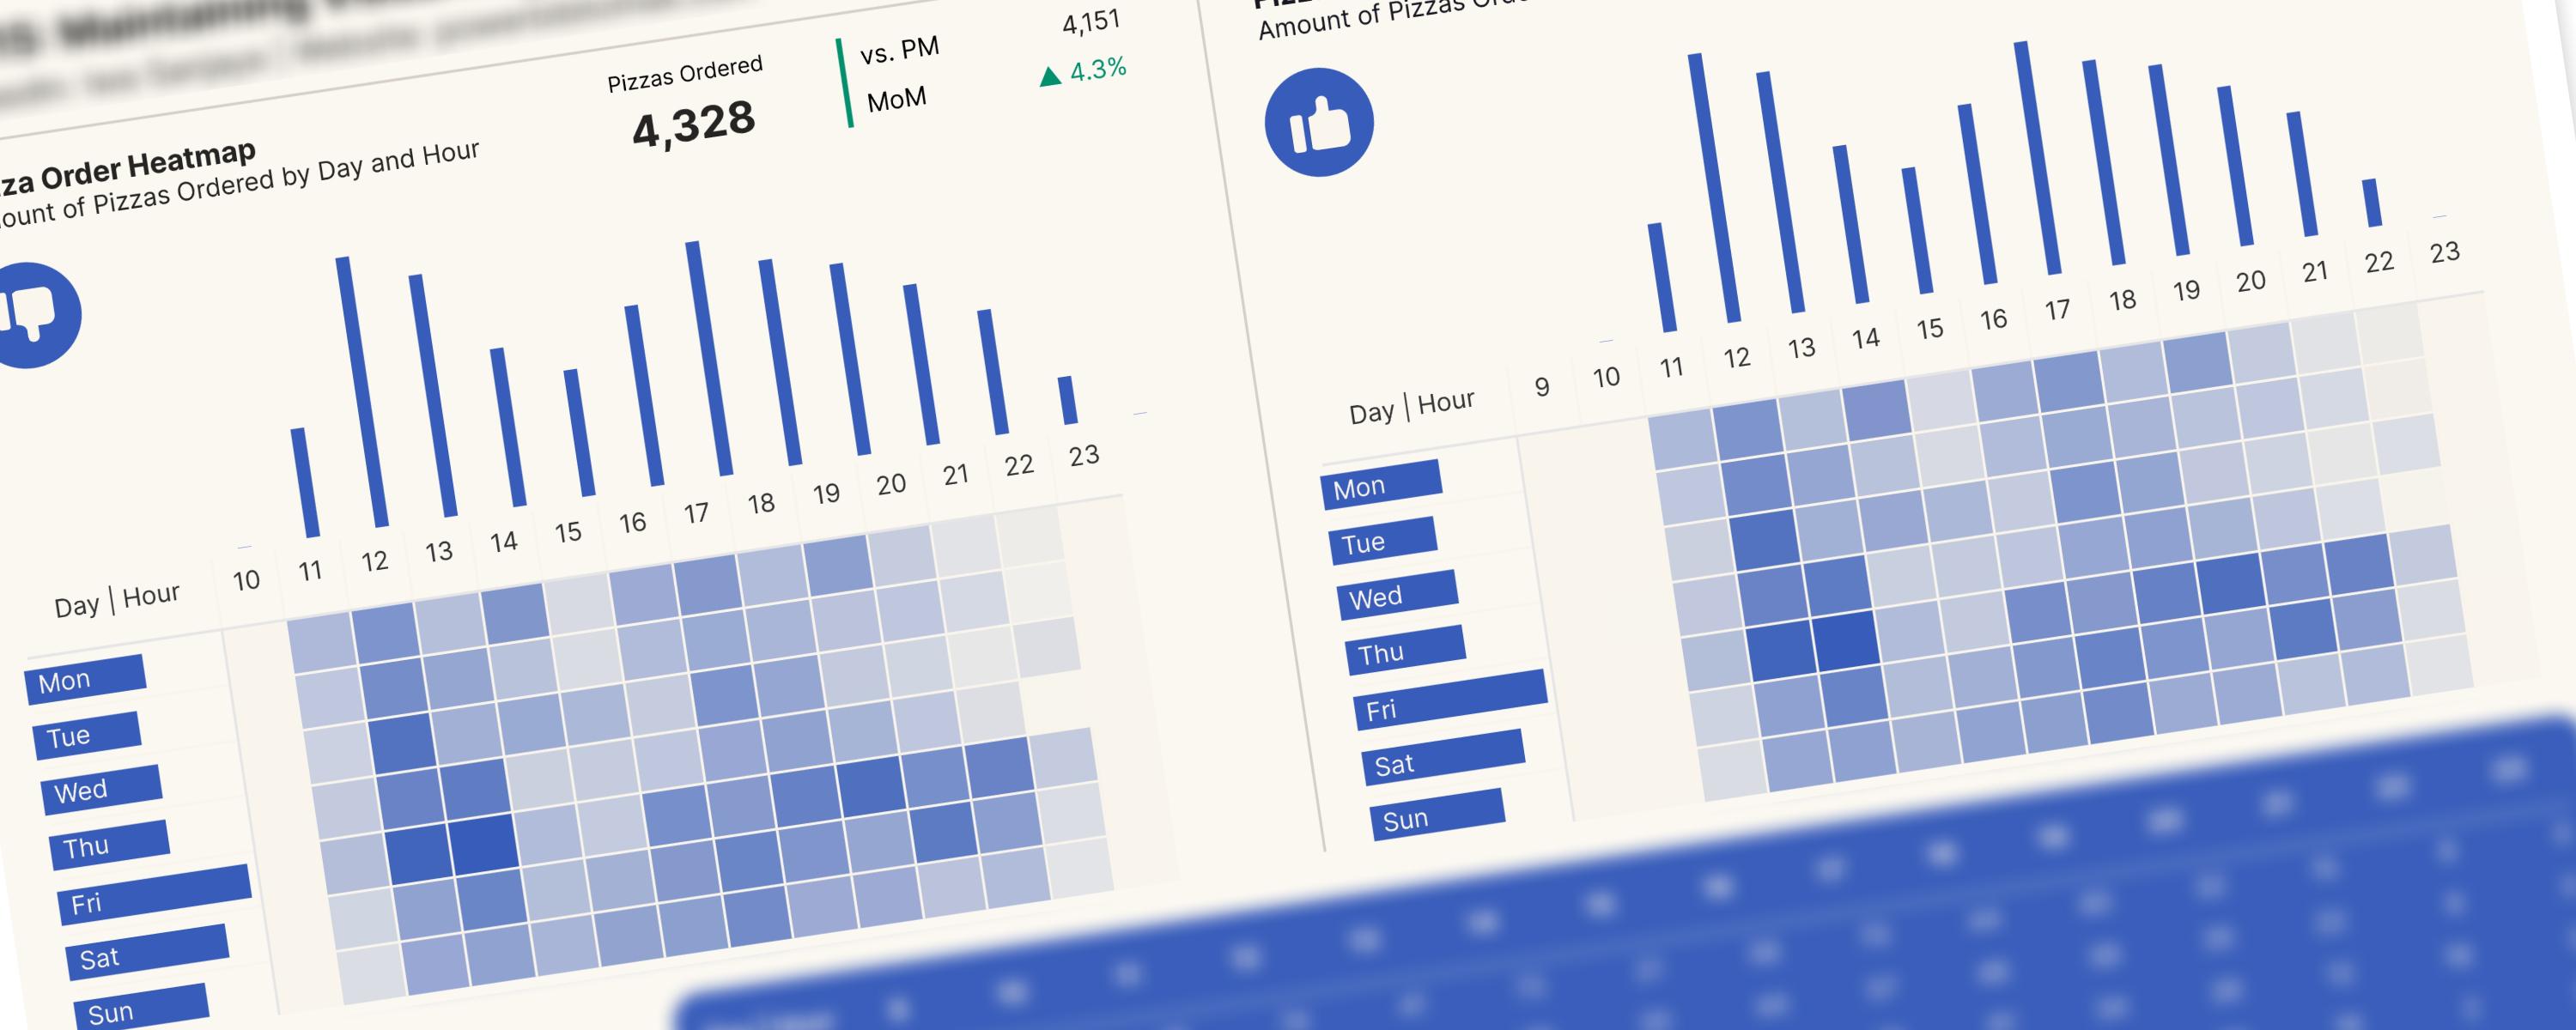
This documentation will walk you through the process of creating a combined visualization using a matrix and bar/column charts, ensuring they remain visually aligned regardless of…
BarFree
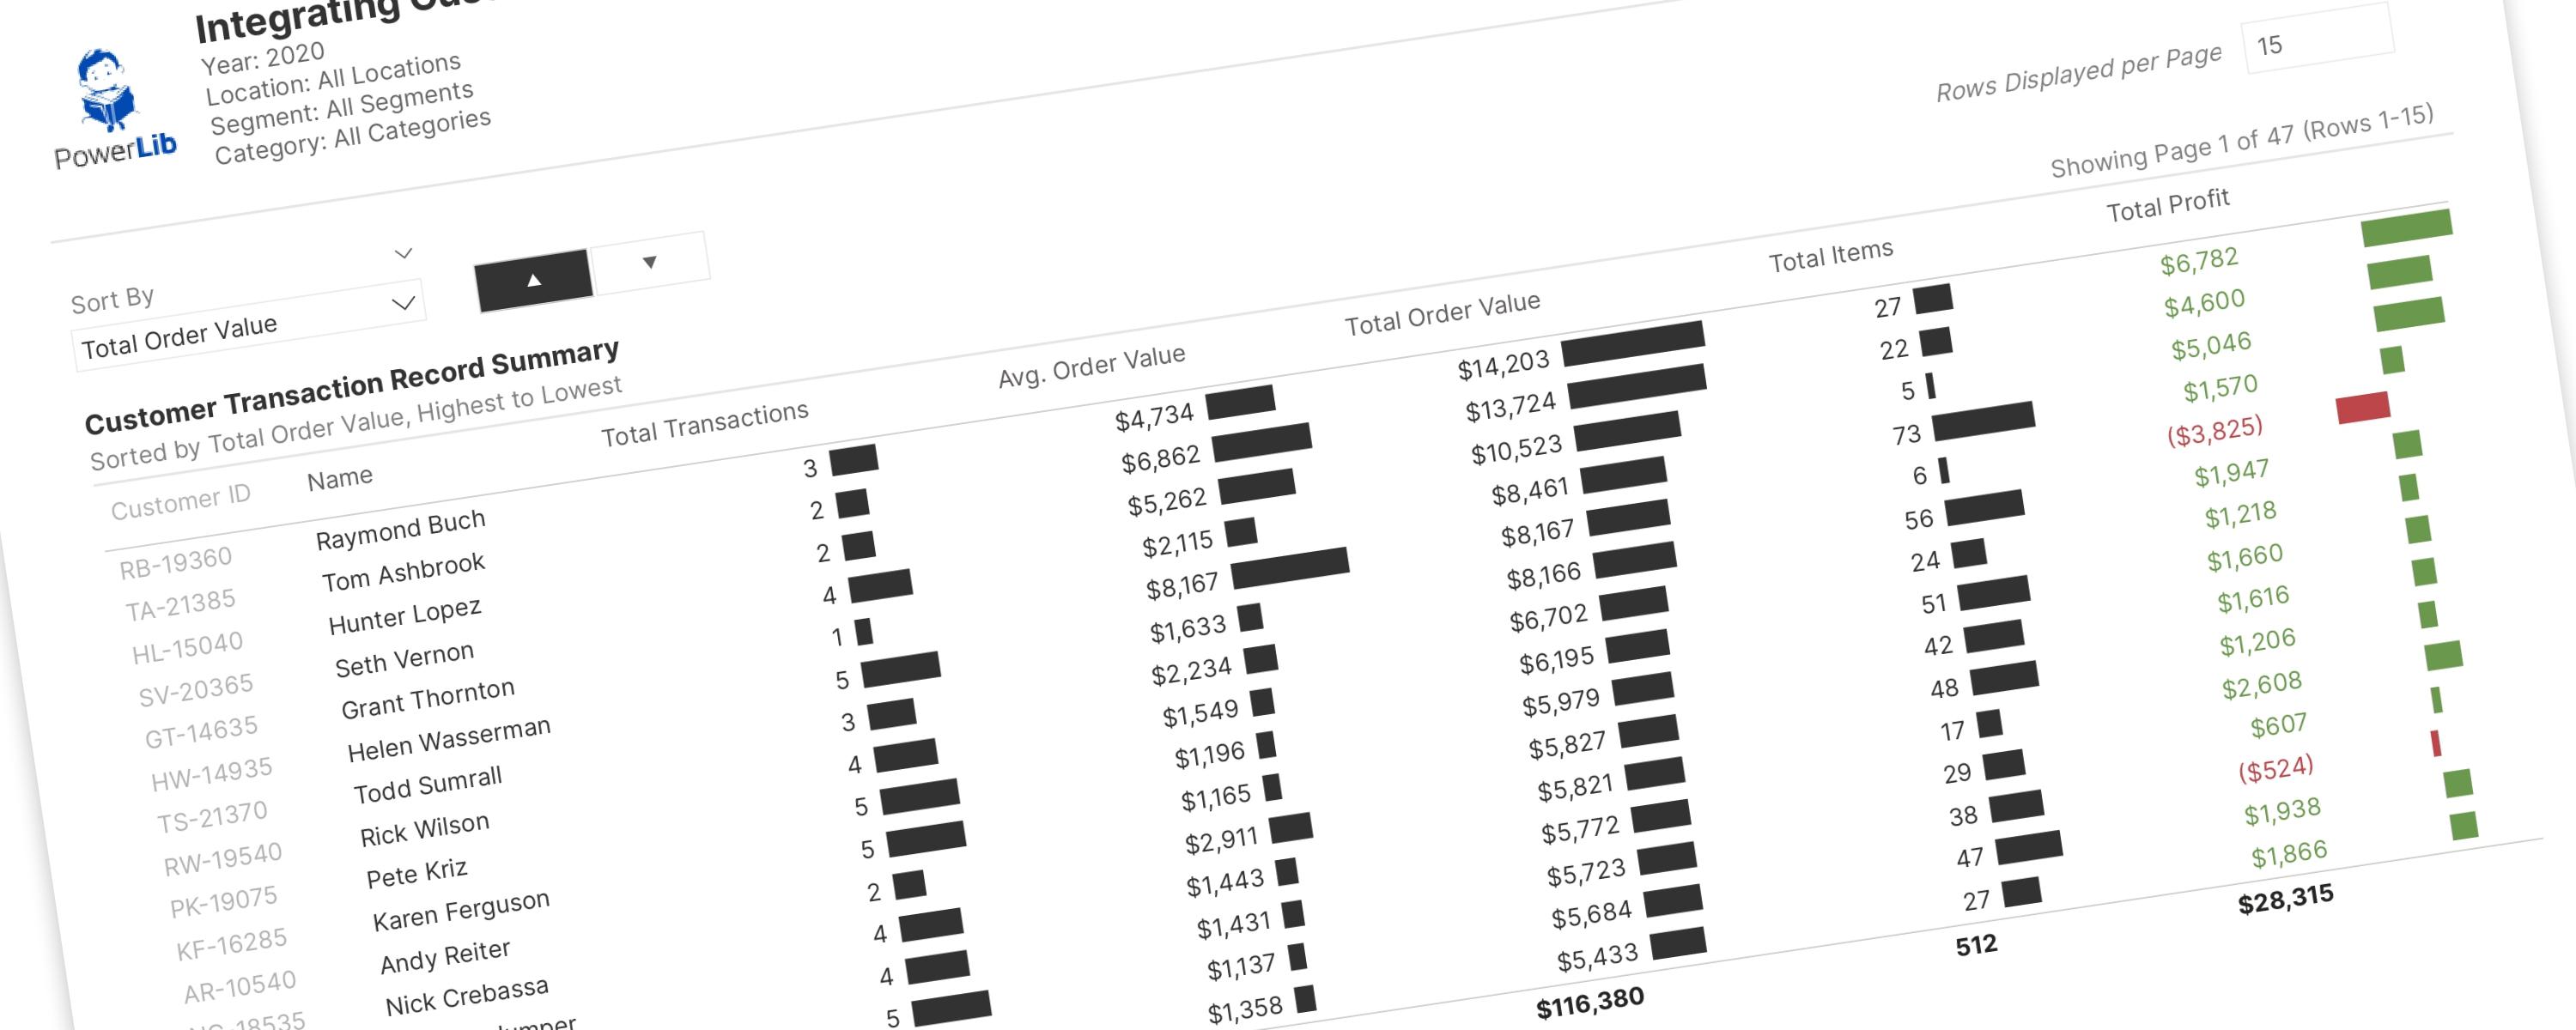
This documentation details advanced pagination techniques, extending my previous tutorial and documentation.
Matrix/TableFree
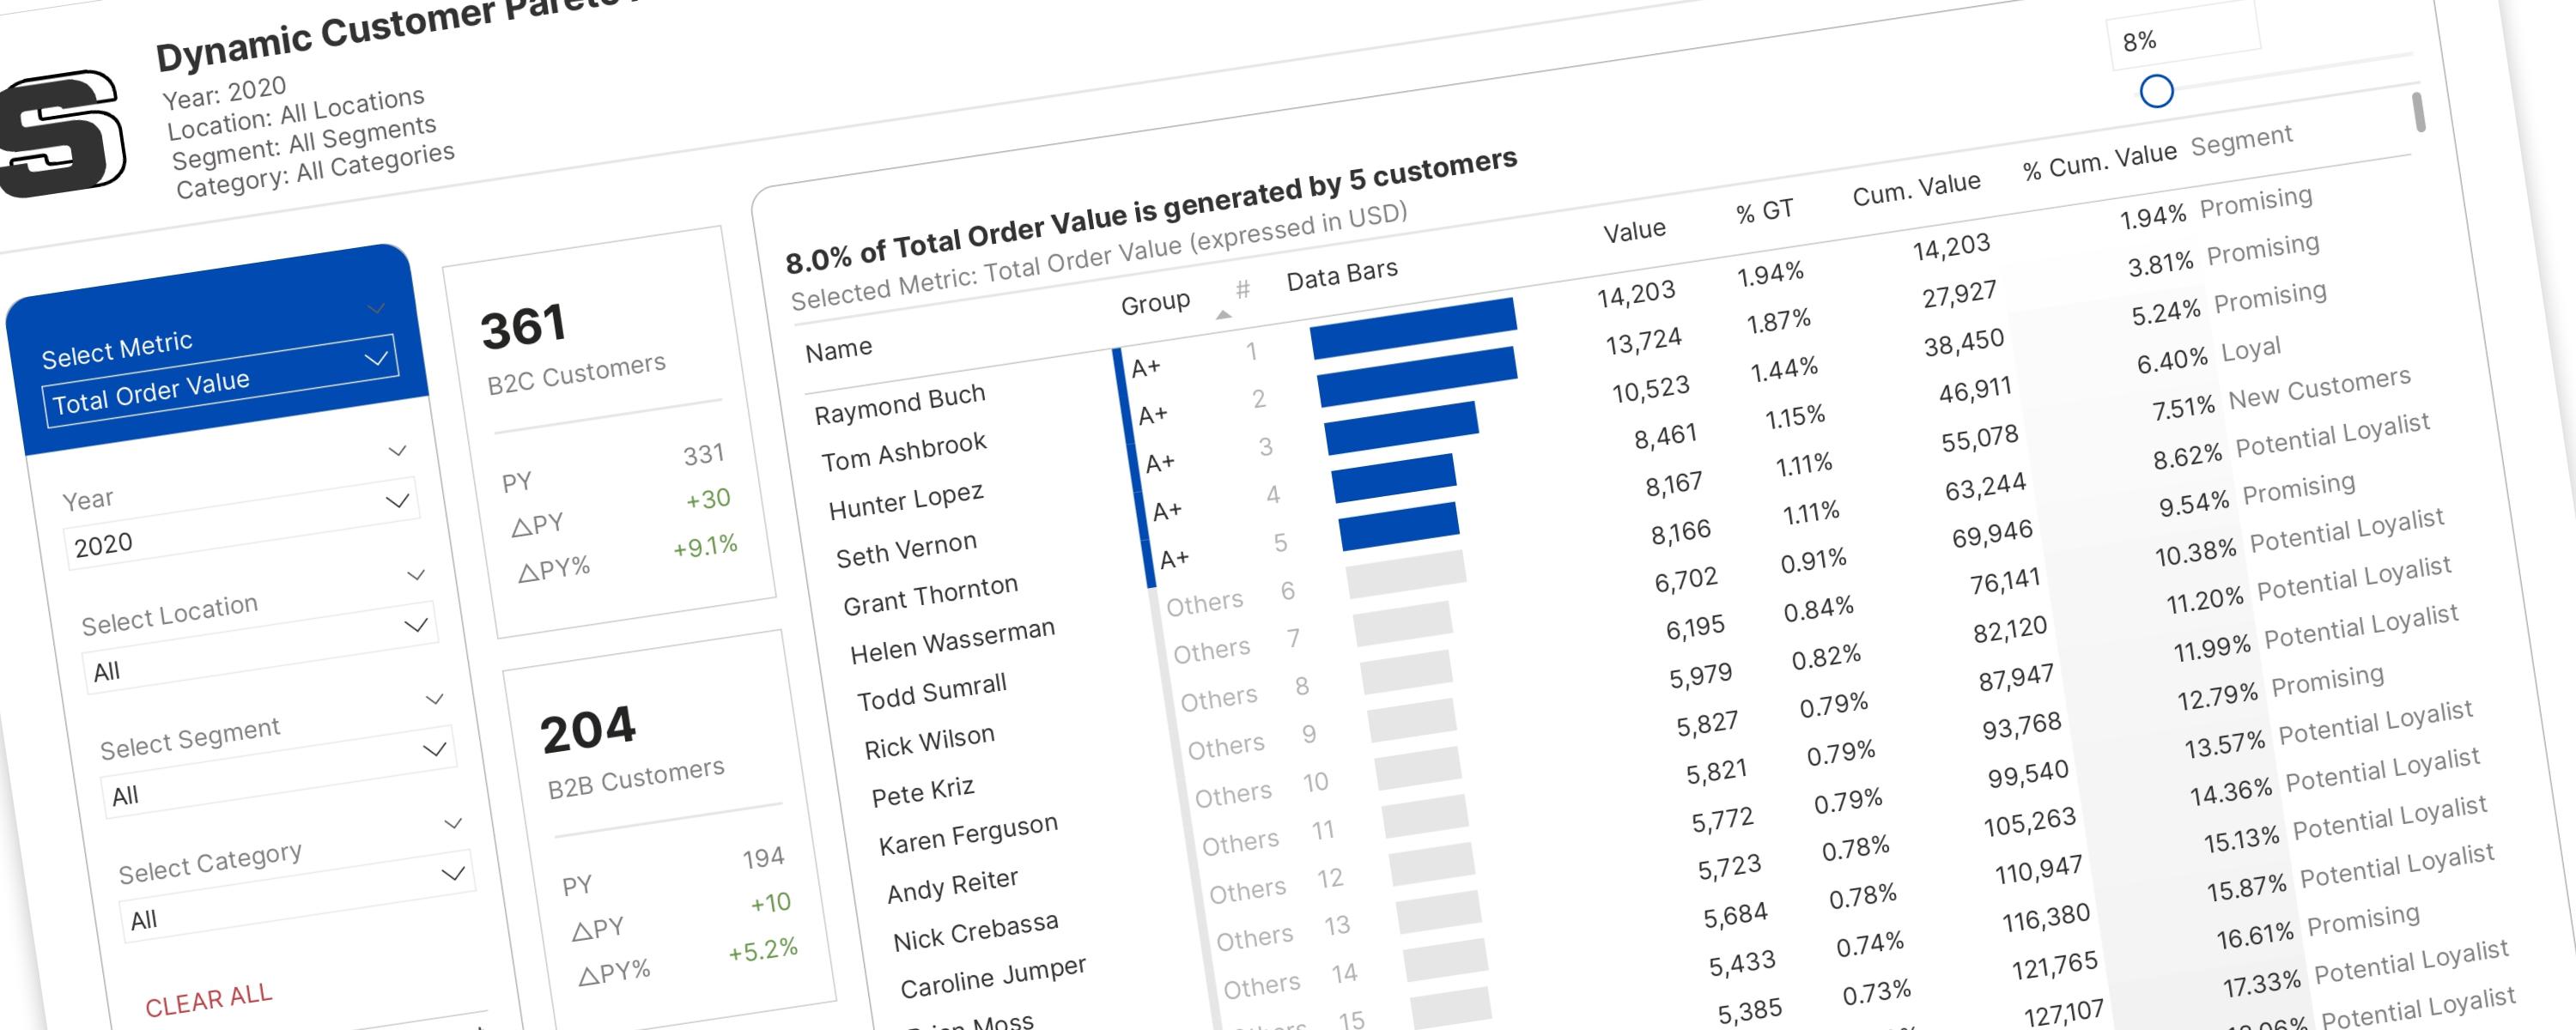
This documentation provides a step-by-step approach to building the first version of the one-for-all customer Pareto analysis dashboard.
Matrix/TableFree
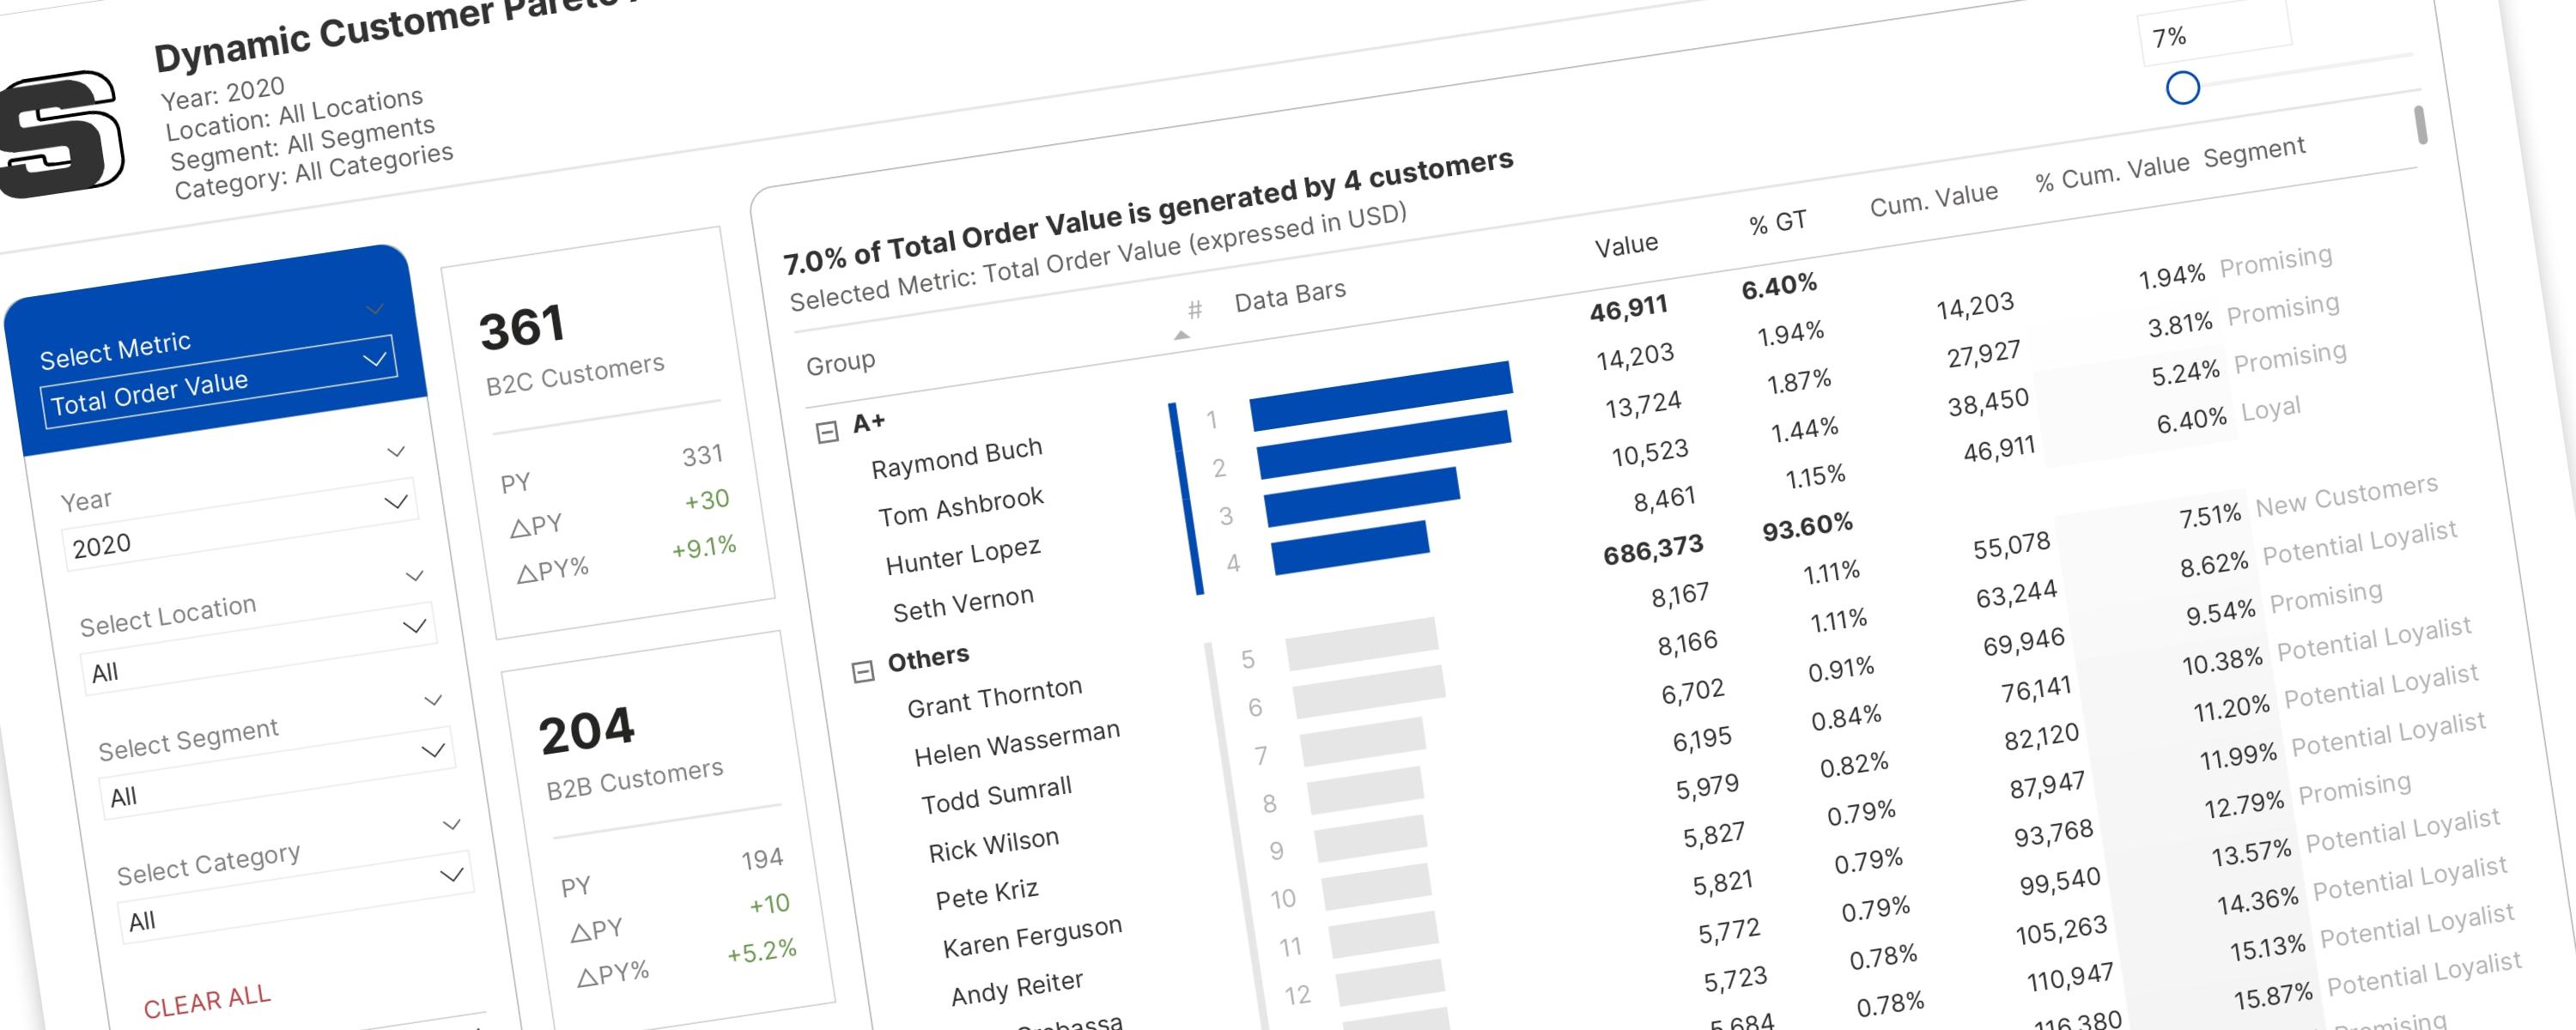
Imagine you have a big pile of something – let's say, 100 colorful building blocks.
BarFree
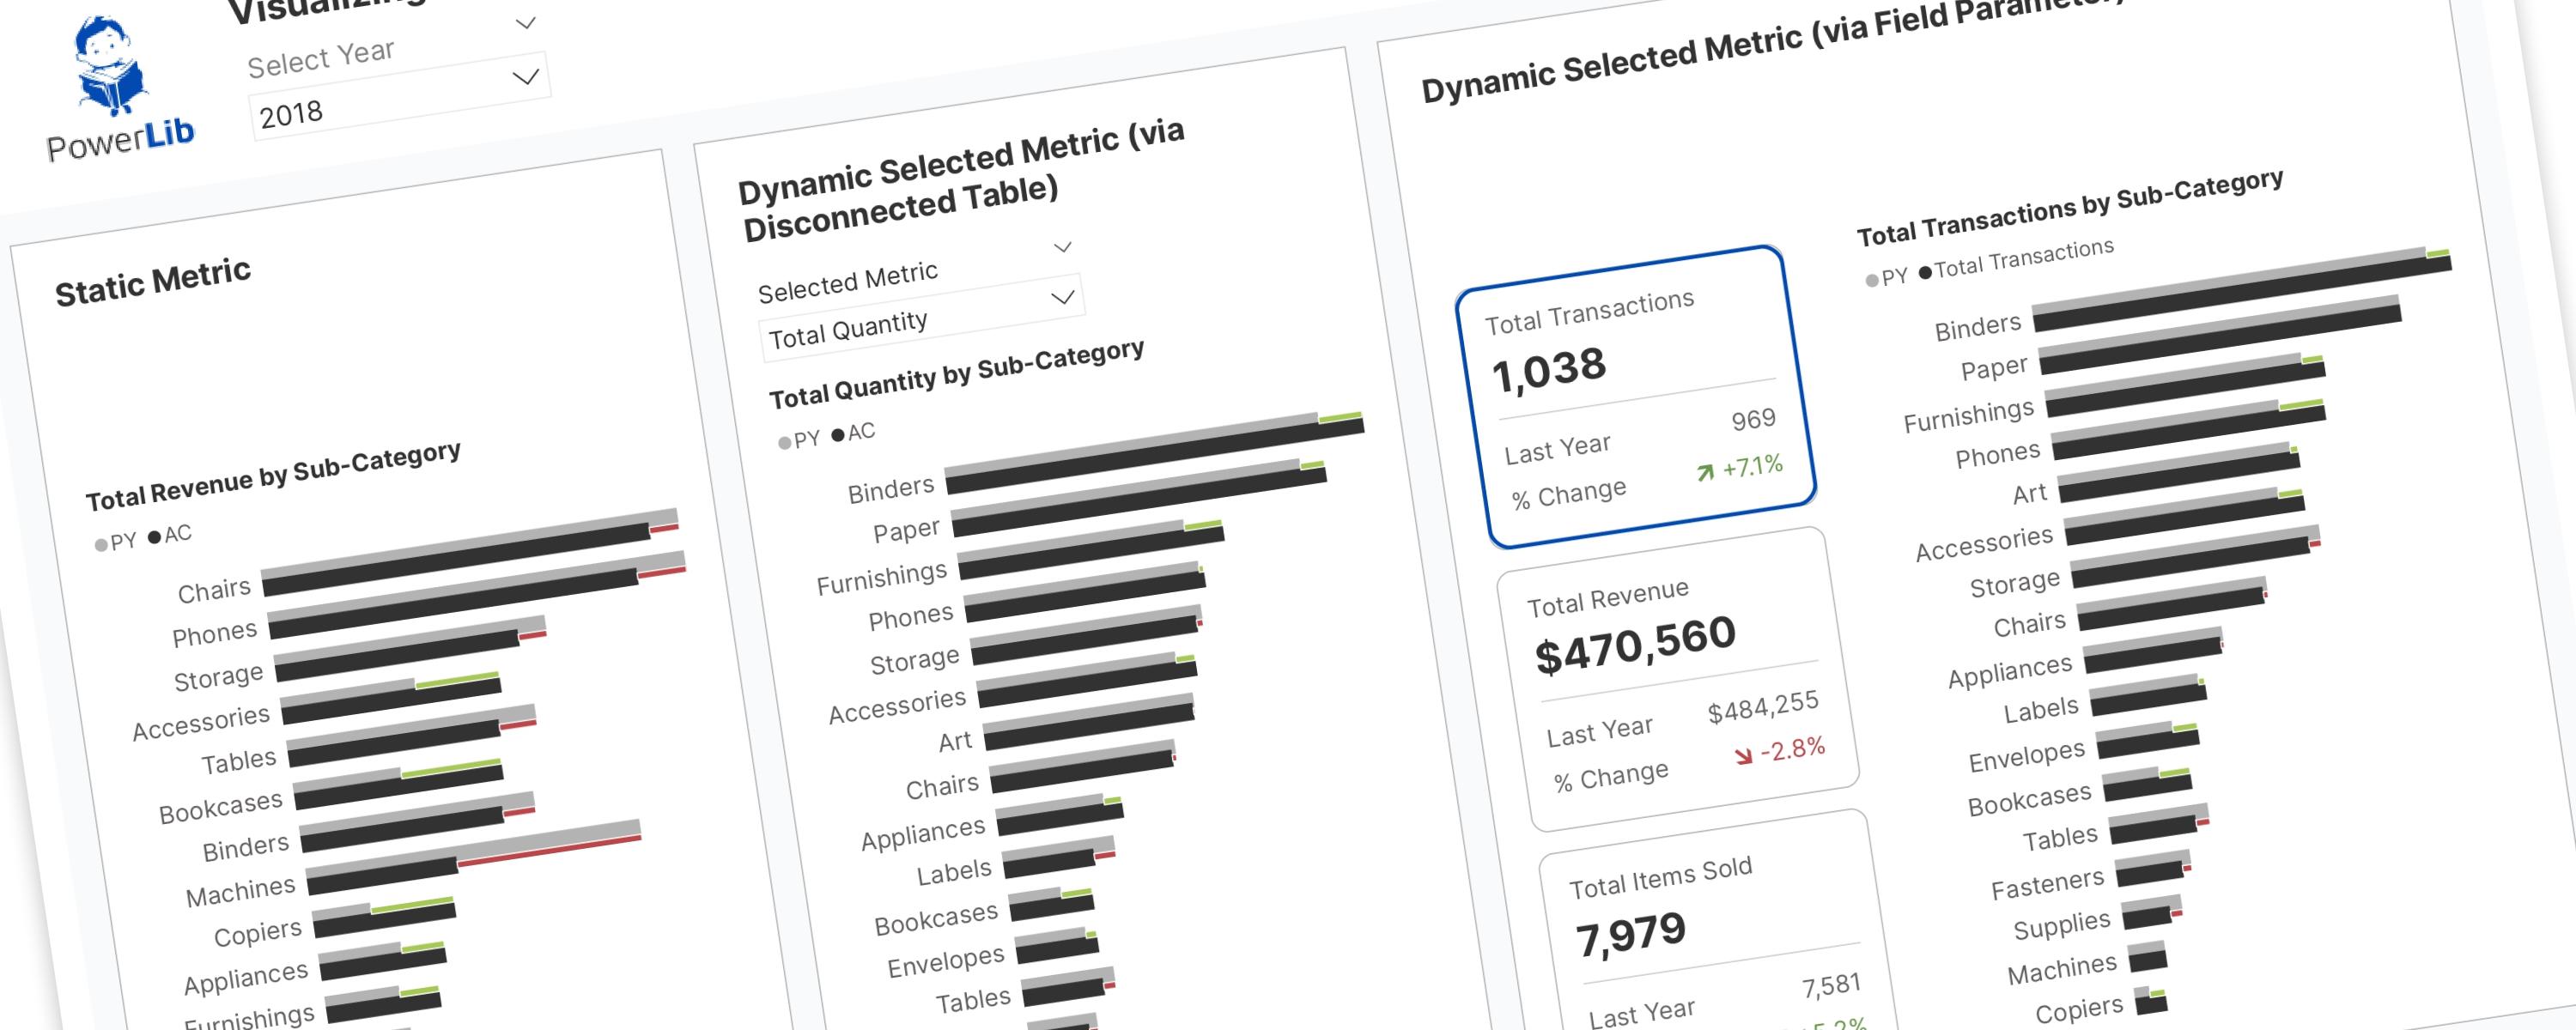
RETURN SWITCH( SelectedMetric, "Total Transactions", "Total Transactions by Sub-Category", "Total Revenue", "Total Revenue by Sub-Category", "Total Quantity", "Total Quantity by…
Scatter PlotMember-Only
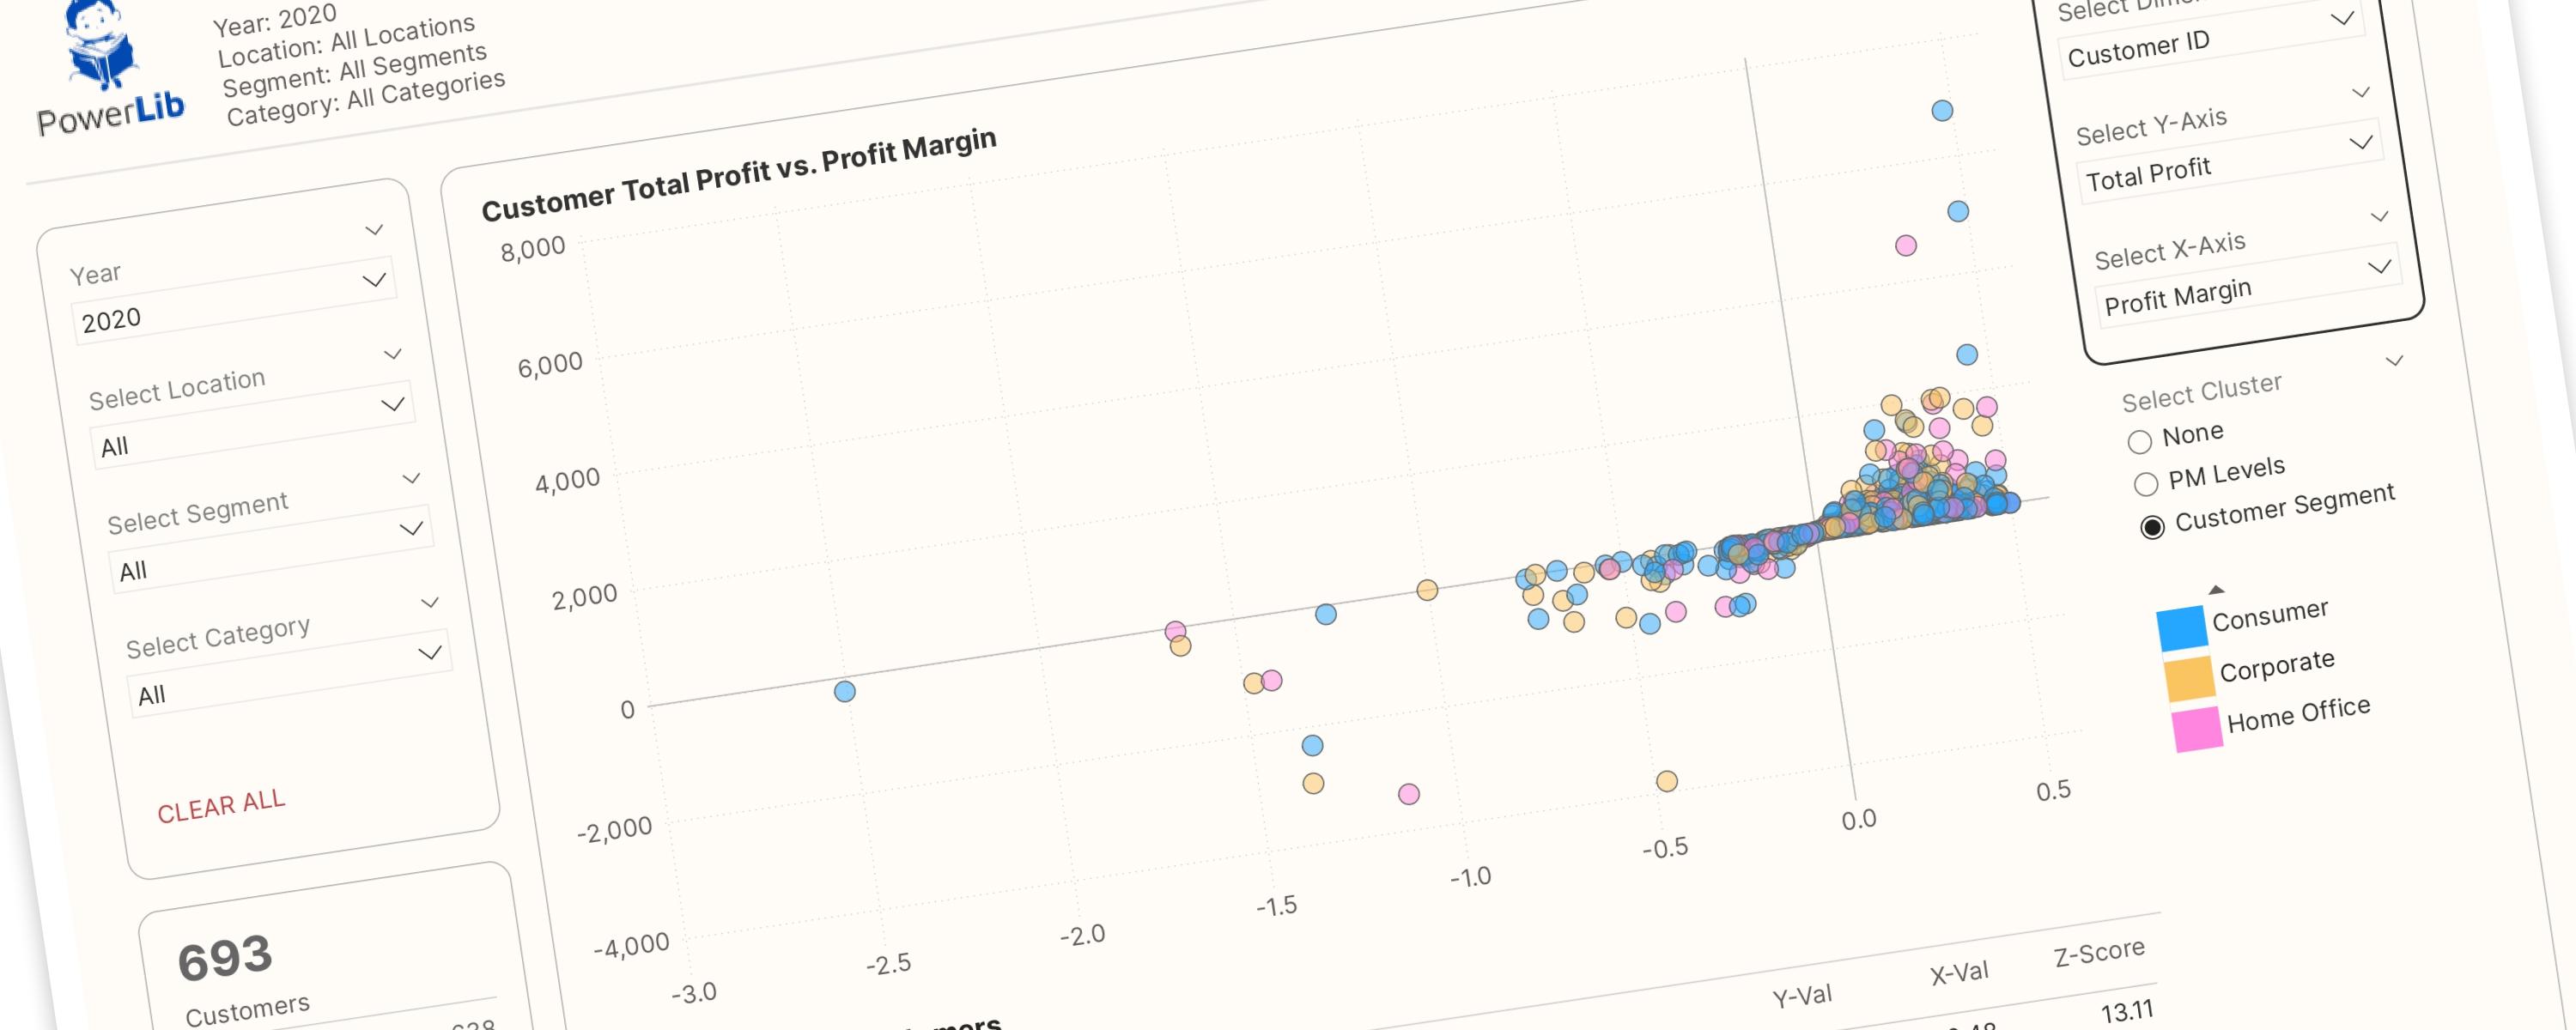
This interactive scatter plot is designed to empower users to interactively explore relationships between different dimensions and metrics. Key features include:
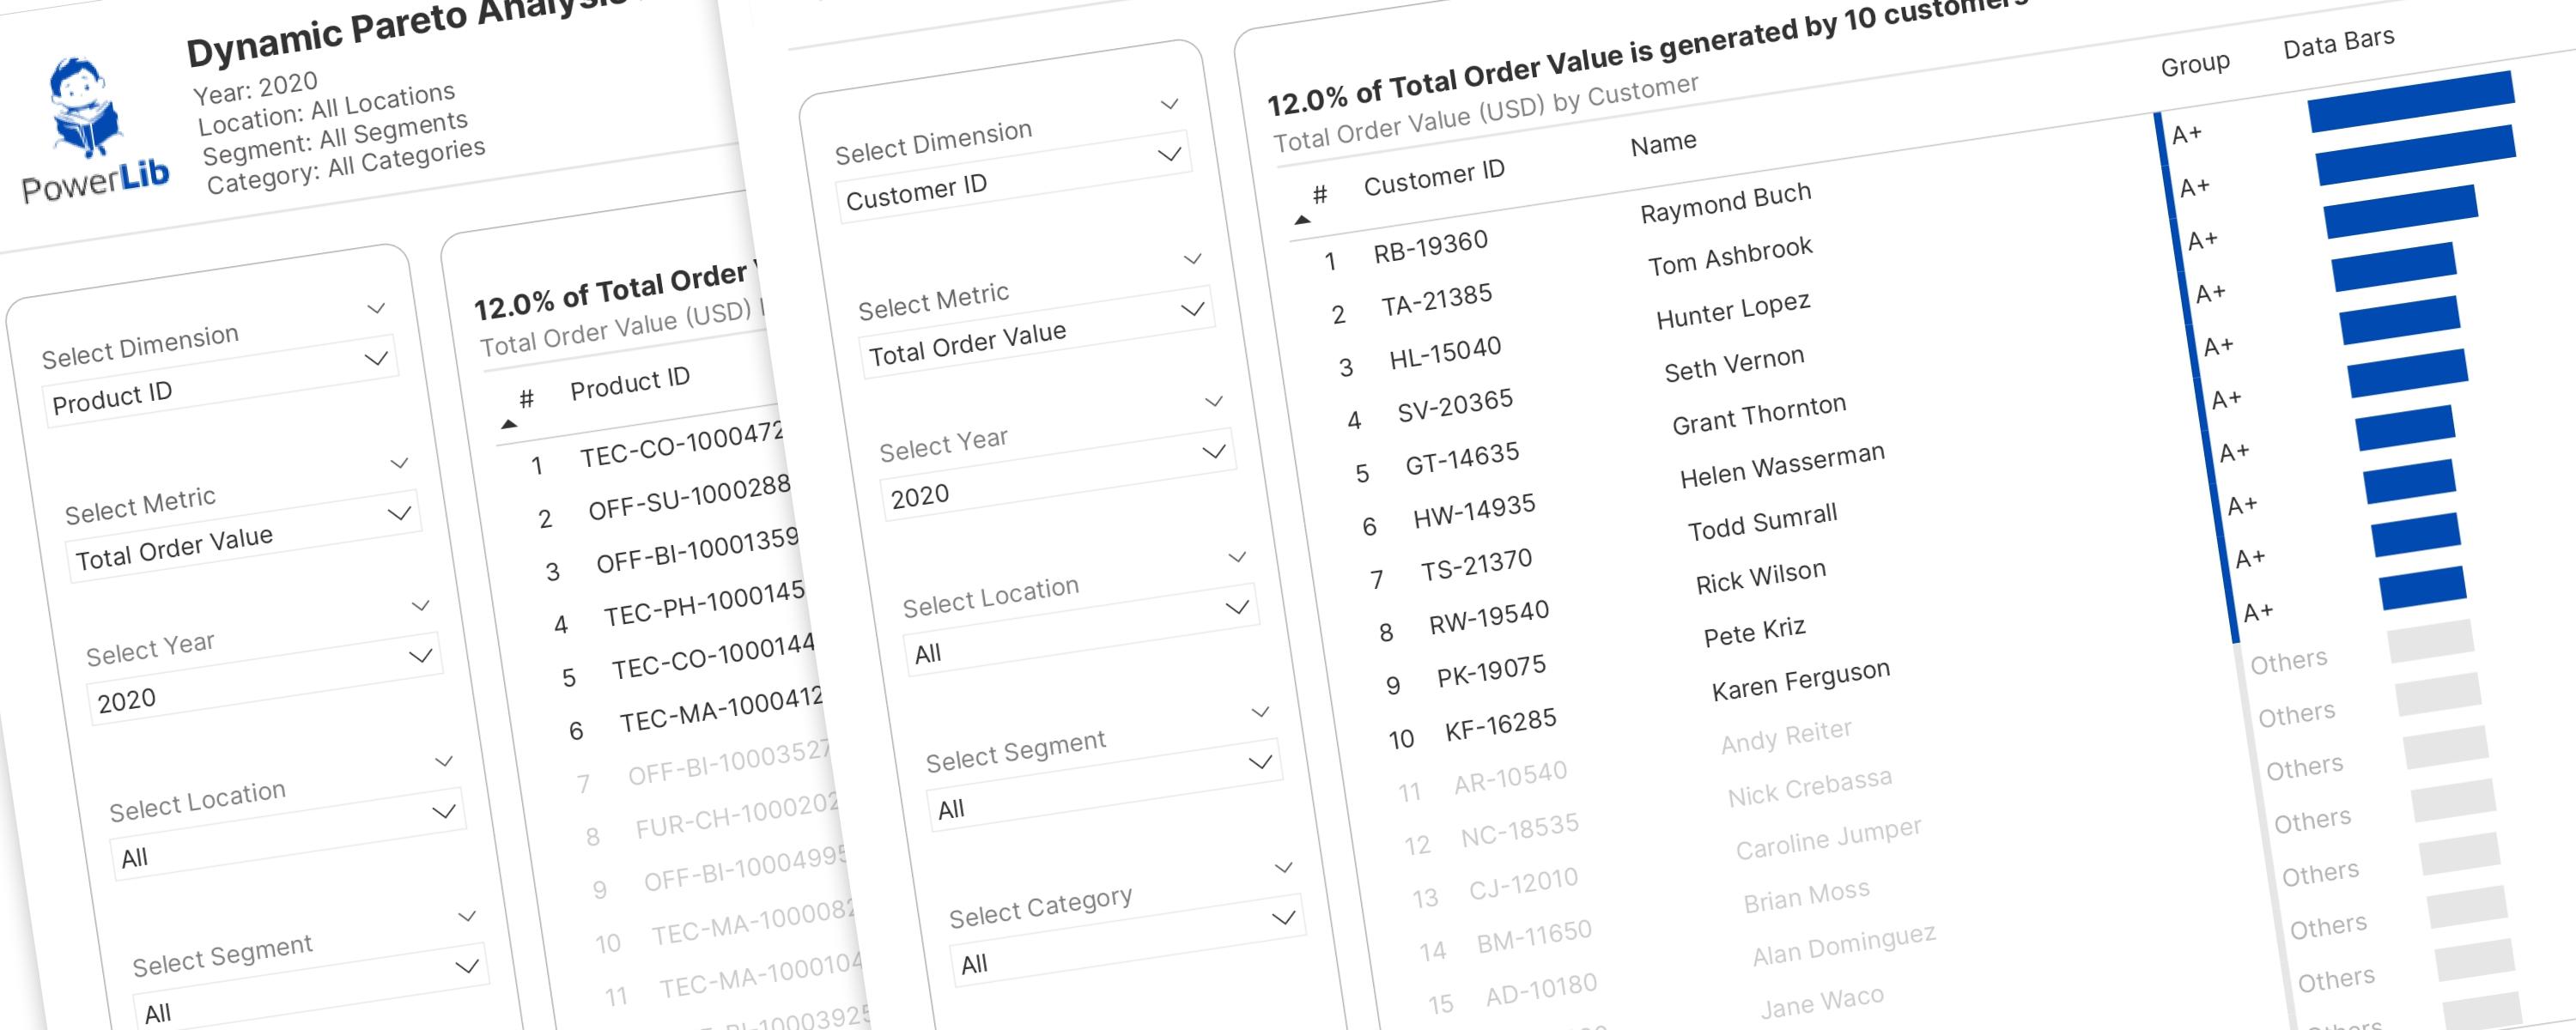
Matrix/TableMember-Only
RETURN SWITCH( SelectedVariableOrder, -- When Customer dimension is selected (Order = 0) 0, CALCULATE( [03 Dynamic Selected Metric], ALLSELECTED('DimCustomer') ), -- When Product…