Foreword
Understanding Pareto Principle
What is the Pareto Principle (The 80/20 Rule)?
Imagine you have a big pile of something – let's say, 100 colorful building blocks. The Pareto Principle suggests that if you were to count how many of those blocks are truly important for building your best tower, you'd find something interesting:
-
About 20% of the blocks (the "important few") would be used to build 80% of the height or strength of your tower.
-
The other 80% of the blocks (the "many less important ones") would only contribute to about 20% of the tower's overall impact.
So, it's not a strict math rule, but a general observation that a small number of things (causes) often create a big impact (results).
It's called the 80/20 Rule because that's the most common ratio, but it could be 70/30, 90/10, or something similar. The point is, it's uneven.
Applying the 80/20 Rule to Your Customers
Now, how does this help with understanding customers? It's super powerful for businesses because it helps you figure out where to put your energy.
Think of your customers like those building blocks. If you have 100 customers:
-
Finding Your "Star" Customers:
- The Idea: Roughly 20% of your customers are likely bringing in about 80% of your total sales (or profits).
- How to do it:
- Look at your sales records.
- Sort your customers from the ones who spend the most down to the ones who spend the least.
- Then, just visually or by calculation, find the group of customers (likely around 20% of them) that collectively make up about 80% of your total money.
- What this tells you: These are your VIPs! They are the most crucial for your business's survival. You should treat them extra well, offer them special perks, listen to their feedback, and make sure they stay happy. Losing one of these "star" customers hurts much more than losing one of the others.
-
Popular Products:
- The Idea: About 20% of your products or services probably make up 80% of your sales.
- How to do it: Look at which products sell the most.
- What this tells you: These are your cash cows. Make sure you always have them in stock, promote them heavily, and consider improving them further.
-
Solving Customer Problems:
- The Idea: If customers are complaining, roughly 20% of the types of complaints are causing 80% of all the actual complaints you receive.
- How to do it: Track what customers are complaining about. Group similar complaints together.
- What this tells you: Instead of trying to fix every tiny complaint, focus on fixing those top 20% of types of complaints. If you solve those few big issues, you'll dramatically reduce customer unhappiness overall.
-
Effective Marketing:
- The Idea: About 20% of your advertising efforts or marketing channels are bringing in 80% of your new customers.
- How to do it: See which ads or marketing methods are actually getting you the most new business.
- What this tells you: Don't spread your marketing budget too thin. Pour more money and effort into the few channels that are really working, and scale back on the less effective ones.
The Big Takeaway: Focus Your Energy Smartly!
The Pareto Principle for customers (and business in general) is all about smart focus.
Instead of treating everyone or everything equally, it helps you identify the "vital few" (the 20% that matter most) versus the "trivial many" (the 80% that matter less).
By identifying these key areas, you can:
-
Save Time & Money: Don't waste resources on things that don't give much back.
-
Boost Profits: By nurturing your best customers and products, your income will grow.
-
Make Customers Happier: Solve the biggest problems for the most people.
It's a simple idea, but incredibly powerful for making better business decisions.
DAX Measures
Base Measures
Total Revenue (Total Order Value)
_01 Total Revenue = SUM(Superstore[Sales])Total Quantity
_01 Total Quantity = SUM(Superstore[Quantity])Total Profit
_01 Total Profit = SUM(Superstore[Profit])Total Customers
AC Total Customers
_01 Total Customers = DISTINCTCOUNT(Superstore[Customer ID])PY Total Customers
_02 PY Total Customers =
IF(
  HASONEVALUE(DimDate[Year]),
  CALCULATE(
      [_01 Total Customers],
      SAMEPERIODLASTYEAR(DimDate[Date])
  ),
  BLANK()
)
△PY Total Customers
_03 △PY Total Customers =
IF(
  HASONEVALUE(DimDate[Year])
  && NOT(ISBLANK([_02 PY Total Customers]))
  && NOT(ISBLANK([_01 Total Customers]))
  && [_01 Total Customers] <> 0,
  [_01 Total Customers] - [_02 PY Total Customers],
  BLANK()
)
△PY% Total Customers
_04 △PY% Total Customers =
IF(
  ISBLANK([_01 Total Customers]) || [_01 Total Customers] = 0,
  "--",
  DIVIDE([_01 Total Customers] - [_02 PY Total Customers], [_02 PY Total Customers], 0)
)
CF_△PY Total Customers
CF_△PY Total Customers =
SWITCH(
  TRUE(),
  [_03 △PY Total Customers] > 0, "#6A994E",
  [_03 △PY Total Customers] = 0, "#808080",
  "#BC4749"
)
CF_△PY% Total Customers
CF_△PY% Dynamic Selected Metric =
SWITCH(
  TRUE(),
  [_04 △PY% Dynamic Selected Metric] > 0, "#6A994E",
  [_04 △PY% Dynamic Selected Metric] = 0, "#808080",
  "#BC4749"
)
Disconnected Table - Selected Metric
Selected Metric =
DATATABLE (
  "Measure", STRING,
  "Order", INTEGER,
  {
      {"Total Order Value", 1},
      {"Total Items", 2},
      {"Total Profit", 3}
  }
)
Pareto Split Category Table
Pareto_Split_Category =
VAR CustomerBase =
  SELECTCOLUMNS(
      'Table_RFM Analysis',
      "Customer Name", 'Table_RFM Analysis'[Customer Name],
      "Customer ID", 'Table_RFM Analysis'[Customer ID]
  )
RETURN
UNION(
  ADDCOLUMNS(CustomerBase, "Category", "A+"),
  ADDCOLUMNS(CustomerBase, "Category", "Others")
)
Dynamic Selected Metric
_02 Dynamic Selected Metric =
VAR SelectedMeasure = SELECTEDVALUE('Selected Metric'[Measure])
RETURN
  SWITCH(
      SelectedMeasure,
      "Total Order Value", [_01 Total Revenue],
      "Total Items", [_01 Total Quantity],
      "Total Profit", [_01 Total Profit],
      BLANK()
  )
Dynamic Rank (based on selected metric)
_02 Dynamic Rank (based on selected metric) =
IF(
  ISINSCOPE('Pareto_Split_Category'[Customer Name]) &&
  NOT ISBLANK([_02 Dynamic Selected Metric]),

  RANKX(
      ALL('Pareto_Split_Category'[Customer ID], 'Pareto_Split_Category'[Customer Name]),
      [_02 Dynamic Selected Metric] * 10000000 + CALCULATE(SUM('Pareto_Split_Category'[Customer ID_Number])),
      ,
      DESC,
      DENSE
  ),
  BLANK()
)
Total Dynamic Selected Metric
_02 Total Dynamic Selected Metric =
CALCULATE(
  [_02 Dynamic Selected Metric],
  ALLSELECTED('Pareto_Split_Category')
)
% of Grand Total of Dynamic Selected Metric
_02 GT%_Dynamic Selected Metric =
DIVIDE(
  [_02 Dynamic Selected Metric],
  [_02 Total Dynamic Selected Metric],
  0
)
Cumulative Value by Dynamic Rank
_02 Cumulative Value by Dynamic Rank =
VAR CurrentRank = [_02 Dynamic Rank (based on selected metric)]
VAR IsTotal = ISINSCOPE('Pareto_Split_Category'[Customer Name]) = FALSE()

RETURN
IF(
  IsTotal,
  BLANK(),  -- Hide the total row
  IF(
      NOT ISBLANK(CurrentRank),
      SUMX(
          FILTER(
              ALL('Pareto_Split_Category'[Customer Name], 'Pareto_Split_Category'[Customer ID]),
              CALCULATE([_02 Dynamic Rank (based on selected metric)]) <= CurrentRank
          ),
          CALCULATE([_02 Dynamic Selected Metric])
      )
  )
)
% of Cumulative Value by Dynamic Rank
_02 % Cumulative Value by Dynamic Rank =
VAR CumulativeValue = [_02 Cumulative Value by Dynamic Rank]
VAR TotalValue = [_02 Total Dynamic Selected Metric]
VAR IsTotal = ISINSCOPE('Pareto_Split_Category'[Customer Name]) = FALSE()
RETURN
IF(
  IsTotal,
  BLANK(), // Hide the total row
  IF(
      NOT ISBLANK(CumulativeValue) && NOT ISBLANK(TotalValue) && TotalValue <> 0,
      CumulativeValue / TotalValue,
      BLANK()
  )
)
Cutoff Customer Pareto Segment
_02 Cutoff_Customer Pareto Segment =
VAR ParetoThreshold = [Pareto Value]  -- e.g., 0.15 for 15%
VAR CumulativePct = [_02 % Cumulative Value by Dynamic Rank]  -- your cumulative % measure
VAR IsTotal = ISINSCOPE('Pareto_Split_Category'[Customer Name]) = FALSE()  -- Check if at total level
RETURN
IF(
  IsTotal,
  BLANK(),  -- Hide ONLY the total row
  IF(
      NOT ISBLANK(CumulativePct),
      IF(CumulativePct <= ParetoThreshold, "A+", "Others"),
      BLANK()
  )
)
Pareto Filter
_02 Simple_Pareto_Filter =
VAR CurrentGroup = SELECTEDVALUE('Pareto_Split_Category'[Group])
VAR CustomerSegment = [_02 Cutoff_Customer Pareto Segment]
RETURN
IF(
  ISINSCOPE('Pareto_Split_Category'[Customer Name]) &&
  NOT ISBLANK(CustomerSegment) &&
  CurrentGroup = CustomerSegment,
  1,
  0
)
SVG Pareto Bar Charts
SVG Pareto Bar Chart - Total Order Value
_02 SVG Pareto Bar Chart_Total Order Value =
VAR IsTotal = ISINSCOPE('Pareto_Split_Category'[Customer Name]) = FALSE

VAR MaxOrderValue = CALCULATE(
  MAXX(
      ALL('Pareto_Split_Category'[Customer ID], 'Pareto_Split_Category'[Customer Name]),
      [_02 Total Order Value]
  )
)

VAR Bar_Value = [_02 Total Order Value]
VAR NormalizedValue = DIVIDE(Bar_Value, MaxOrderValue)
VAR Bar_Fill = NormalizedValue * 200

-- Get the group from your cutoff measure
VAR CustomerGroup = [_02 Cutoff_Customer Pareto Segment]

-- Set color based on group
VAR Bar_Color =
  IF(
      CustomerGroup = "A+",
      "#024AB2",  -- Blue for A+ group
      "#E6E6E6"   -- Light gray for others
  )

VAR SVG_Data_URL = "data:image/svg+xml;utf8,"
VAR SVG_Start = "<svg xmlns='http://www.w3.org/2000/svg' viewBox='0 0 200 25'>"
VAR SVG_Data = "<rect fill='" & Bar_Color & "' x='0' y='0' width='" & Bar_Fill & "' height='25' />"
VAR SVG_End = "</svg>"

RETURN
IF(
  IsTotal,
  BLANK(),
  SVG_Data_URL & SVG_Start & SVG_Data & SVG_End
)
SVG Pareto Bar Chart - Quantity
_02 SVG Pareto Bar Chart_Total Quantity =
VAR IsTotal = ISINSCOPE('Pareto_Split_Category'[Customer Name]) = FALSE

VAR MaxQuantity = CALCULATE(
  MAXX(
      ALL('Pareto_Split_Category'[Customer ID], 'Pareto_Split_Category'[Customer Name]),
      [_02 Total Quantity]
  )
)

VAR Bar_Value = [_02 Total Quantity]
VAR NormalizedValue = DIVIDE(Bar_Value, MaxQuantity)
VAR Bar_Fill = NormalizedValue * 200

-- Get the group from your cutoff measure
VAR CustomerGroup = [_02 Cutoff_Customer Pareto Segment]

-- Set color based on group
VAR Bar_Color =
  IF(
      CustomerGroup = "A+",
      "#024AB2",  -- Blue for A+ group
      "#E6E6E6"   -- Light gray for others
  )

VAR SVG_Data_URL = "data:image/svg+xml;utf8,"
VAR SVG_Start = "<svg xmlns='http://www.w3.org/2000/svg' viewBox='0 0 200 25'>"
VAR SVG_Data = "<rect fill='" & Bar_Color & "' x='0' y='0' width='" & Bar_Fill & "' height='25' />"
VAR SVG_End = "</svg>"

RETURN
IF(
  IsTotal,
  BLANK(),
  SVG_Data_URL & SVG_Start & SVG_Data & SVG_End
)
SVG Pareto Bar Chart - Total Profit
_02 SVG Pareto Bar Chart_Total Profit =
VAR IsTotal = ISINSCOPE('Pareto_Split_Category'[Customer Name]) = FALSE

-- SVG dimensions
VAR TotalWidth = 200
VAR HalfWidth = TotalWidth / 2
VAR Height = 25

-- Max absolute profit to scale both directions
VAR MaxAbsProfit = CALCULATE(
  MAXX(
      ALL('Pareto_Split_Category'[Customer ID], 'Pareto_Split_Category'[Customer Name]),
      ABS([_02 Total Profit])
  )
)

-- Actual profit value
VAR Bar_Value = [_02 Total Profit]

-- Normalized bar width
VAR NormalizedWidth = DIVIDE(ABS(Bar_Value), MaxAbsProfit) * HalfWidth

-- Bar position
VAR Bar_X = IF(Bar_Value >= 0, HalfWidth, HalfWidth - NormalizedWidth)

-- Get the group from cutoff measure
VAR CustomerGroup = [_02 Cutoff_Customer Pareto Segment]

-- Set color based on profit sign and group
VAR FillColor =
  SWITCH(
      TRUE(),
      CustomerGroup = "A+" && Bar_Value >= 0, "#6A994E",    -- strong green
      CustomerGroup = "A+" && Bar_Value < 0,  "#BC4749",    -- strong red
      CustomerGroup <> "A+" && Bar_Value >= 0, "#B5CCA7",   -- light green
      CustomerGroup <> "A+" && Bar_Value < 0,  "#DEA3A4",   -- light red
      "#CCCCCC"  -- fallback (shouldn't happen)
  )

-- SVG structure
VAR SVG_Data_URL = "data:image/svg+xml;utf8,"
VAR SVG_Start = "<svg xmlns='http://www.w3.org/2000/svg' viewBox='0 0 " & TotalWidth & " " & Height & "'>"
-- Zero axis line (vertical center)
VAR Zero_Axis = "<line x1='" & HalfWidth & "' y1='0' x2='" & HalfWidth & "' y2='" & Height & "' stroke='#888888' stroke-width='1' />"
-- Bar rectangle
VAR SVG_Bar = "<rect fill='" & FillColor & "' x='" & Bar_X & "' y='0' width='" & NormalizedWidth & "' height='" & Height & "' />"
VAR SVG_End = "</svg>"

RETURN
IF(
  IsTotal,
  BLANK(),
  SVG_Data_URL & SVG_Start & Zero_Axis & SVG_Bar & SVG_End
)
Dynamic Selected SVG Bars
_02 Dynamic Selected SVG Bars =
VAR SelectedMeasure = SELECTEDVALUE('Sort By'[Measure])
VAR SVGResult =
  SWITCH(
      SelectedMeasure,
      "Total Order Value", [_02 SVG Pareto Bar Chart_Total Order Value],
      "Total Items", [_02 SVG Pareto Bar Chart_Total Quantity],
      "Total Profit", [_02 SVG Pareto Bar Chart_Total Profit],
      BLANK()
  )
RETURN
  IF(ISBLANK(SVGResult), BLANK(), SVGResult & "")
Pareto Highlight Bars
Pareto highlight bars = BLANK()Pareto Color Formatting (for Bar Highlight)
_02 Pareto Color Formatting =
VAR IsTotal = ISINSCOPE('Pareto_Split_Category'[Customer Name]) = FALSE()
VAR CurrentRank = [_02 Dynamic Rank (based on selected metric)]
VAR ParetoThreshold = [Pareto Value]  -- e.g., 0.15 for 15%
VAR CumulativePct = [_02 % Cumulative Value by Dynamic Rank]

RETURN
IF(
  IsTotal,
  "#FFFFFF",  -- White for totals/subtotals
  IF(
      NOT ISBLANK(CurrentRank) && NOT ISBLANK(CumulativePct),
      IF(
          CumulativePct <= ParetoThreshold,
          "#024AB2",  -- Blue for ranks within A+ threshold
          "#E6E6E6"   -- Light gray for ranks in Others group
      ),
      "#E6E6E6"   -- Default light gray for undefined cases
  )
)
Rank Color Formatting (for Font Highlight)
_02 Rank Font Color Formatting =
VAR IsTotal = ISINSCOPE('Pareto_Split_Category'[Customer Name]) = FALSE()
VAR CurrentRank = [_02 Dynamic Rank (based on selected metric)]
VAR ParetoThreshold = [Pareto Value]  -- e.g., 0.15 for 15%
VAR CumulativePct = [_02 % Cumulative Value by Dynamic Rank]

RETURN
IF(
  IsTotal,
  "#FFFFFF",  -- White for totals/subtotals
  IF(
      NOT ISBLANK(CurrentRank) && NOT ISBLANK(CumulativePct),
      IF(
          CumulativePct <= ParetoThreshold,
          "#323232",  -- Black for ranks within A+ threshold
          "#B3B3B3"   -- Light gray for ranks in Others group
      ),
      "#B3B3B3"   -- Default light gray for undefined cases
  )
)
Customer Segment (Hide the Total)
Customer Segment (No Total) =
IF (
  ISINSCOPE(Pareto_Split_Category[Customer Name]),
  VALUES('Table_RFM Analysis'[Customer Segment]),
  BLANK()
)
Dynamic Text/Subtitle Displaying Filter Selections
_02 Dynamic Text/Subtitle (Multi-Select) =
-- Configuration constants
VAR LineBreak = UNICHAR(10)
VAR ExcludeThreshold = 3  -- Show "excluding" format when 3 or fewer items are unselected
VAR MaxDisplayItems = 4   -- Maximum items to show before truncating with "and X more"

-- Location filtering logic with enhanced length management
VAR IsRegionFiltered = ISFILTERED('Superstore'[Region])
VAR IsStateFiltered = ISFILTERED('Superstore'[State])

VAR SelectedLocation =
  IF(IsRegionFiltered,
      -- Region is filtered, check state logic
      IF(IsStateFiltered,
          -- Both Region and State are filtered
          VAR AllStatesInRegion = CALCULATETABLE(
              VALUES('Superstore'[State]),
              ALLEXCEPT('Superstore', 'Superstore'[Region])
          )
          VAR SelectedStates = VALUES('Superstore'[State])
          VAR UnselectedStates = EXCEPT(AllStatesInRegion, SelectedStates)
          VAR UnselectedStateCount = COUNTROWS(UnselectedStates)
          VAR TotalStatesInRegion = COUNTROWS(AllStatesInRegion)
          VAR SelectedStateCount = COUNTROWS(SelectedStates)
          VAR SelectedRegion = CONCATENATEX(VALUES('Superstore'[Region]), 'Superstore'[Region], ", ")

          VAR LocationResult =
              IF(UnselectedStateCount = 0,
                  -- All states selected, show only region
                  SelectedRegion,
                  IF(UnselectedStateCount <= ExcludeThreshold && UnselectedStateCount < TotalStatesInRegion,
                      -- Few states unselected, show "excluding" format
                      SelectedRegion & " (excluding " & CONCATENATEX(UnselectedStates, 'Superstore'[State], ", ") & ")",
                      -- Many states unselected, check if we should truncate selected states
                      IF(SelectedStateCount <= MaxDisplayItems,
                          -- Show all selected states
                          SelectedRegion & " - " & CONCATENATEX(SelectedStates, 'Superstore'[State], ", "),
                          -- Truncate with "and X more" format
                          VAR FirstStates = CONCATENATEX(
                              TOPN(MaxDisplayItems, SelectedStates, 'Superstore'[State], ASC),
                              'Superstore'[State], ", "
                          )
                          VAR RemainingCount = SelectedStateCount - MaxDisplayItems
                          RETURN SelectedRegion & " - " & FirstStates & " and " & RemainingCount & " more"
                      )
                  )
              )
          RETURN LocationResult,

          -- Only Region filtered
          VAR SelectedRegionCount = COUNTROWS(VALUES('Superstore'[Region]))
          VAR RegionText = CONCATENATEX(VALUES('Superstore'[Region]), 'Superstore'[Region], ", ")
          RETURN
              IF(SelectedRegionCount <= MaxDisplayItems,
                  RegionText,
                  VAR FirstRegions = CONCATENATEX(
                      TOPN(MaxDisplayItems, VALUES('Superstore'[Region]), 'Superstore'[Region], ASC),
                      'Superstore'[Region], ", "
                  )
                  VAR RemainingRegions = SelectedRegionCount - MaxDisplayItems
                  RETURN FirstRegions & " and " & RemainingRegions & " more"
              )
      ),
      IF(IsStateFiltered,
          -- Only State filtered
          VAR SelectedStateCount = COUNTROWS(VALUES('Superstore'[State]))
          VAR StateText = CONCATENATEX(VALUES('Superstore'[State]), 'Superstore'[State], ", ")
          RETURN
              IF(SelectedStateCount <= MaxDisplayItems,
                  StateText,
                  VAR FirstStates = CONCATENATEX(
                      TOPN(MaxDisplayItems, VALUES('Superstore'[State]), 'Superstore'[State], ASC),
                      'Superstore'[State], ", "
                  )
                  VAR RemainingStates = SelectedStateCount - MaxDisplayItems
                  RETURN FirstStates & " and " & RemainingStates & " more"
              ),

          -- No location filter
          "All Locations"
      )
  )

-- Segment filtering logic (simple, no sub-segments)
VAR IsSegmentFiltered = ISFILTERED('Superstore'[Segment])
VAR SelectedSegment =
  IF(IsSegmentFiltered,
      VAR SelectedSegmentCount = COUNTROWS(VALUES('Superstore'[Segment]))
      VAR SegmentText = CONCATENATEX(VALUES('Superstore'[Segment]), 'Superstore'[Segment], ", ")
      RETURN
          IF(SelectedSegmentCount <= MaxDisplayItems,
              SegmentText,
              VAR FirstSegments = CONCATENATEX(
                  TOPN(MaxDisplayItems, VALUES('Superstore'[Segment]), 'Superstore'[Segment], ASC),
                  'Superstore'[Segment], ", "
              )
              VAR RemainingSegments = SelectedSegmentCount - MaxDisplayItems
              RETURN FirstSegments & " and " & RemainingSegments & " more"
          ),
      "All Segments"
  )

-- Category filtering logic with enhanced length management
VAR IsCategoryFiltered = ISFILTERED('Superstore'[Category])
VAR IsSubCategoryFiltered = ISFILTERED('Superstore'[Sub-Category])

VAR SelectedCategory =
  IF(IsCategoryFiltered,
      -- Category is filtered, check sub-category logic
      IF(IsSubCategoryFiltered,
          -- Both Category and Sub-Category are filtered
          VAR AllSubCategoriesInCategory = CALCULATETABLE(
              VALUES('Superstore'[Sub-Category]),
              ALLEXCEPT('Superstore', 'Superstore'[Category])
          )
          VAR SelectedSubCategories = VALUES('Superstore'[Sub-Category])
          VAR UnselectedSubCategories = EXCEPT(AllSubCategoriesInCategory, SelectedSubCategories)
          VAR UnselectedSubCount = COUNTROWS(UnselectedSubCategories)
          VAR TotalSubCategoriesInCategory = COUNTROWS(AllSubCategoriesInCategory)
          VAR SelectedSubCount = COUNTROWS(SelectedSubCategories)
          VAR SelectedCategoryText = CONCATENATEX(VALUES('Superstore'[Category]), 'Superstore'[Category], ", ")

          VAR CategoryResult =
              IF(UnselectedSubCount = 0,
                  -- All sub-categories selected, show only category
                  SelectedCategoryText,
                  IF(UnselectedSubCount <= ExcludeThreshold && UnselectedSubCount < TotalSubCategoriesInCategory,
                      -- Few sub-categories unselected, show "excluding" format
                      SelectedCategoryText & " (excluding " & CONCATENATEX(UnselectedSubCategories, 'Superstore'[Sub-Category], ", ") & ")",
                      -- Many sub-categories unselected, check if we should truncate
                      IF(SelectedSubCount <= MaxDisplayItems,
                          -- Show all selected sub-categories
                          SelectedCategoryText & " - " & CONCATENATEX(SelectedSubCategories, 'Superstore'[Sub-Category], ", "),
                          -- Truncate with "and X more" format
                          VAR FirstSubCategories = CONCATENATEX(
                              TOPN(MaxDisplayItems, SelectedSubCategories, 'Superstore'[Sub-Category], ASC),
                              'Superstore'[Sub-Category], ", "
                          )
                          VAR RemainingSubCount = SelectedSubCount - MaxDisplayItems
                          RETURN SelectedCategoryText & " - " & FirstSubCategories & " and " & RemainingSubCount & " more"
                      )
                  )
              )
          RETURN CategoryResult,

          -- Only Category filtered
          VAR SelectedCategoryCount = COUNTROWS(VALUES('Superstore'[Category]))
          VAR CategoryText = CONCATENATEX(VALUES('Superstore'[Category]), 'Superstore'[Category], ", ")
          RETURN CategoryText
      ),
      IF(IsSubCategoryFiltered,
          -- Only Sub-Category filtered
          VAR SelectedSubCount = COUNTROWS(VALUES('Superstore'[Sub-Category]))
          VAR SubCategoryText = CONCATENATEX(VALUES('Superstore'[Sub-Category]), 'Superstore'[Sub-Category], ", ")
          RETURN
              IF(SelectedSubCount <= MaxDisplayItems,
                  SubCategoryText,
                  VAR FirstSubCategories = CONCATENATEX(
                      TOPN(MaxDisplayItems, VALUES('Superstore'[Sub-Category]), 'Superstore'[Sub-Category], ASC),
                      'Superstore'[Sub-Category], ", "
                  )
                  VAR RemainingSubCount = SelectedSubCount - MaxDisplayItems
                  RETURN FirstSubCategories & " and " & RemainingSubCount & " more"
              ),

          -- No category filter
          "All Categories"
      )
  )

-- Year filtering logic
VAR SelectedYear = SELECTEDVALUE(DimDate[Year], "All Years")

-- Return multi-line format consistently
RETURN
  "Year: " & SelectedYear & LineBreak &
  "Location: " & SelectedLocation & LineBreak &
  "Segment: " & SelectedSegment & LineBreak &
  "Category: " & SelectedCategory
Dynamic Matrix Title Displaying Number of Customers Within “A+” Group
_02 Pareto A+ Summary =
VAR ParetoThreshold = [Pareto Value]  -- e.g., 0.15 for 15%
VAR SelectedMeasureName = SELECTEDVALUE('Selected Metric'[Measure])

-- Calculate A+ customers count
VAR APlusCustomers =
  SUMX(
      FILTER(
          VALUES('Pareto_Split_Category'[Customer Name]),
          [_02 Cutoff_Customer Pareto Segment] = "A+"
      ),
      1
  )

-- Convert threshold to percentage for display
VAR ThresholdPercentage = ParetoThreshold * 100

-- Determine singular or plural form
VAR CustomerText = IF(APlusCustomers <= 1, "customer", "customers")

RETURN
IF(
  NOT ISBLANK(APlusCustomers) && APlusCustomers > 0,
  FORMAT(ThresholdPercentage, "0.0") & "% of " & SelectedMeasureName & " is generated by " & FORMAT(APlusCustomers, "#,0") & " " & CustomerText,
  BLANK()
)
Dynamic Matrix Subtitle Displaying Selected Metric from the Slicer
Documentation
Understanding the Underlying Principle
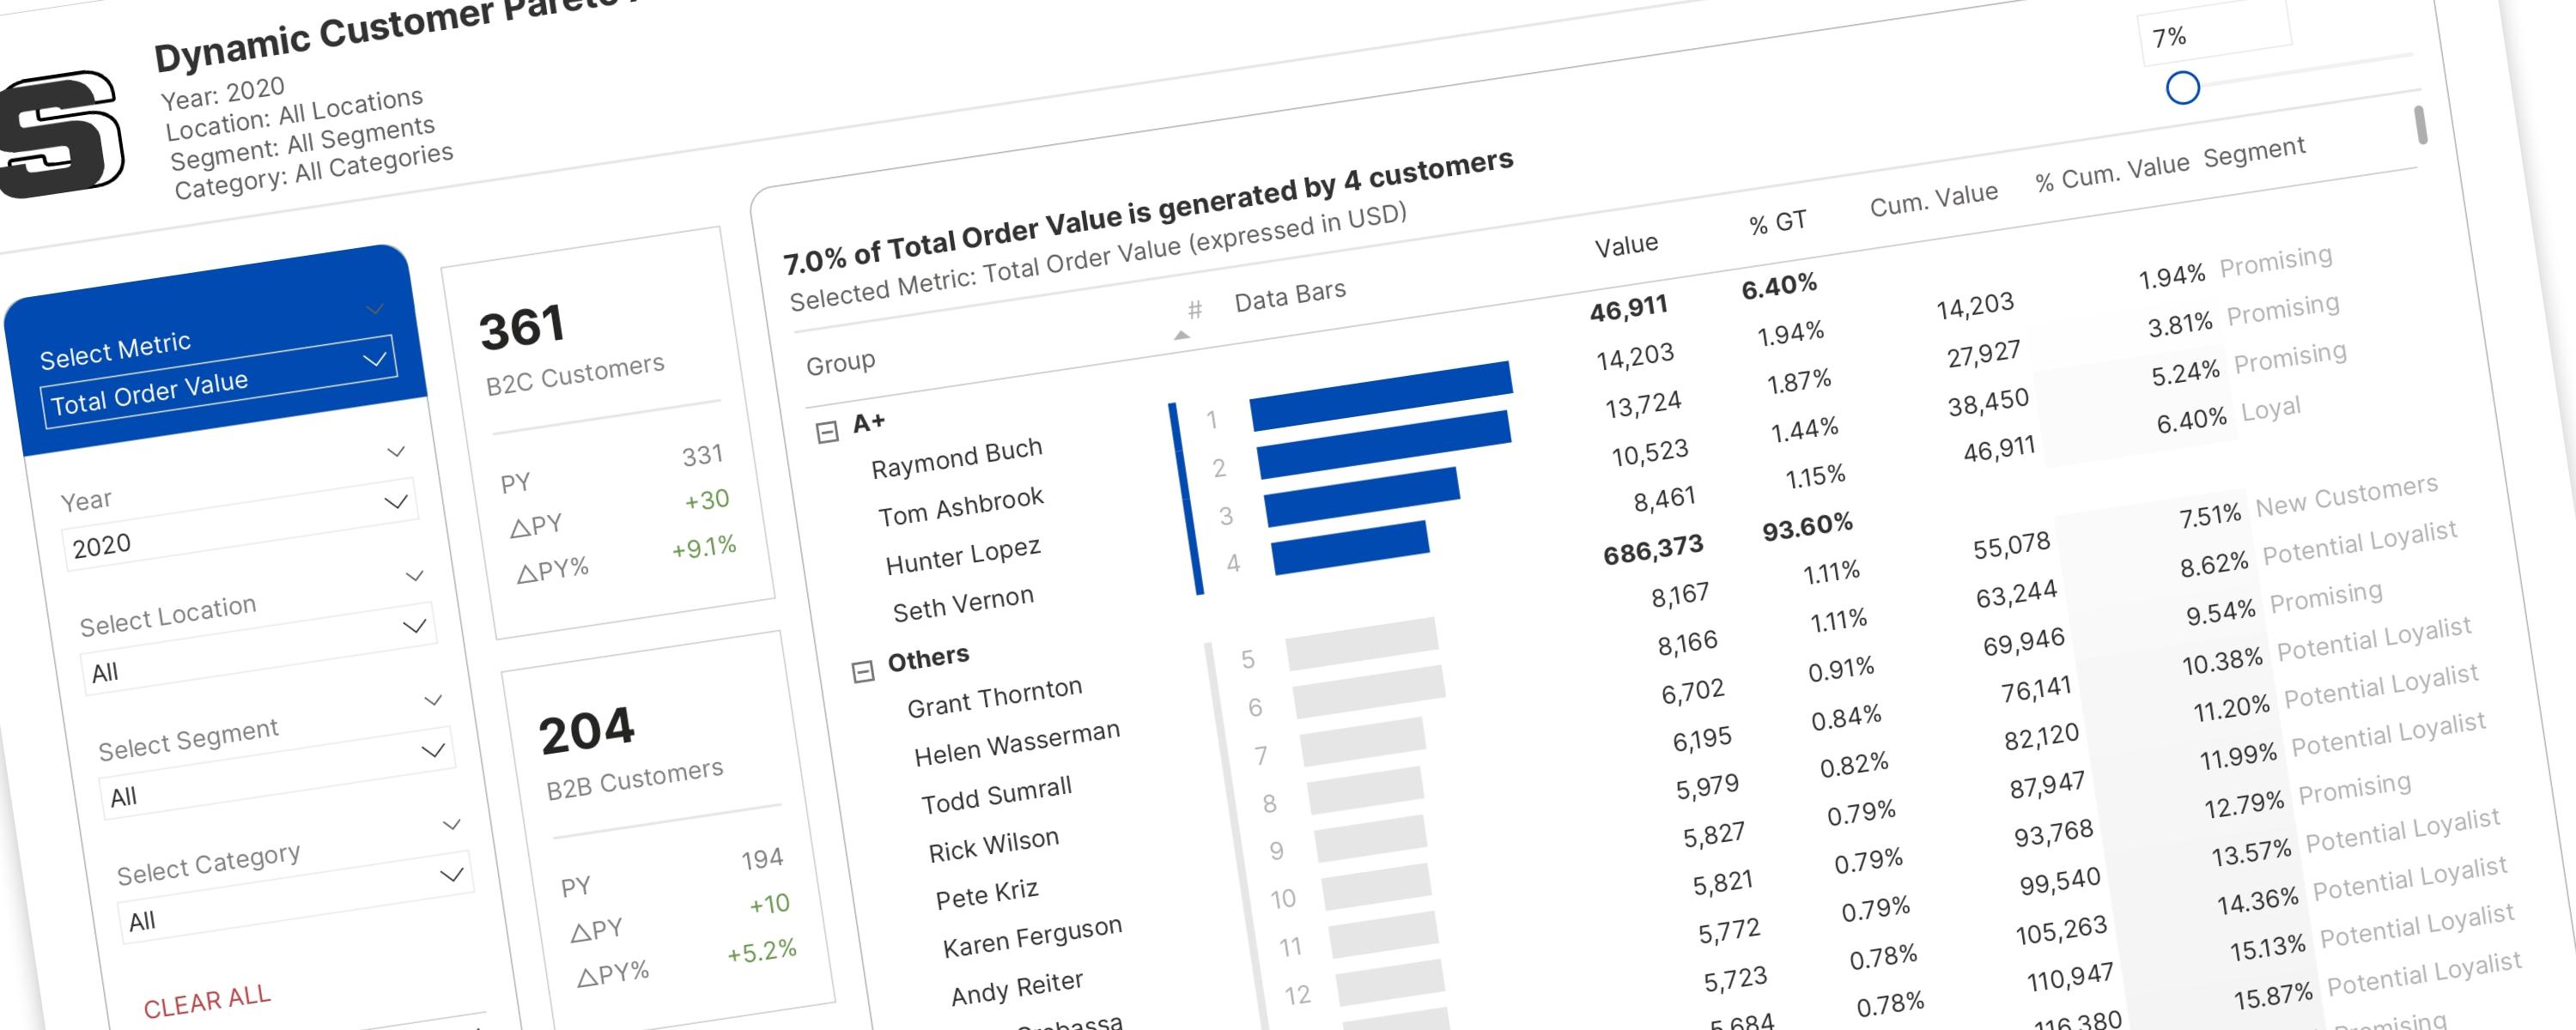
This approach works great for your matrix or table visuals. The core idea is simple: we want to categorize customers into two groups: “A+” for the “vital few” and “Others” for the “trivial many.” This helps us understand exactly who these high-contributing customers are and how many of them drive our company’s success.
How to Achieve This?
First, we need to rank our customers. But what’s the basis for this ranking? It’s all about your chosen metric. For example, if you want to rank customers by their total order value, the customers with the highest values will be at the top. To avoid duplicate ranks, we’ll also use a secondary criterion like customer IDs to ensure each customer gets a unique rank (more on this later in the article).
Once each customer has a rank, we need another variable to assign them to either the “A+” or “Other” group. This is where the percentage of cumulative value comes in. Let’s say we set our Pareto threshold at 20% using “Total Order Value” as our metric. Your matrix will then dynamically identify and group the top customers who collectively contribute to 20% of the total order value.
In this documentation, you'll learn to construct a dynamic customer Pareto dashboard. This powerful tool will enable you to analyze your company's "vital few" and "trivial many" customers based on a selected metric and an adjustable threshold.
Watch the tutorial: