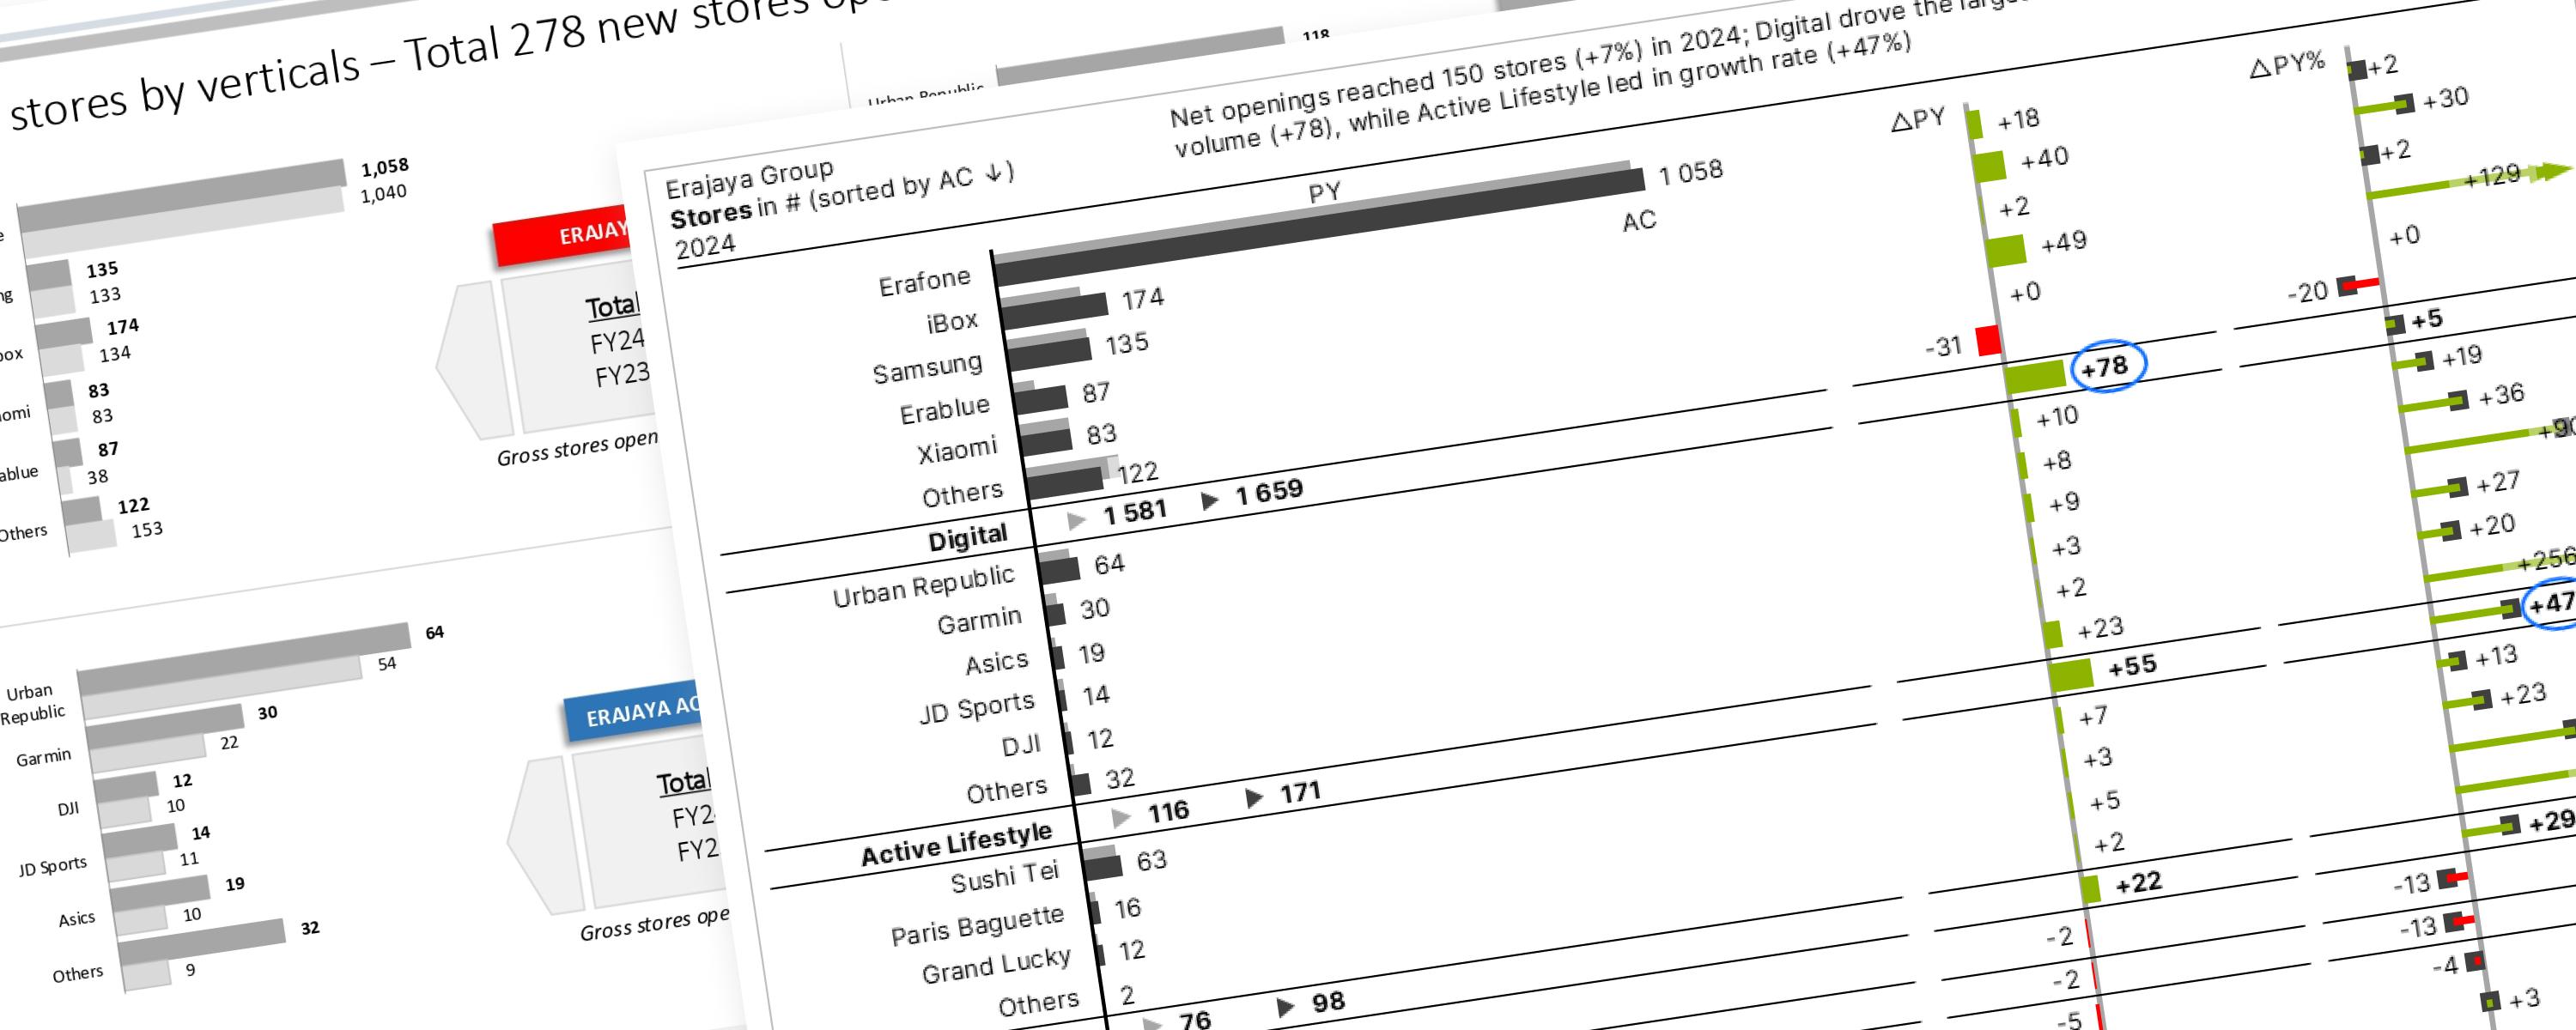
BarFree
Report Redesign with IBCS (Case Study 1)
This section focuses on using the core IBCS principles to redesign (makeover) various public company reports.
8 December 202538 min read
Documented Power BI techniques — the model change, the DAX, and the exact visual settings. Most are free to read; the rest come with the model files for members.
BarFree
This section focuses on using the core IBCS principles to redesign (makeover) various public company reports.
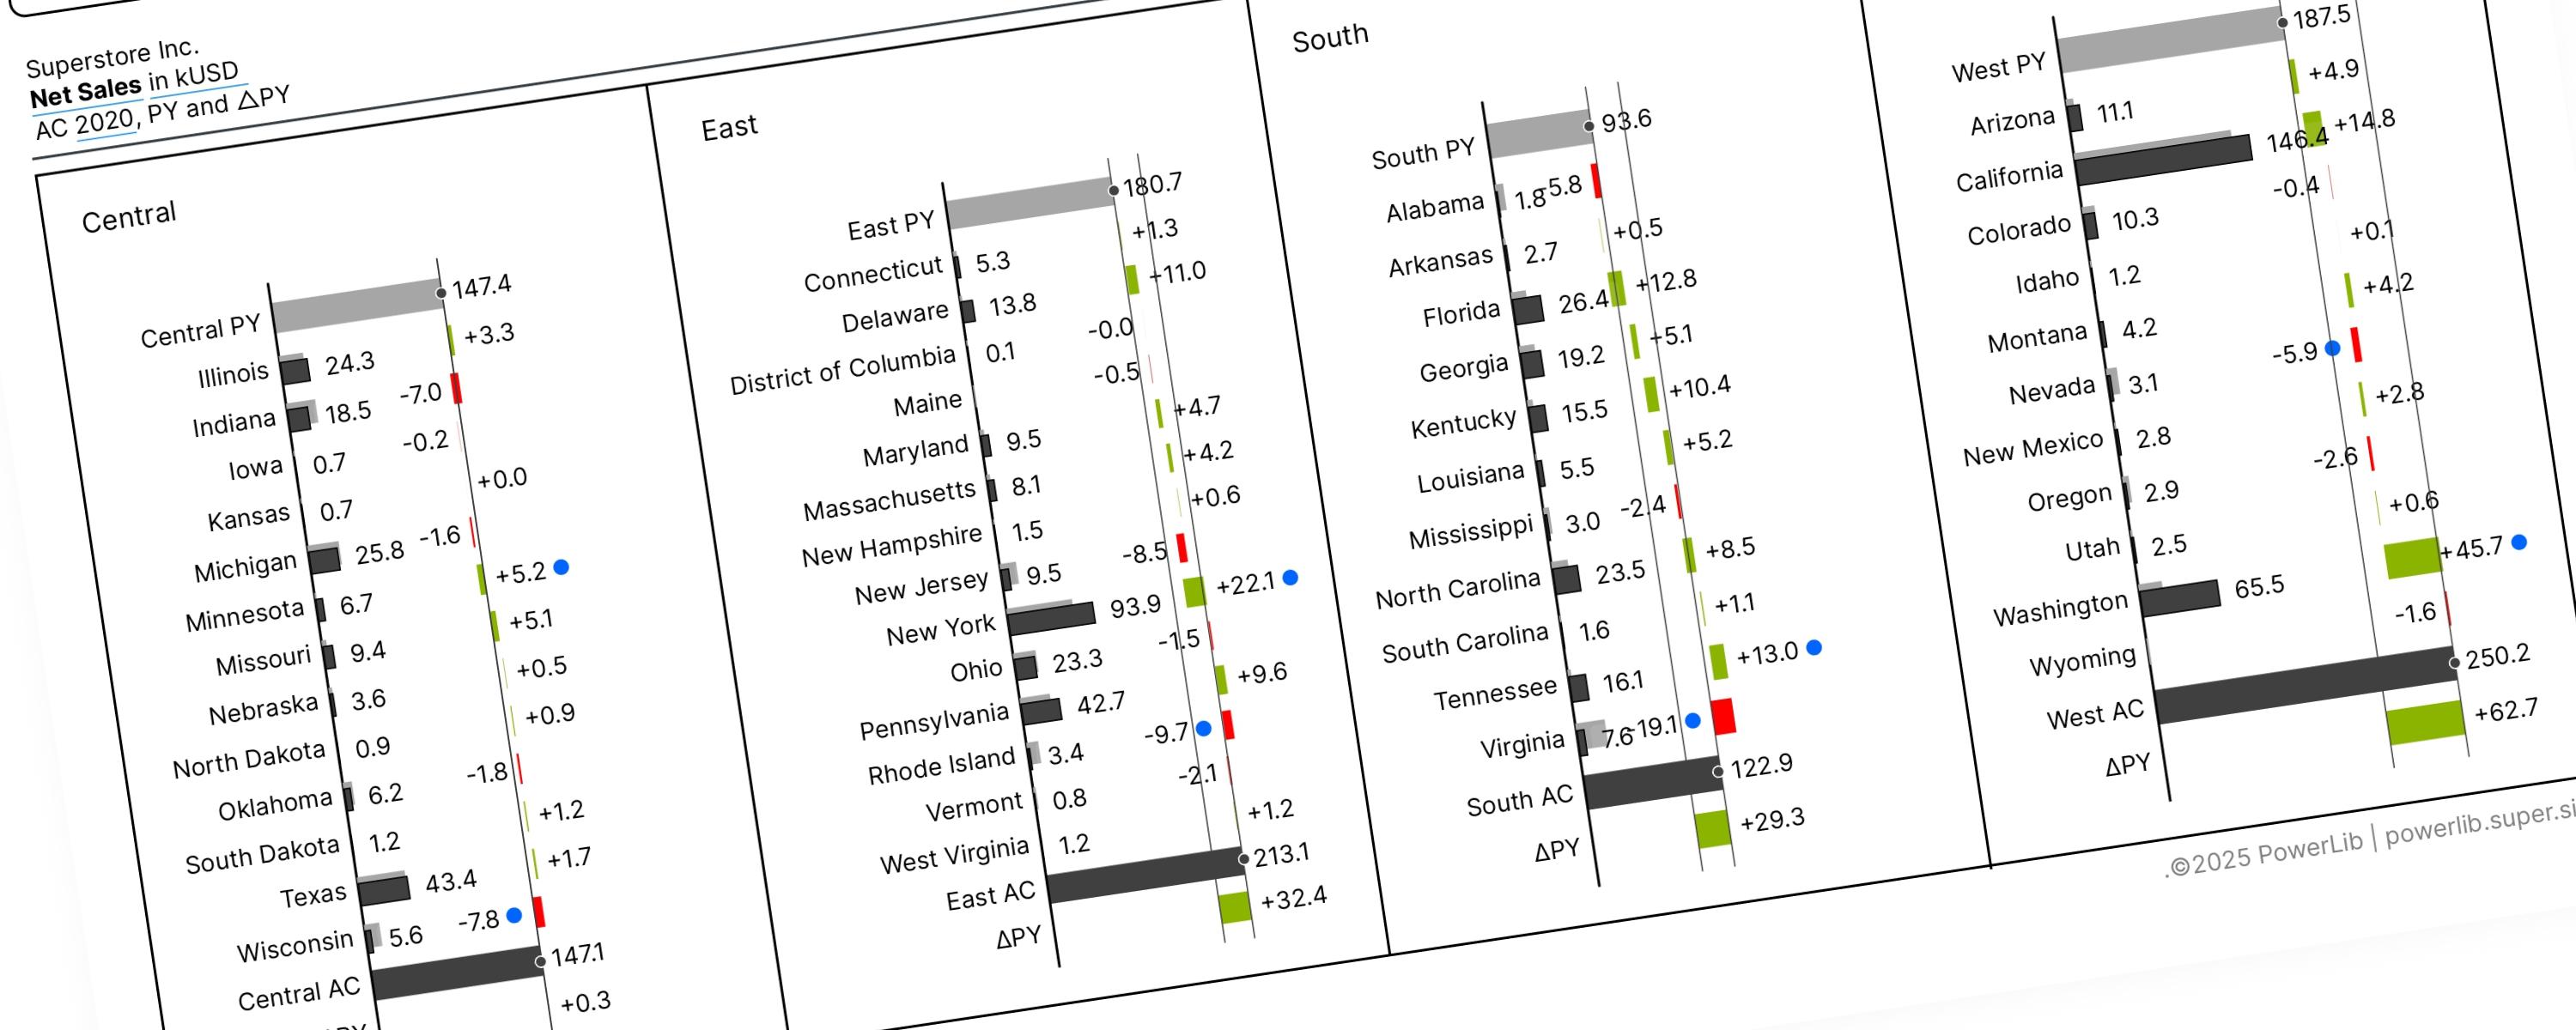
WaterfallMember-Only
A Vertical Waterfall Chart is a way to clearly show why two numbers are different by breaking down the changes that happened in between.
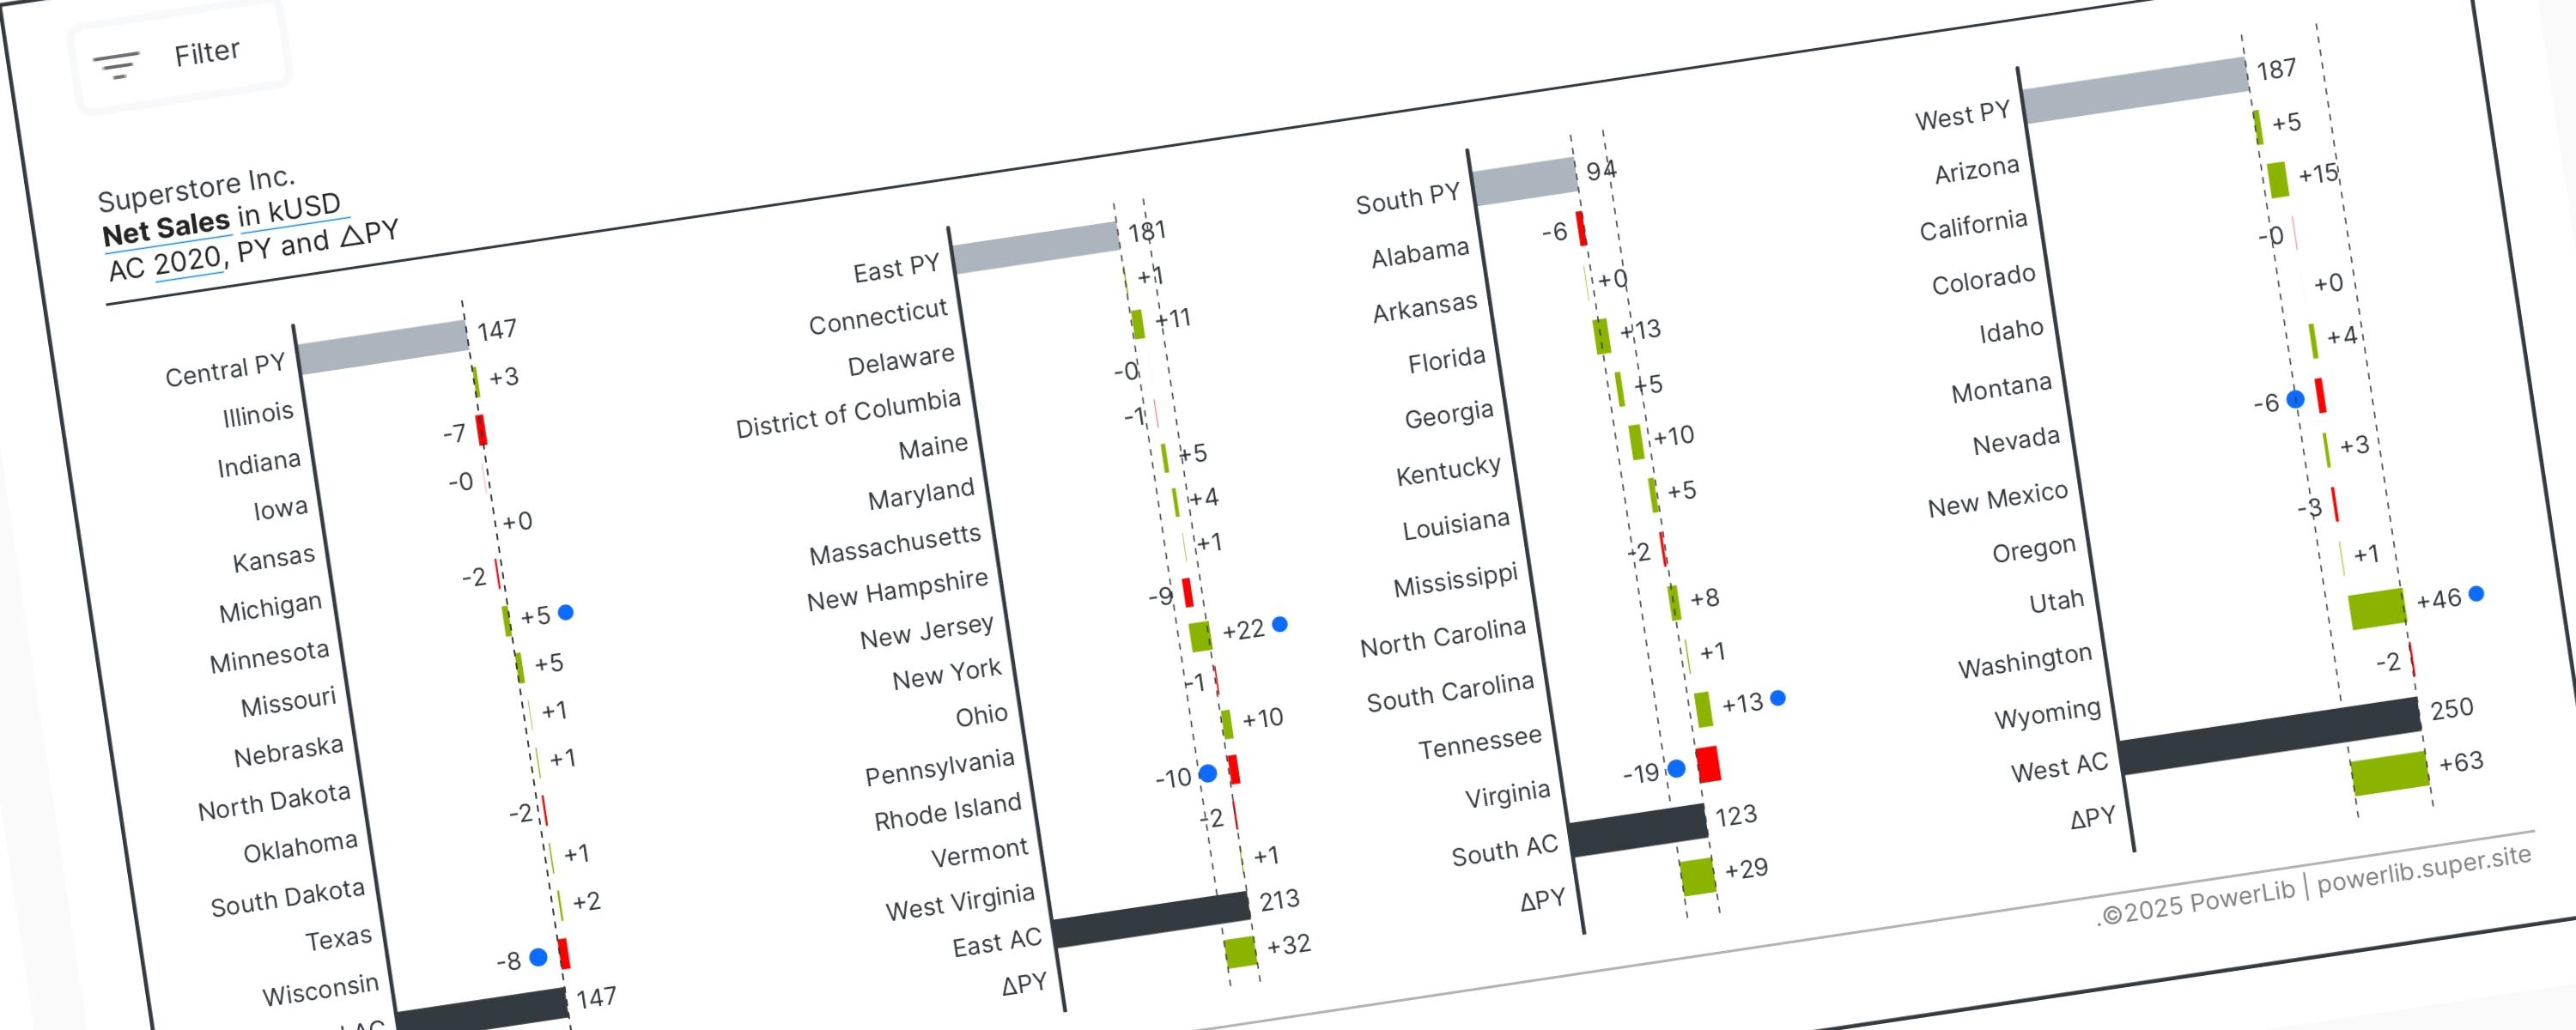
WaterfallMember-Only
When using a waterfall chart, visual direction determines its purpose: Vertical charts break down data by categories or factors (non-time series), while Horizontal charts track…
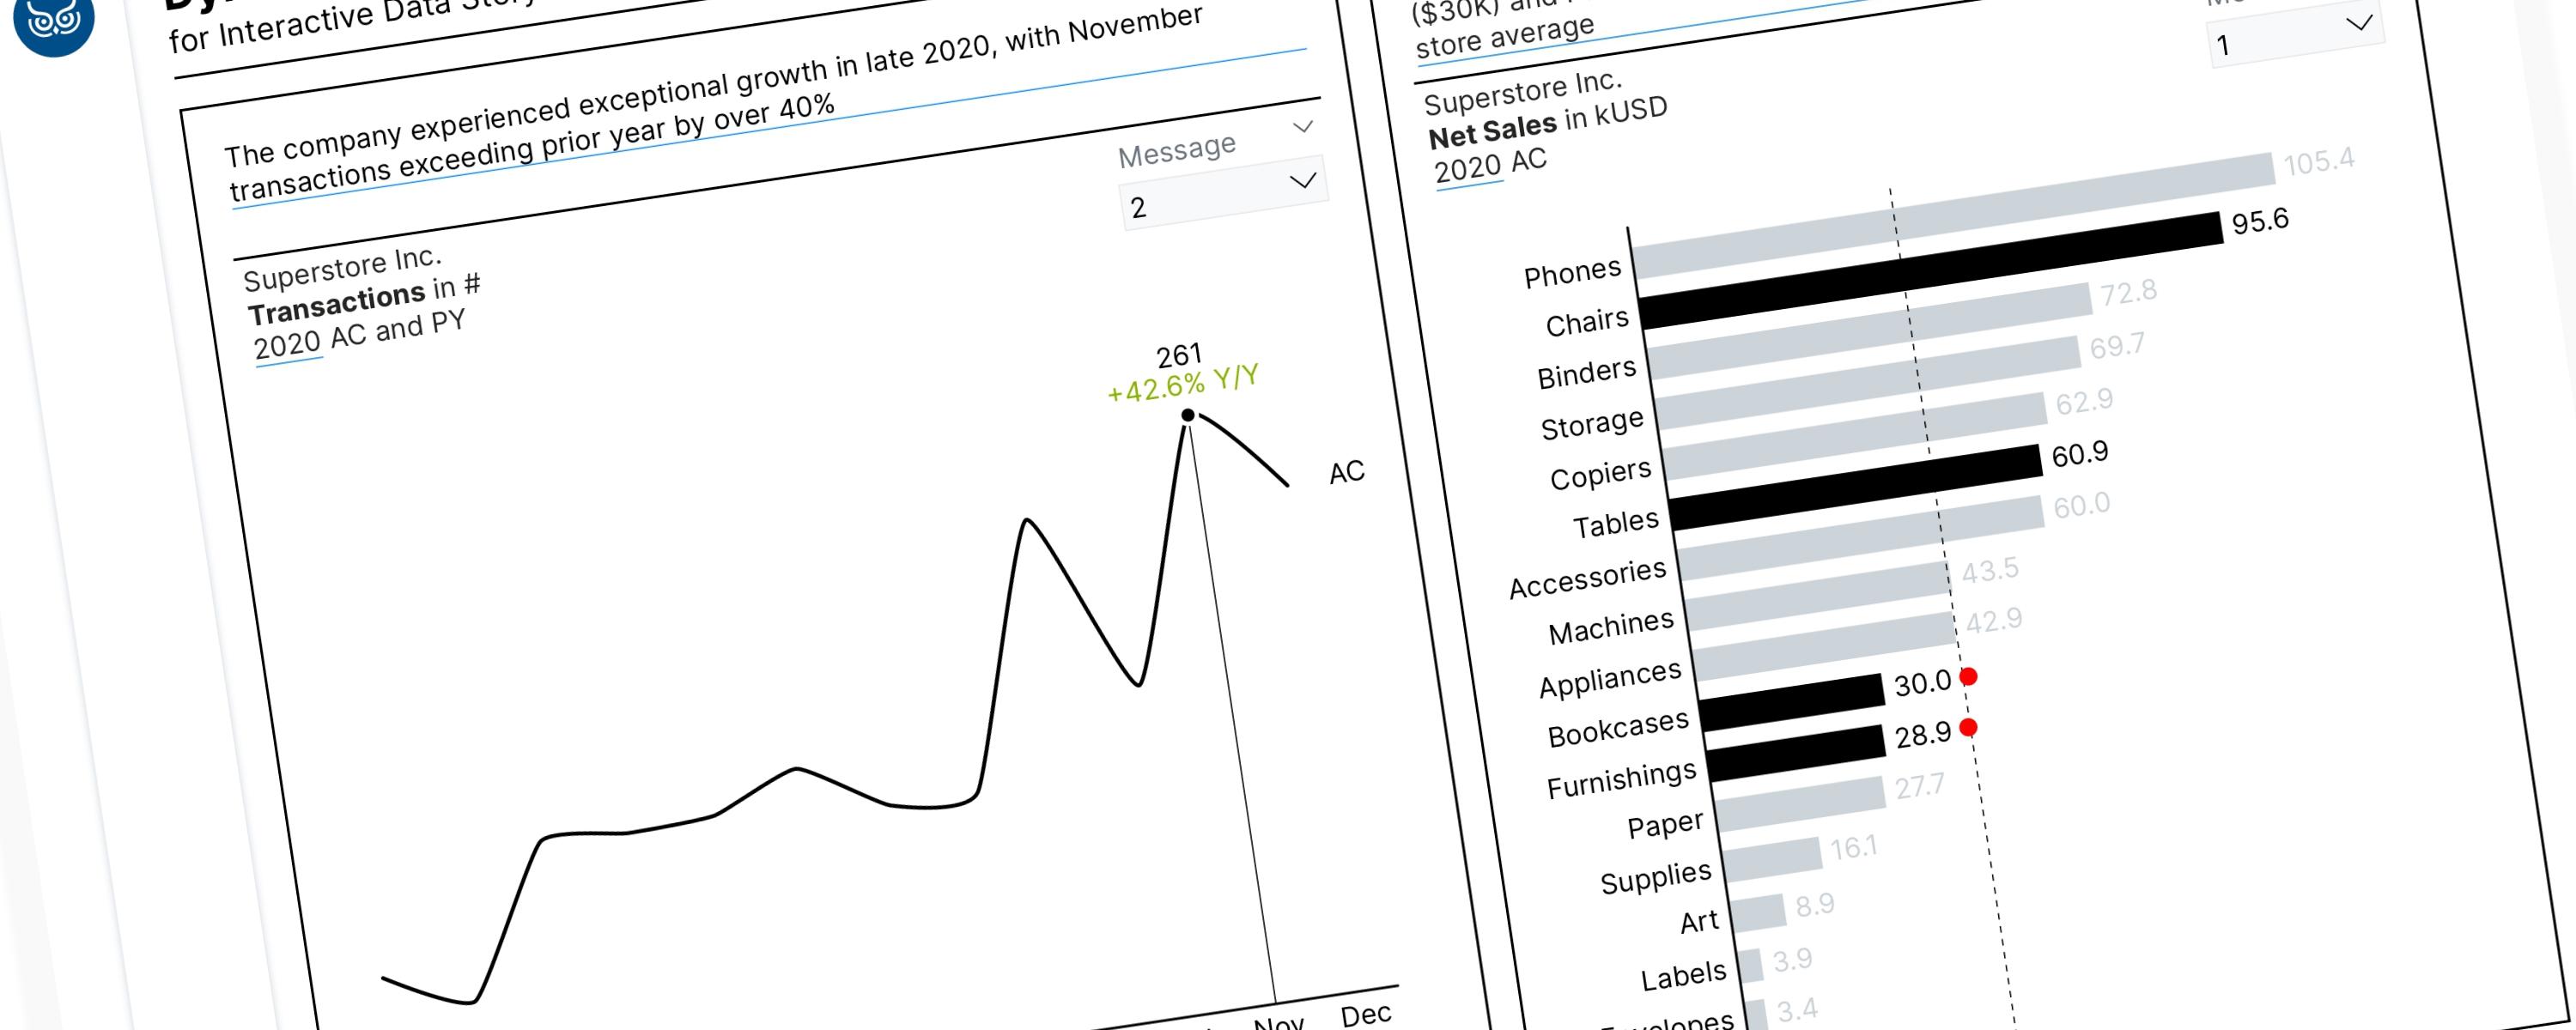
BarFree
Field parameters are a powerful feature in Power BI. When combined with the SWITCH() function, these tools allow us to tell a compelling data story by dynamically highlighting…
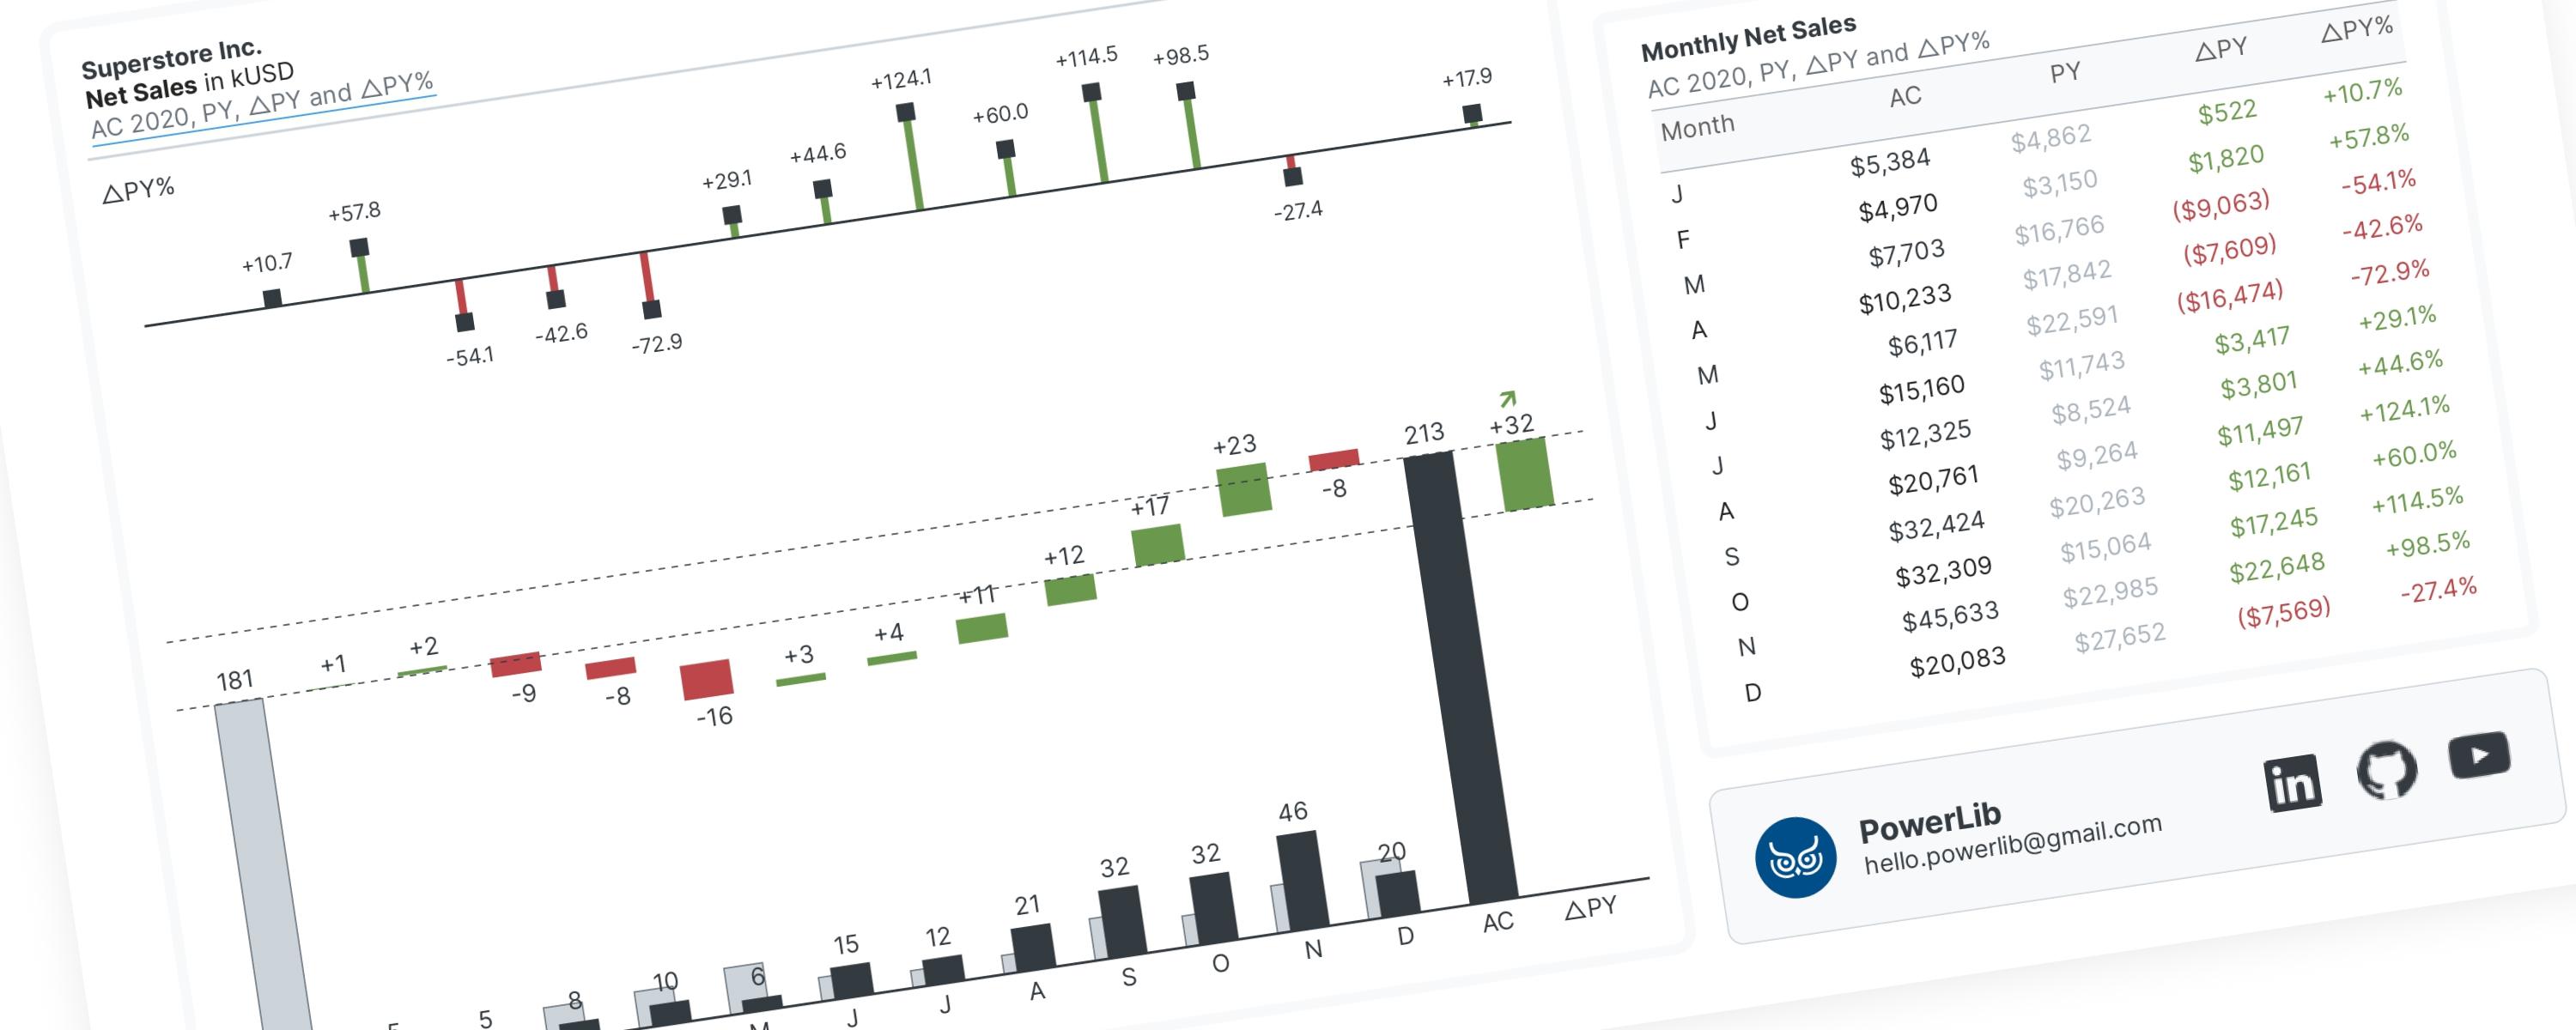
WaterfallFree
A waterfall chart is a special type of bar chart that shows you the story behind how a number changed from one point to another.
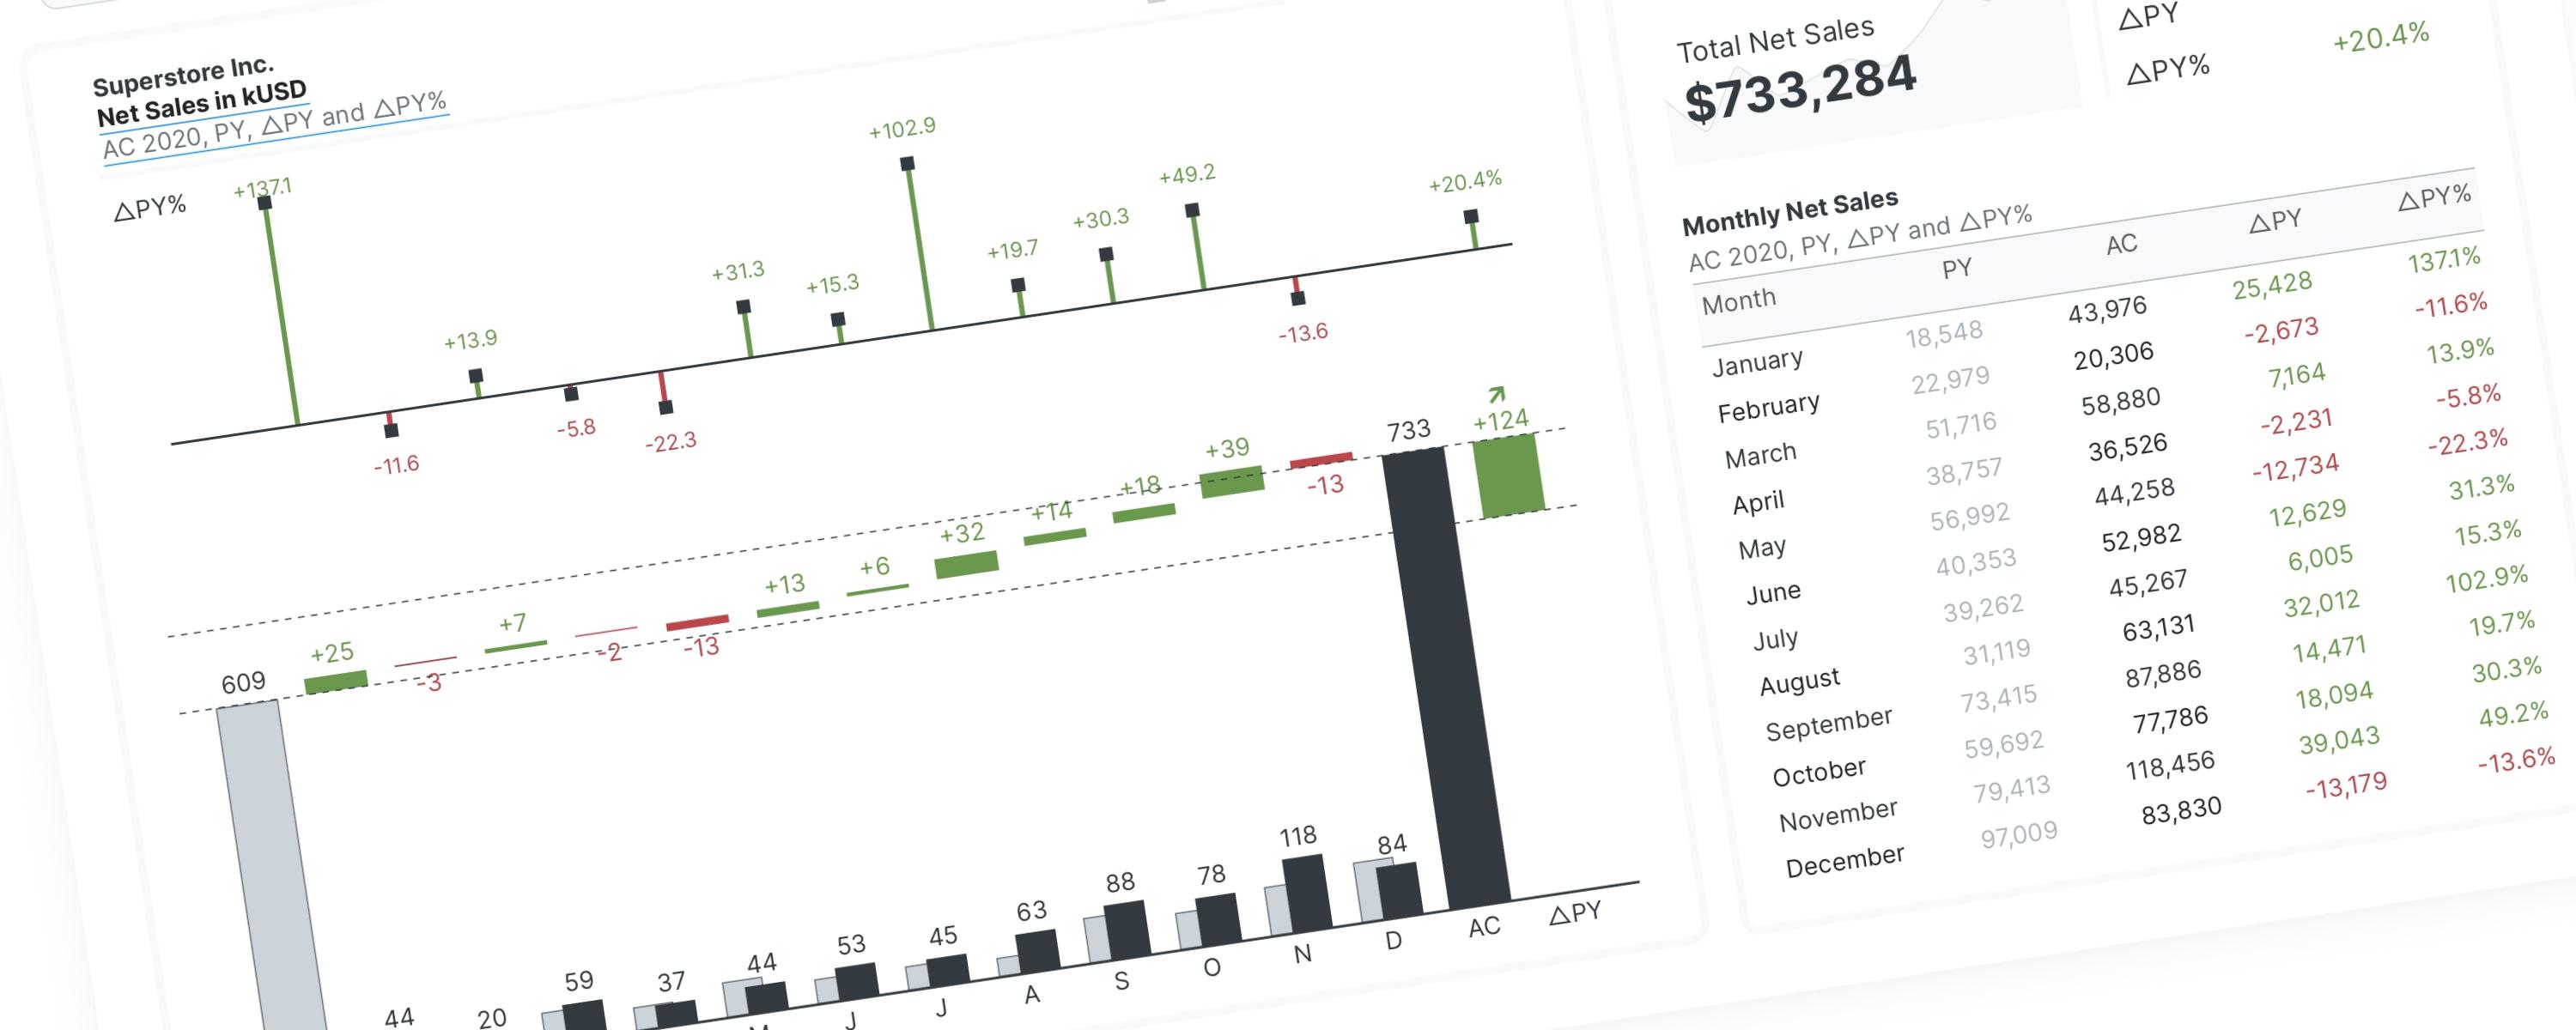
WaterfallMember-Only
You can find my explanation of the IBCS horizontal waterfall chart's construction logic in Power BI on LinkedIn:
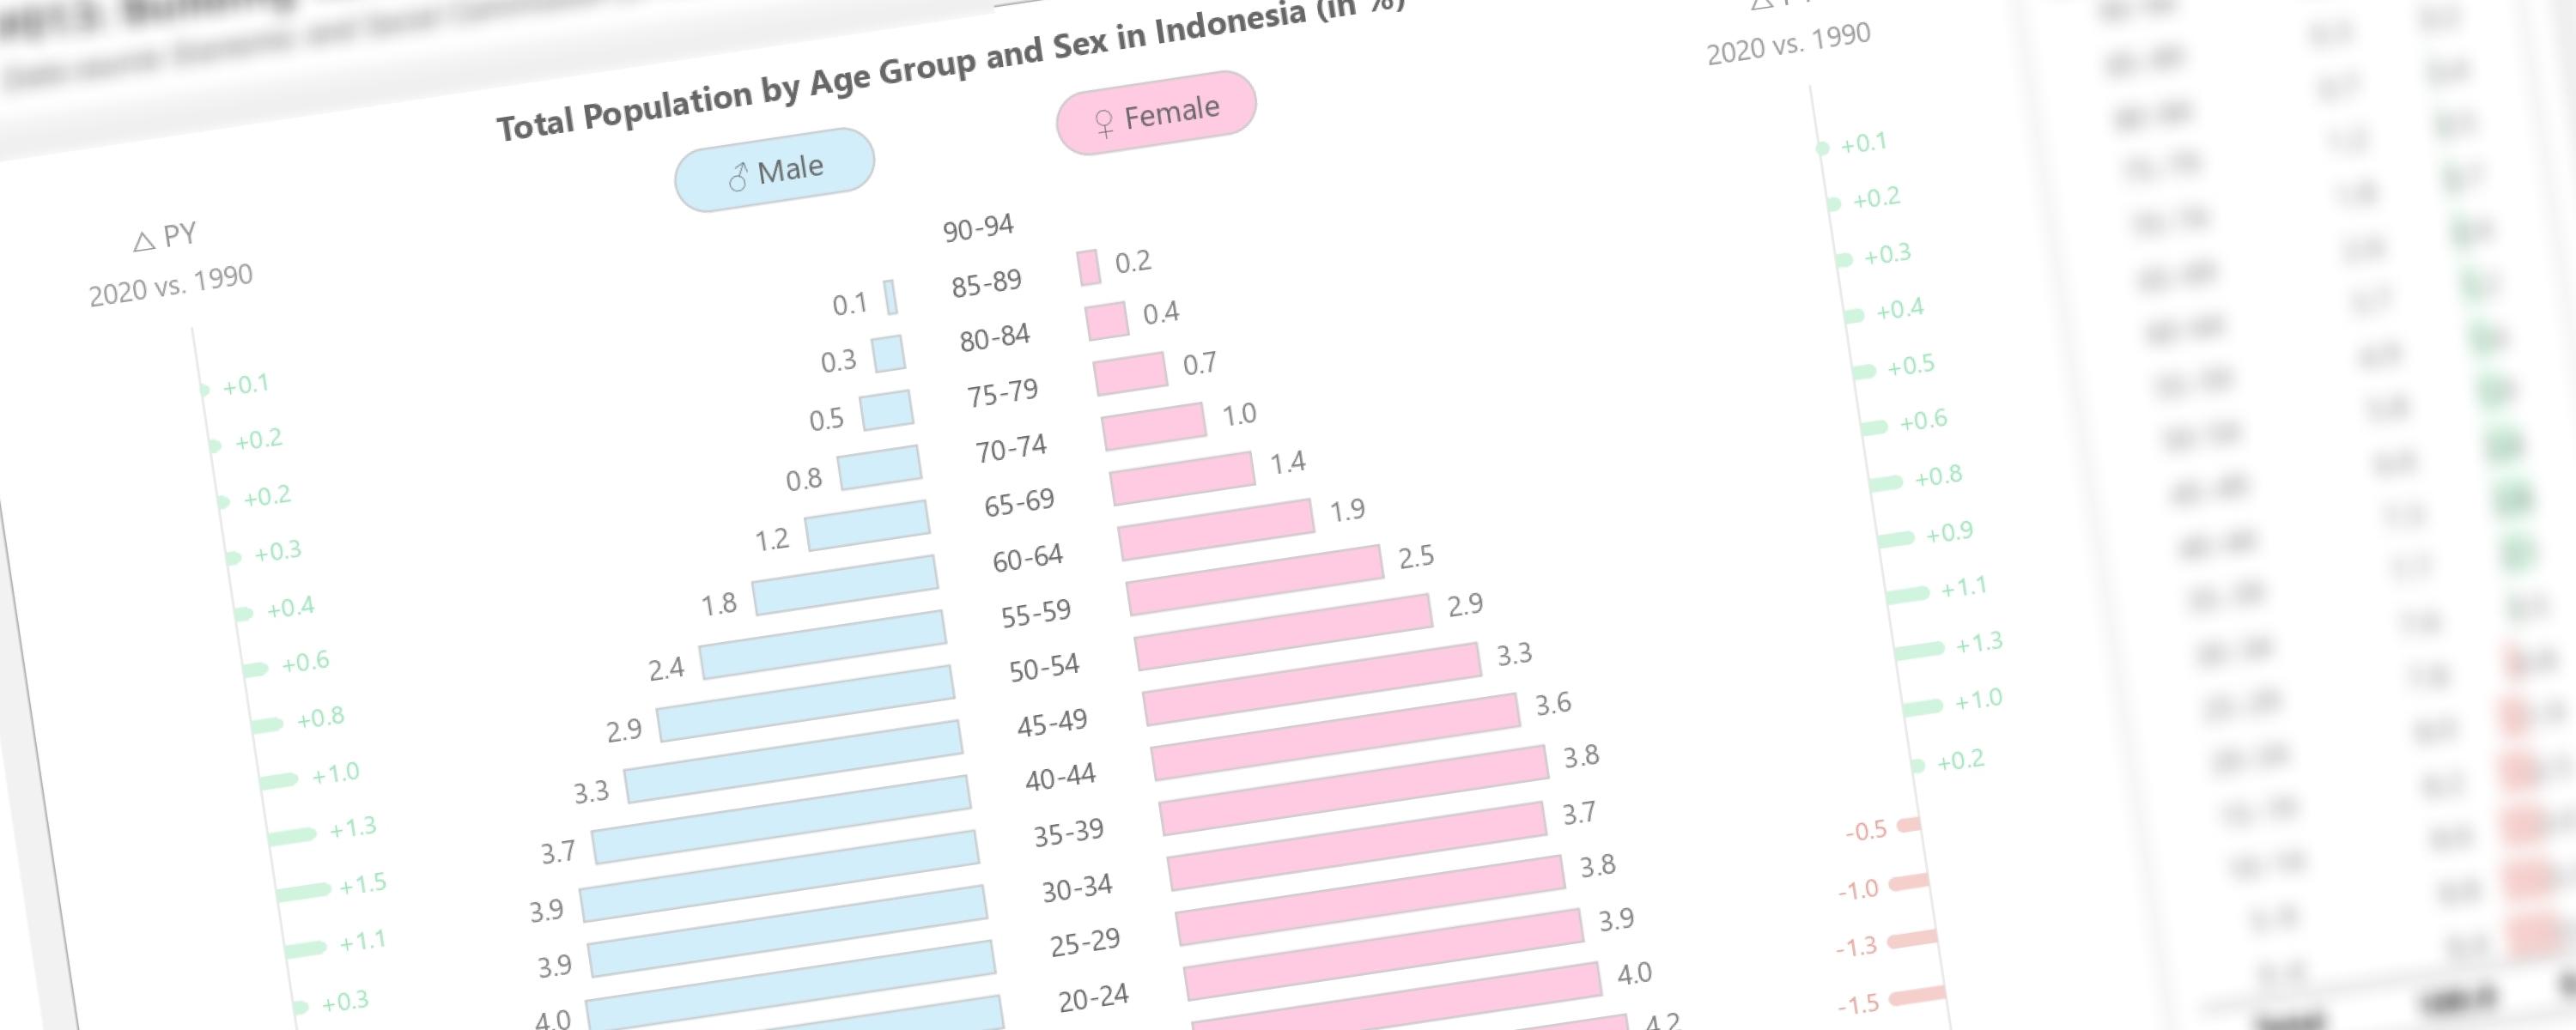
BarFree
This documentation will guide you how to create tornado chart, also known as tornado diagram or butterfly chart, in Power BI using entirely native visuals.
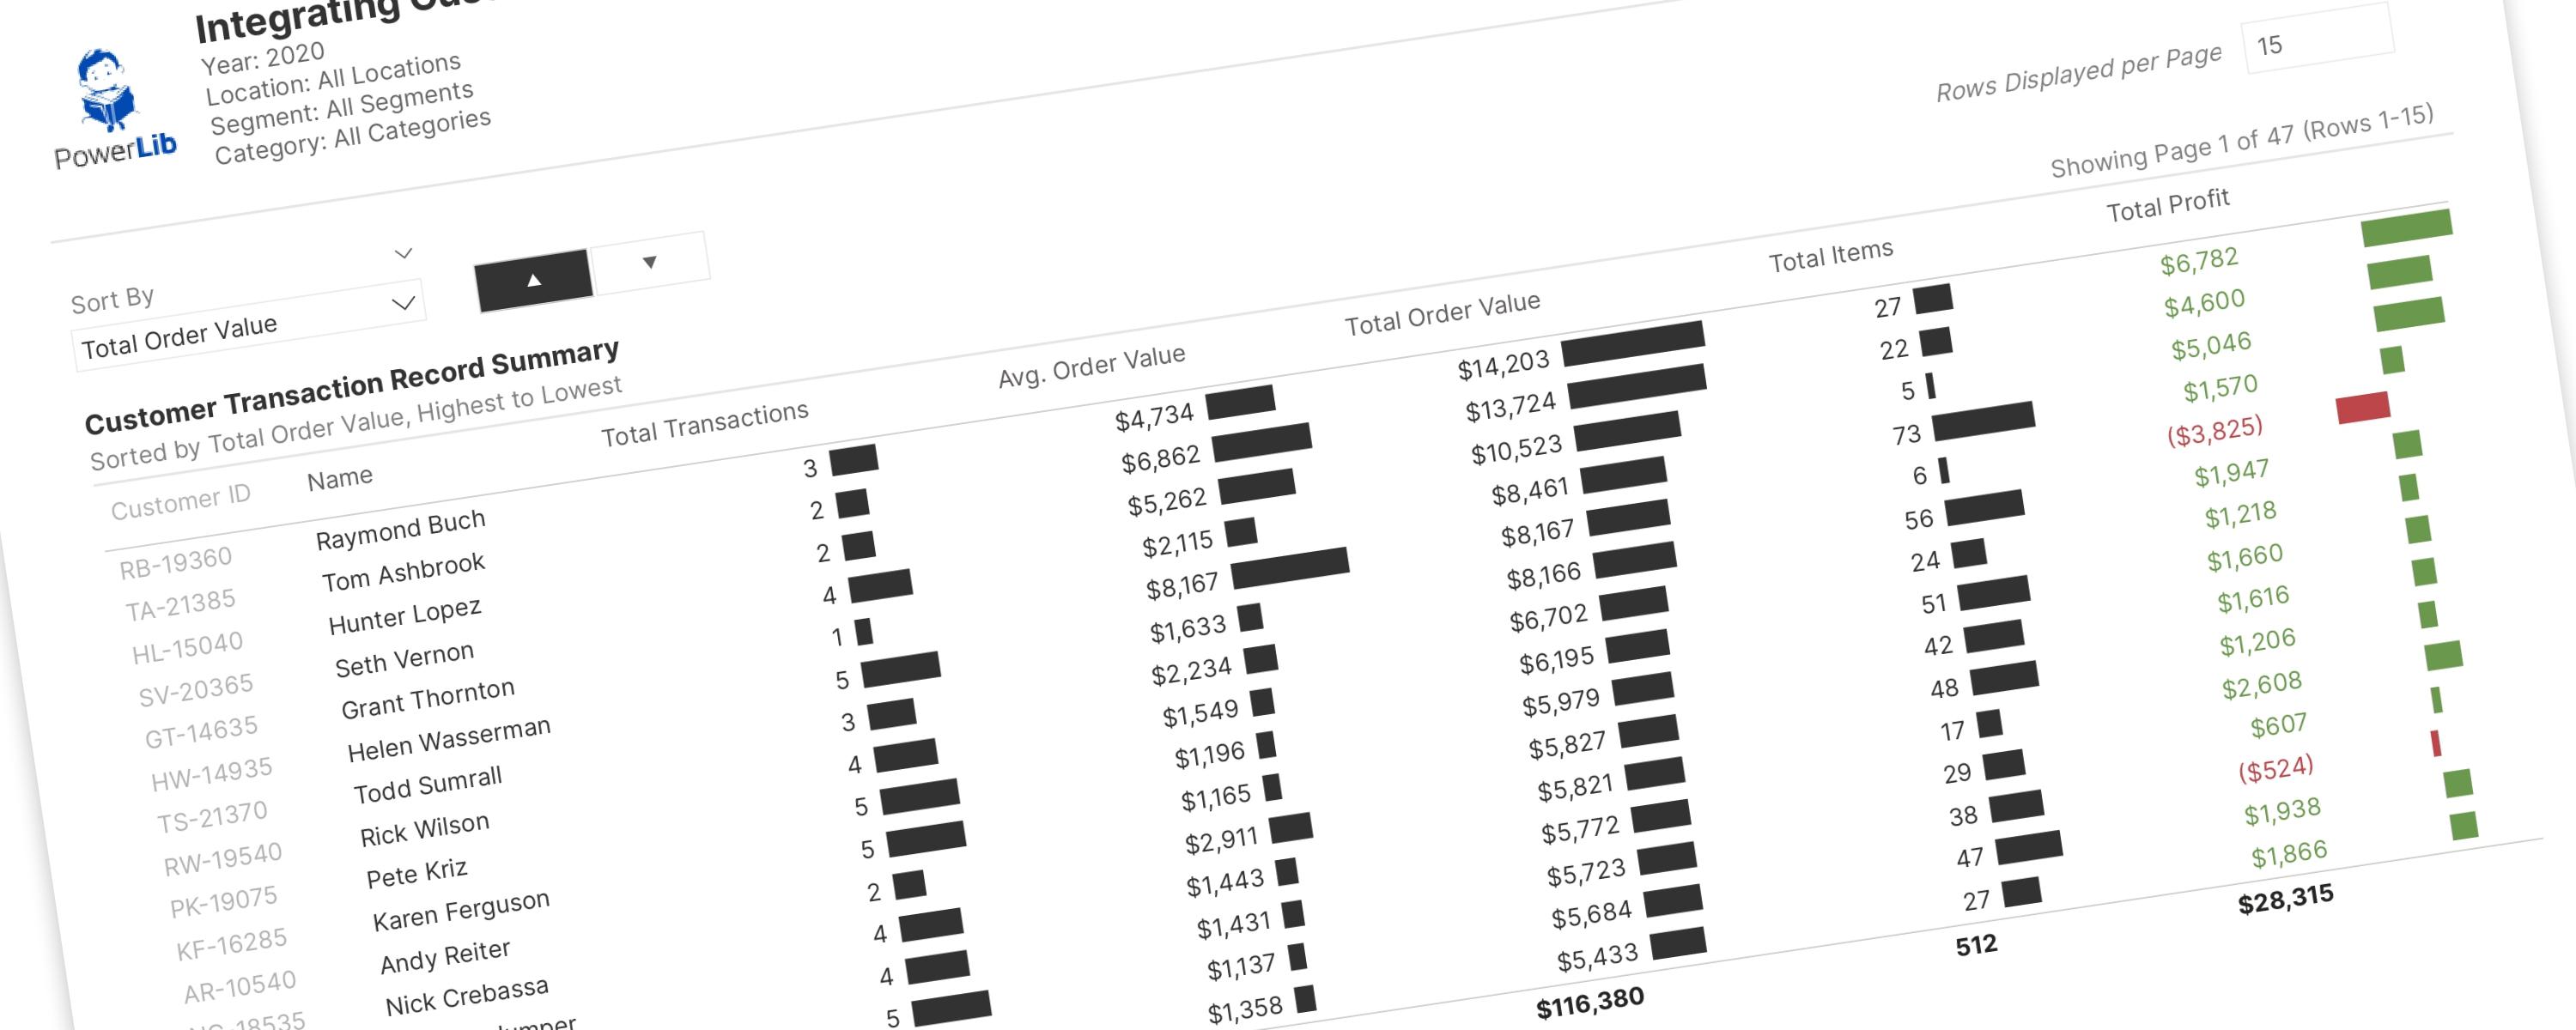
BarFree
This documentation details advanced pagination techniques, extending my previous tutorial and documentation.
Metric/KPIFree
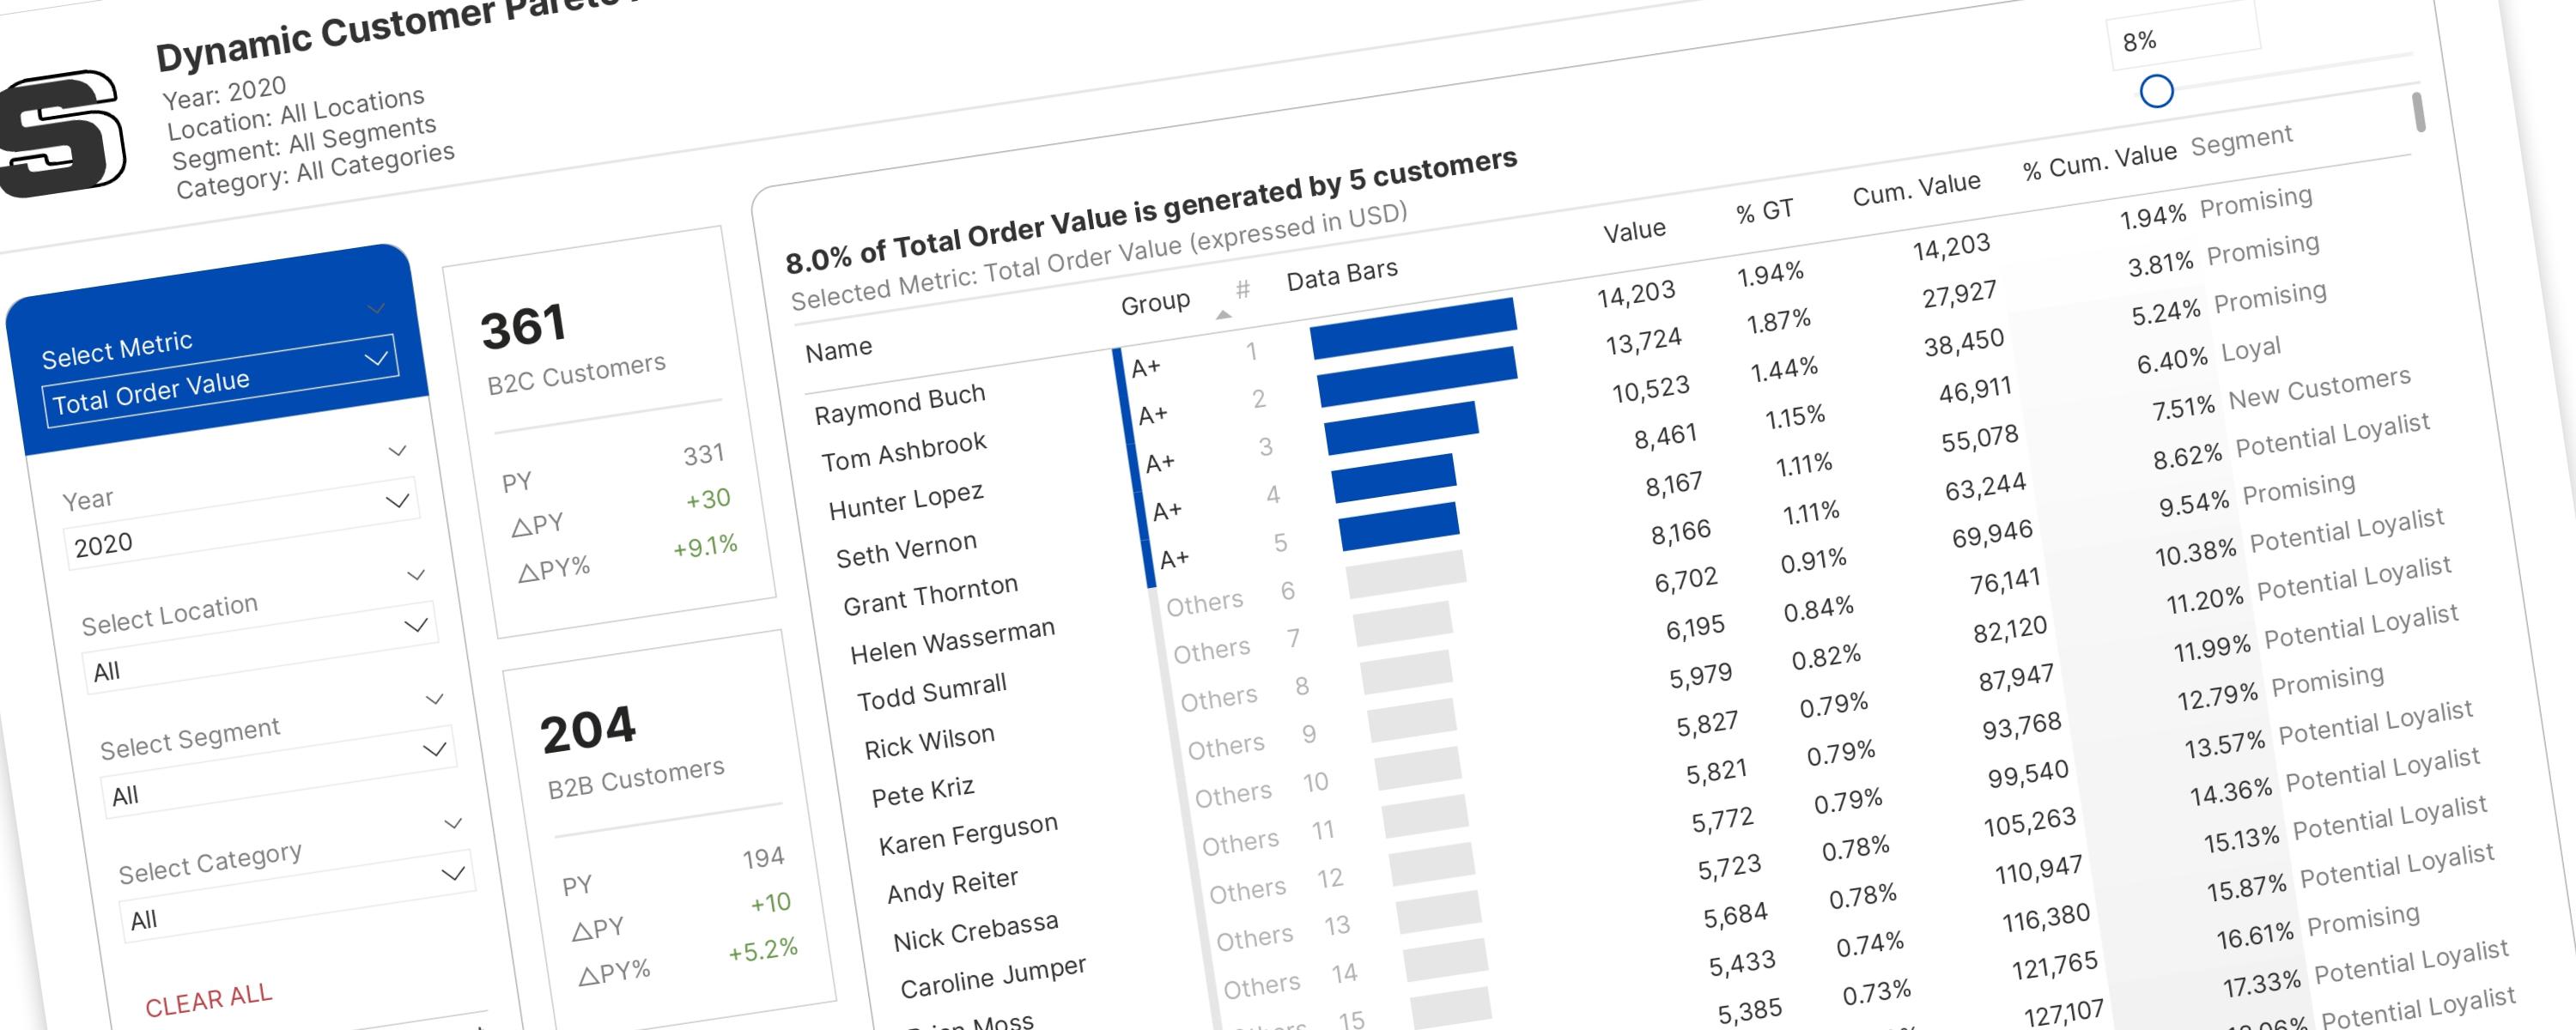
This documentation provides a step-by-step approach to building the first version of the one-for-all customer Pareto analysis dashboard.