WaterfallMember-Only
Bars with Vertical Waterfall Chart (Version 2)
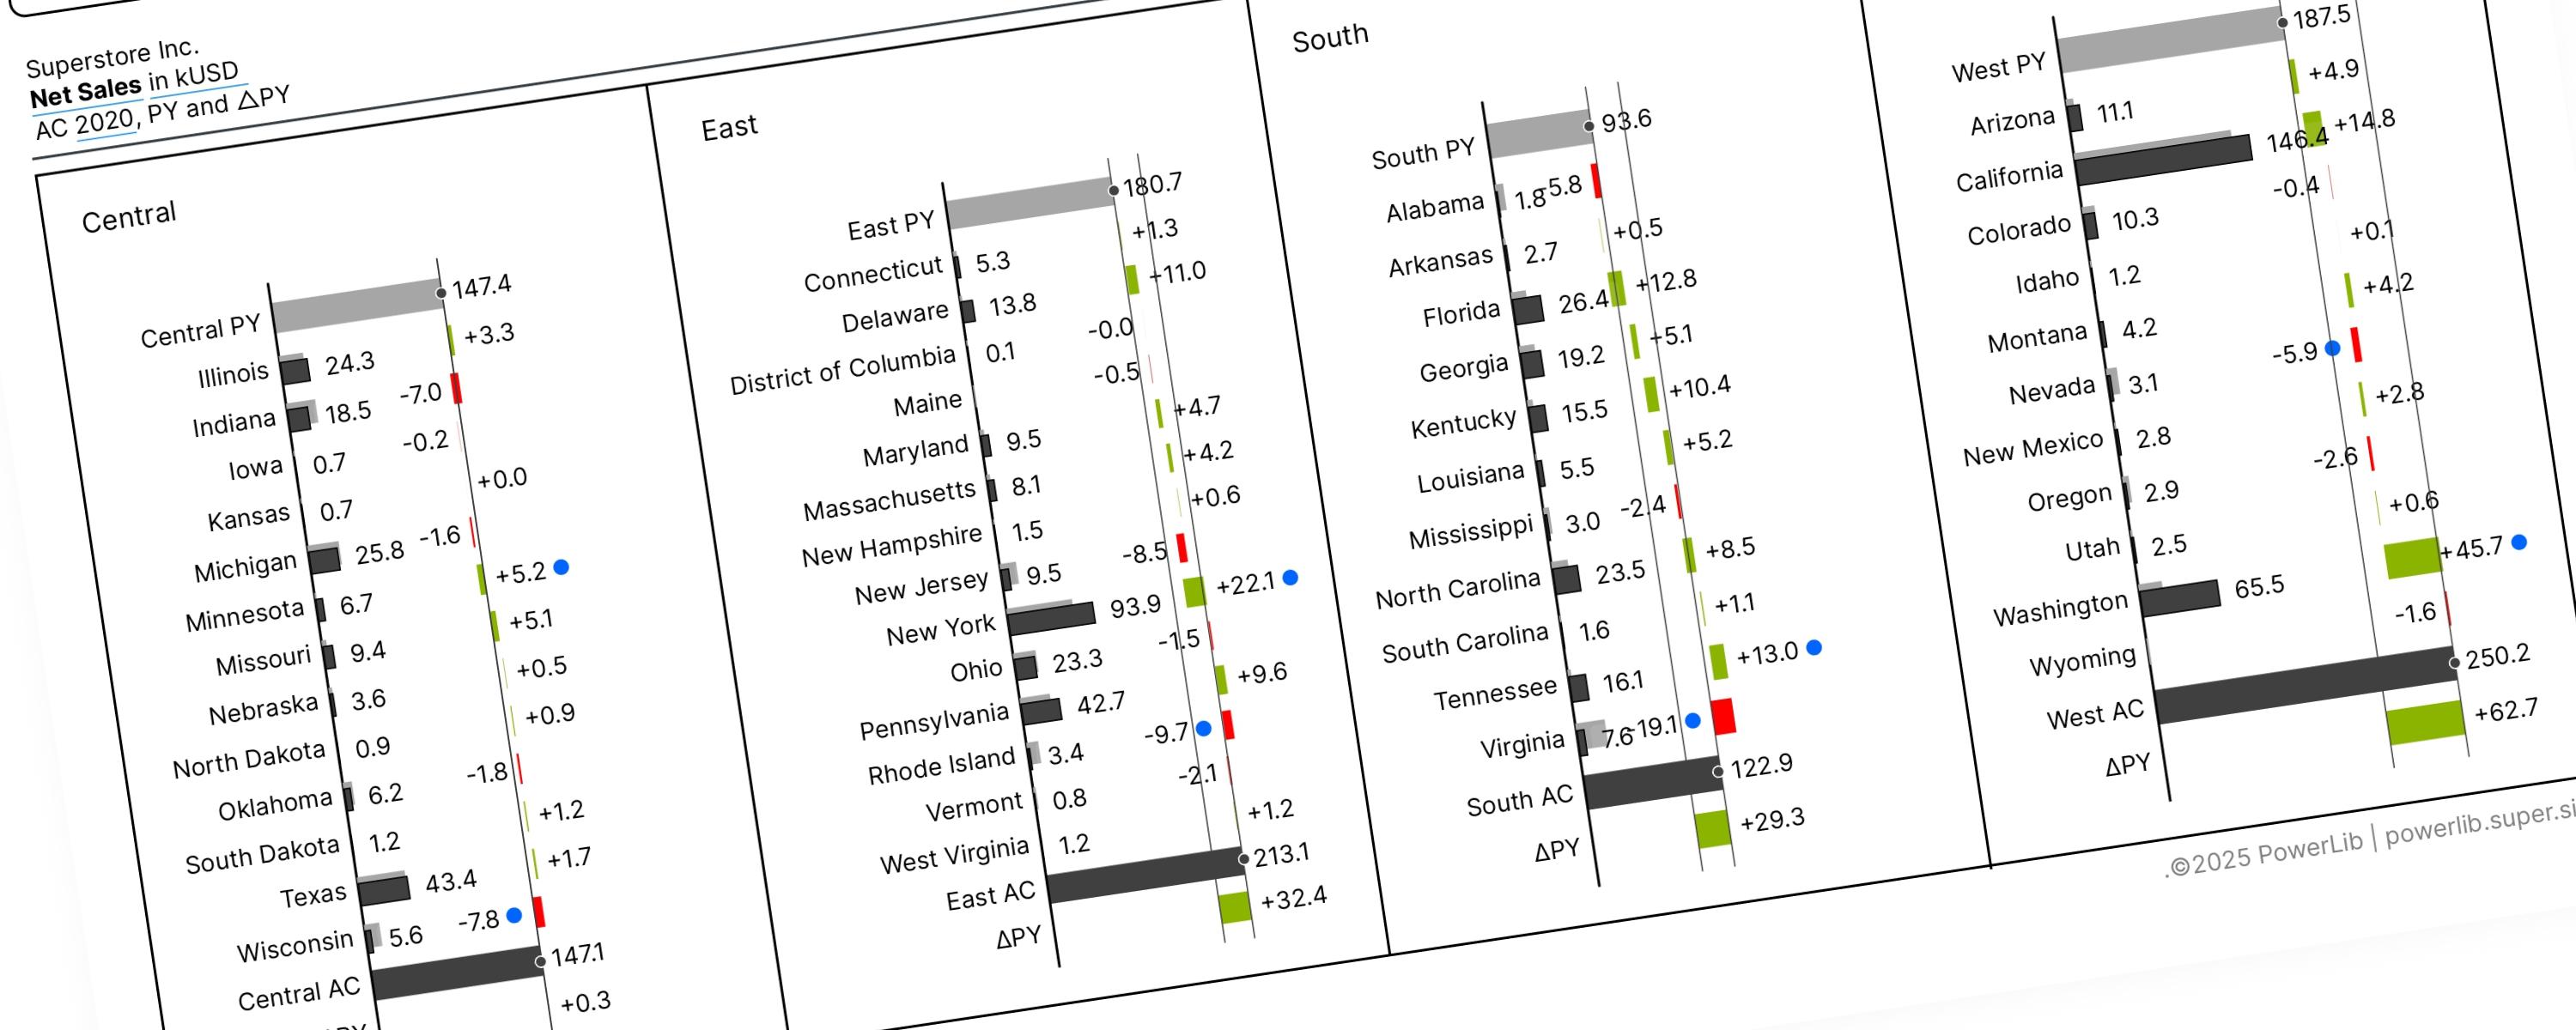
A Vertical Waterfall Chart is a way to clearly show why two numbers are different by breaking down the changes that happened in between.
23 November 202568 min read
Documented Power BI techniques — the model change, the DAX, and the exact visual settings. Most are free to read; the rest come with the model files for members.
WaterfallMember-Only
A Vertical Waterfall Chart is a way to clearly show why two numbers are different by breaking down the changes that happened in between.
WaterfallMember-Only
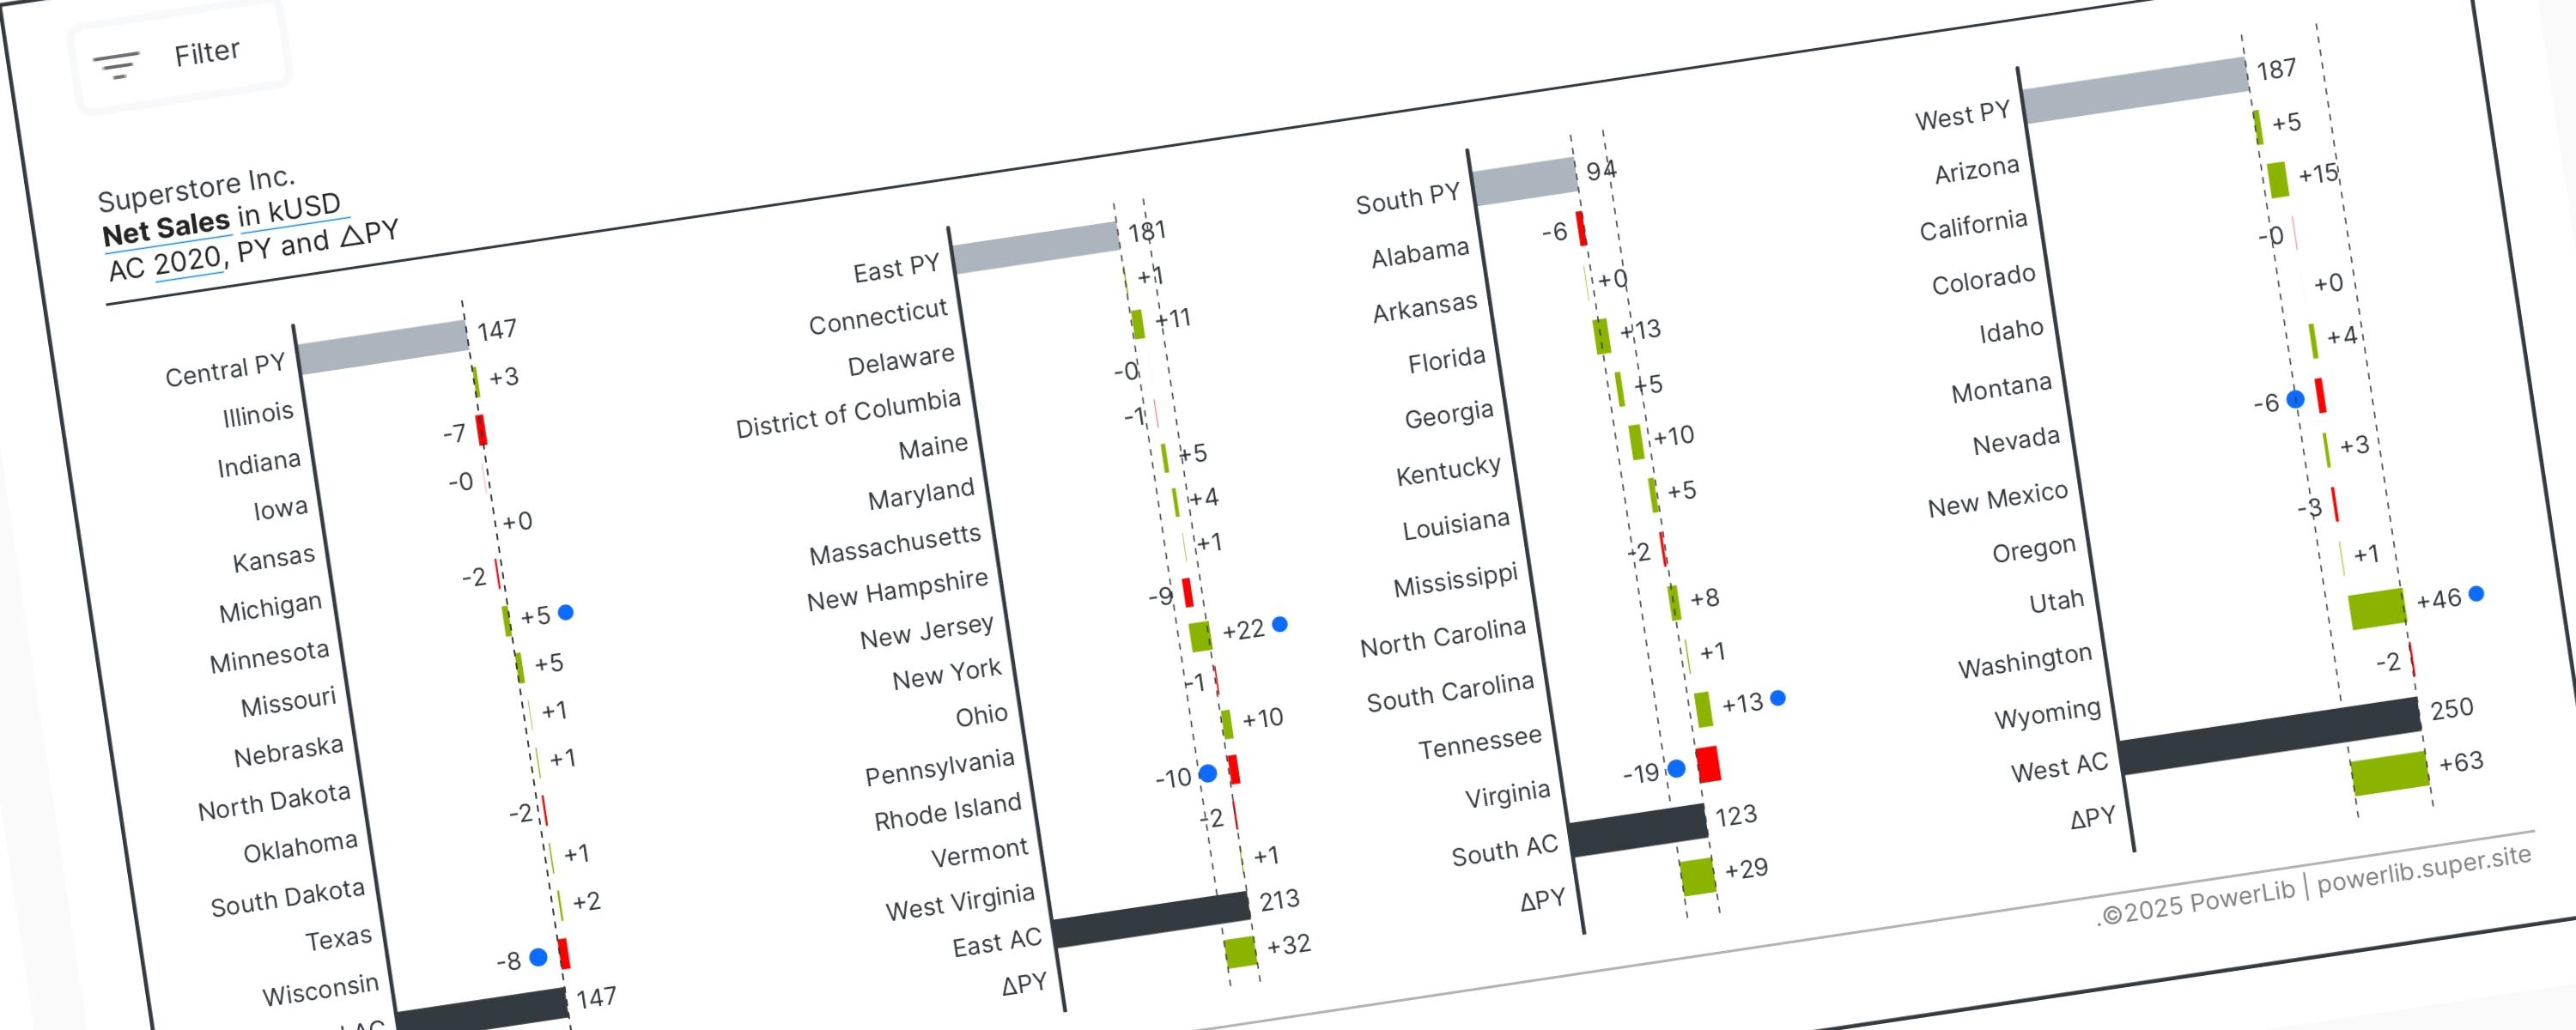
When using a waterfall chart, visual direction determines its purpose: Vertical charts break down data by categories or factors (non-time series), while Horizontal charts track…
LineFree
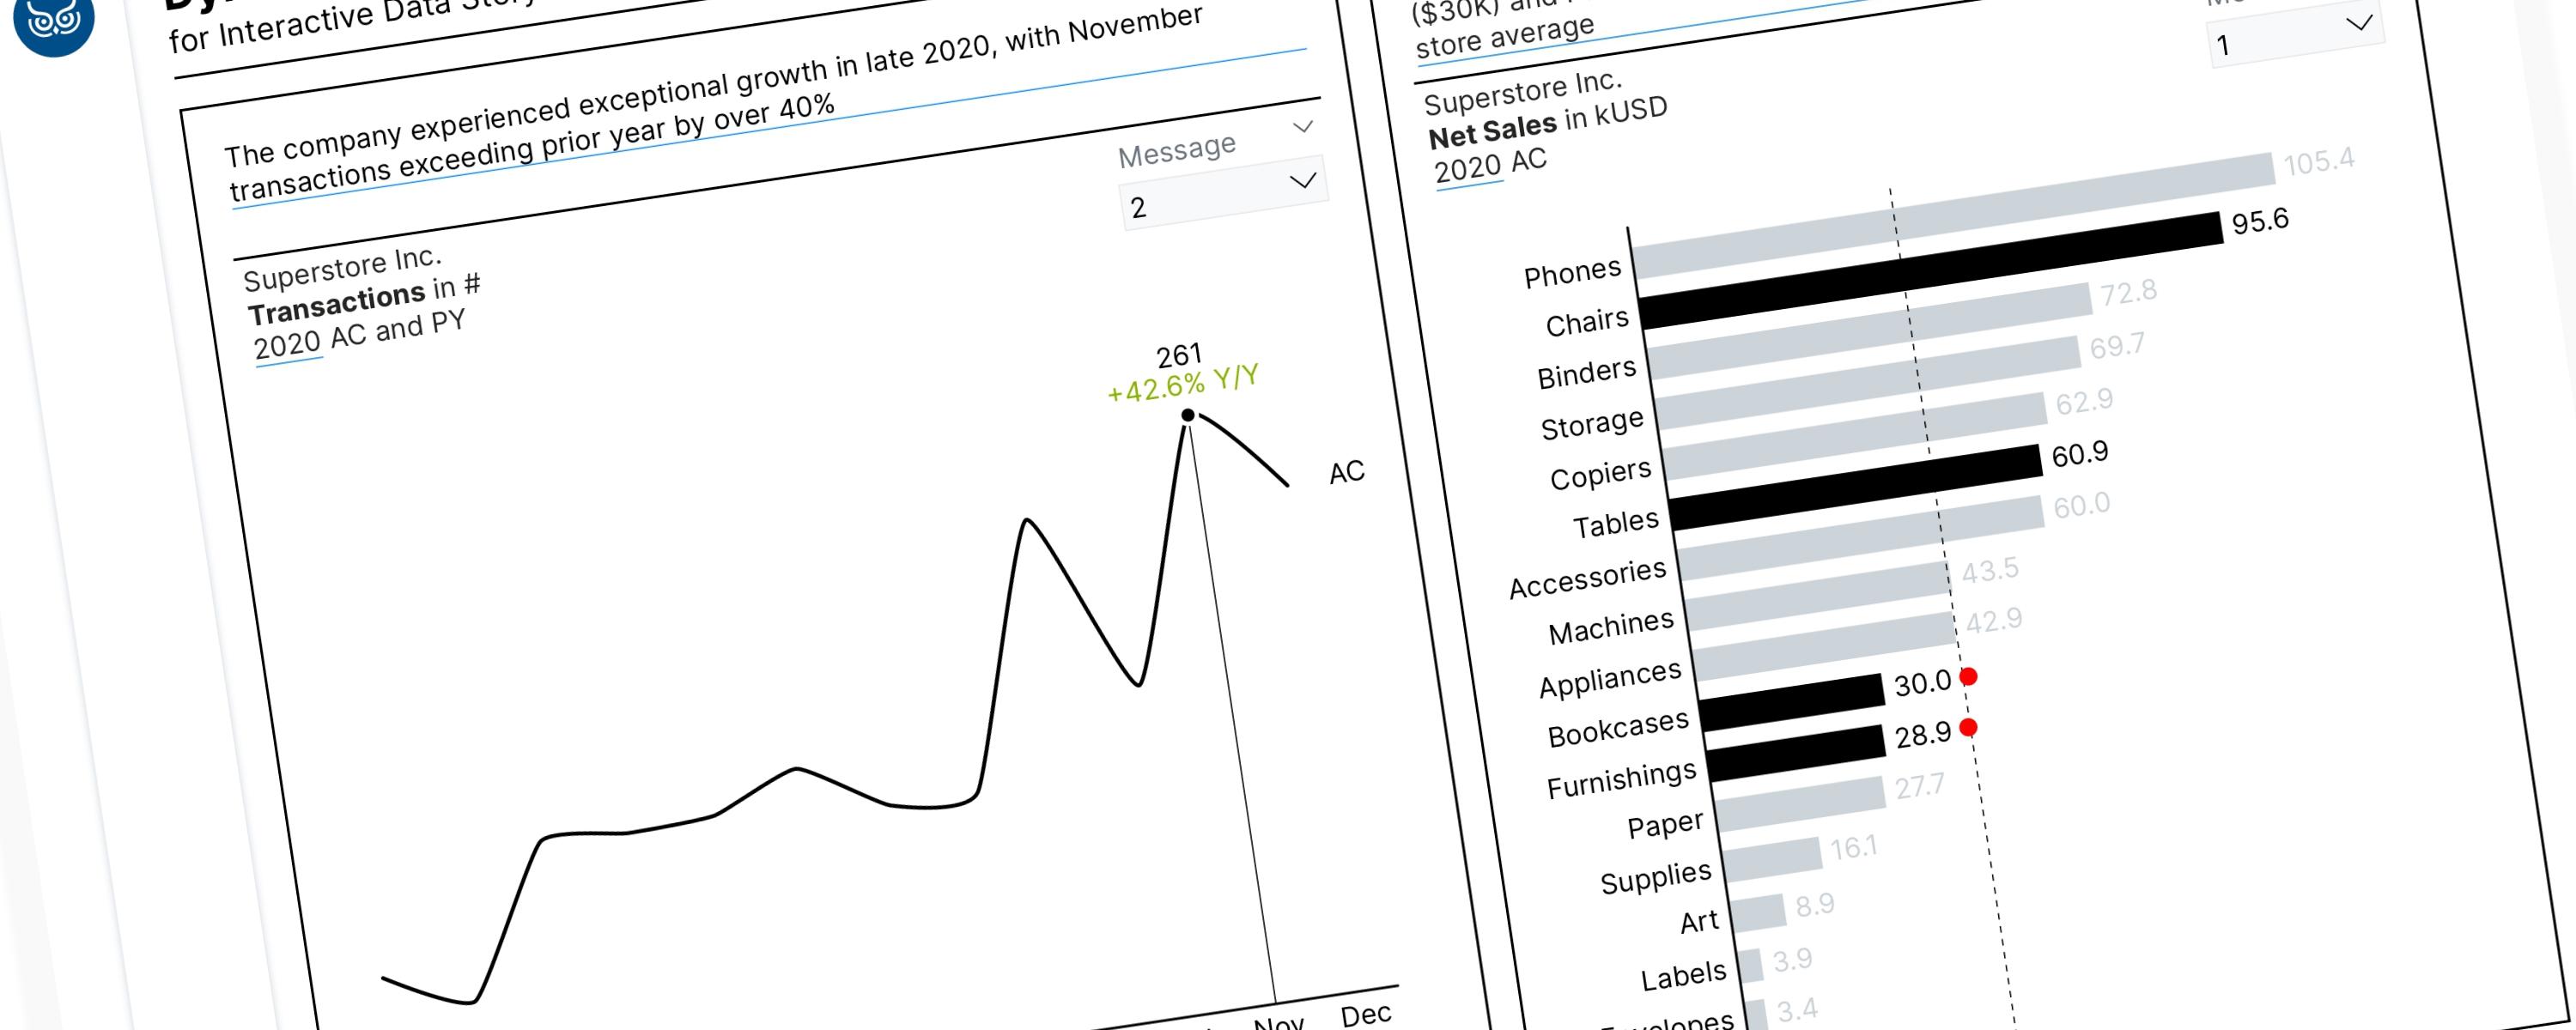
Field parameters are a powerful feature in Power BI. When combined with the SWITCH() function, these tools allow us to tell a compelling data story by dynamically highlighting…
WaterfallFree
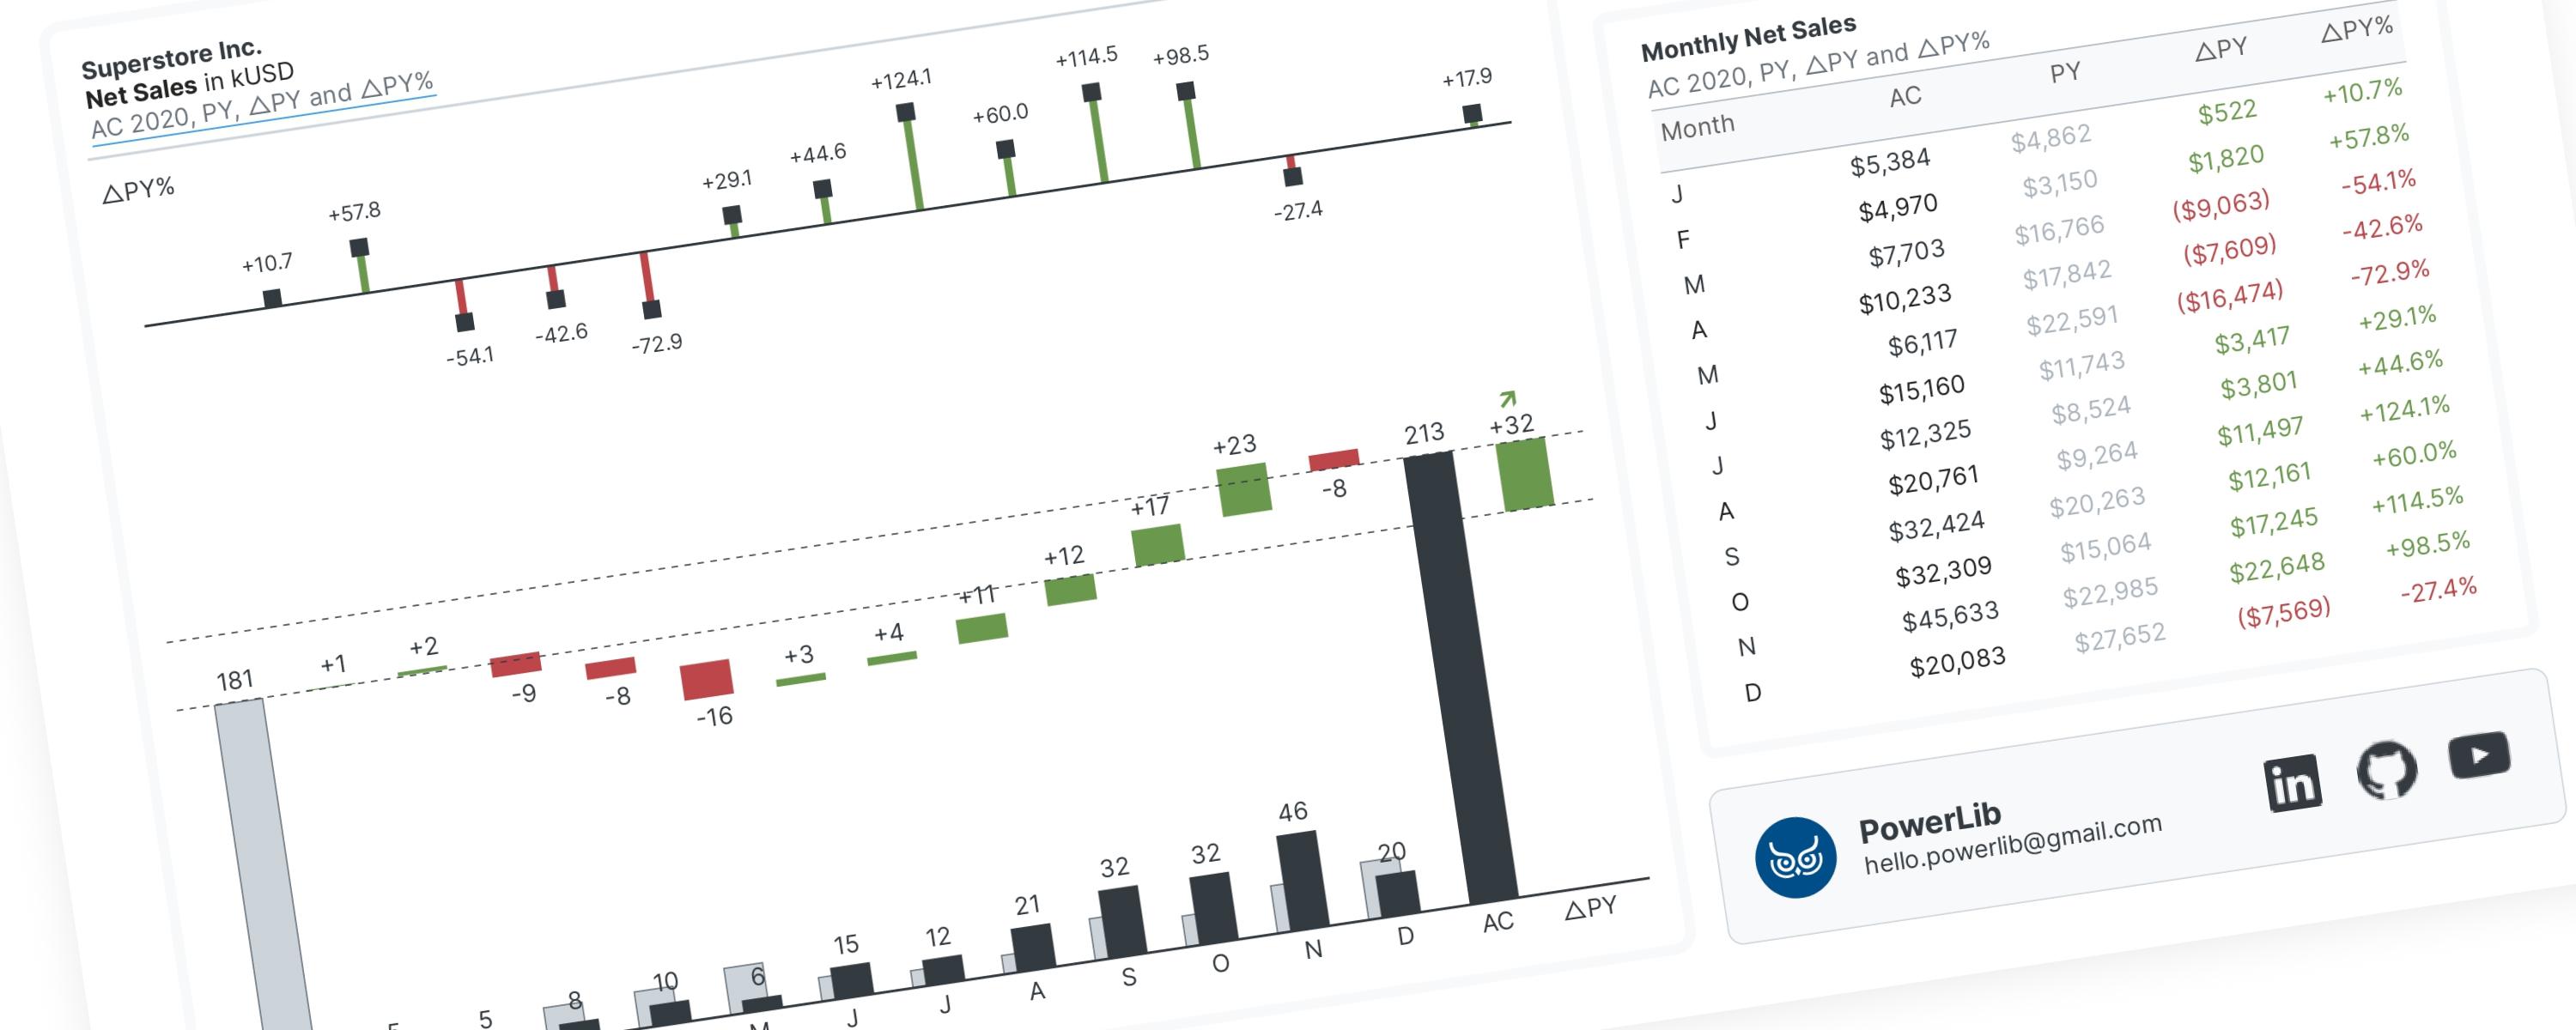
A waterfall chart is a special type of bar chart that shows you the story behind how a number changed from one point to another.
WaterfallMember-Only
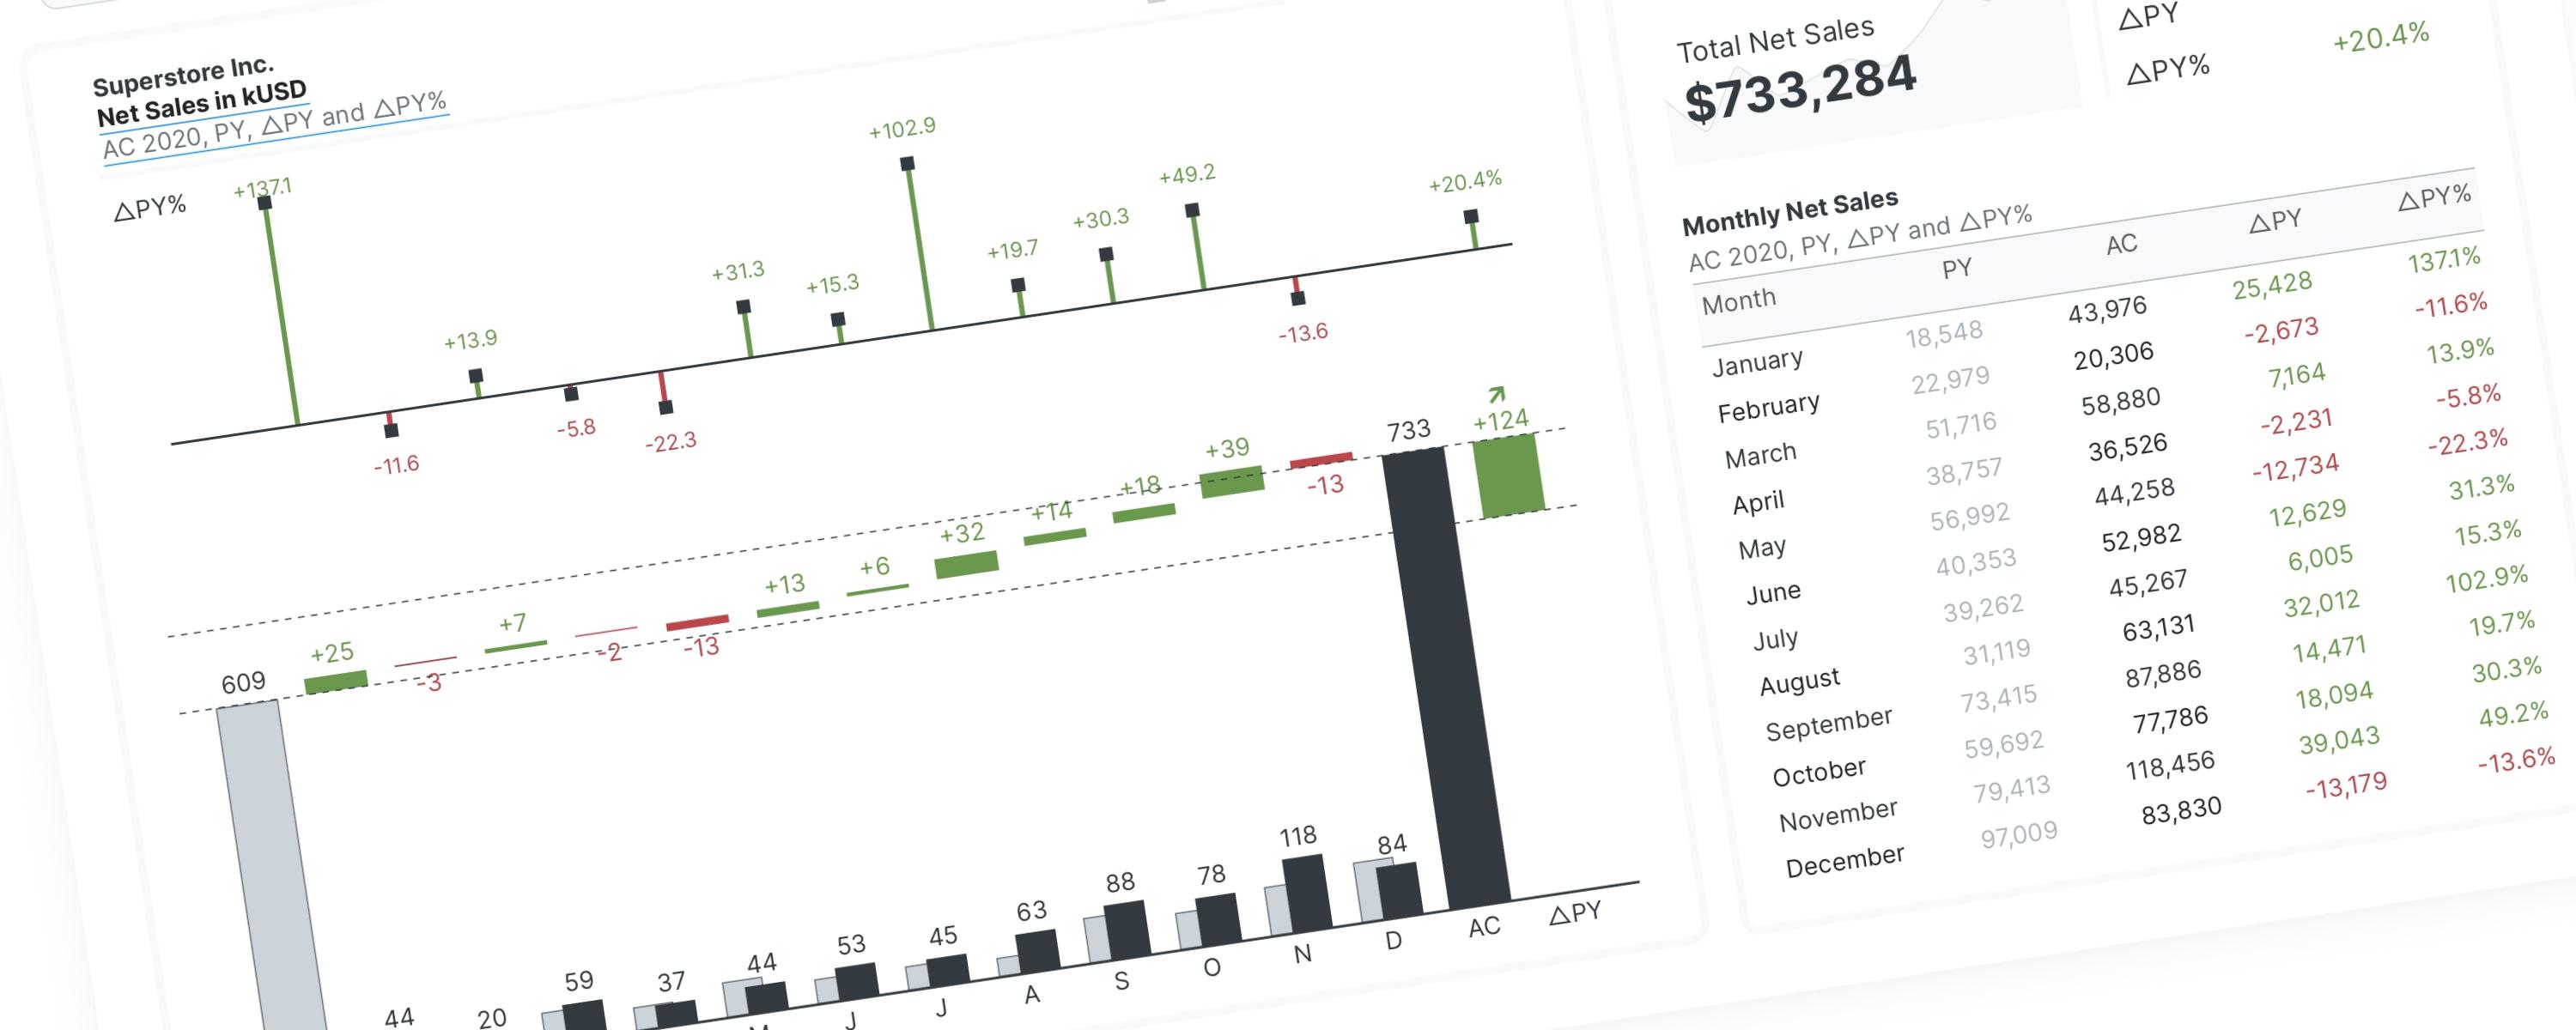
You can find my explanation of the IBCS horizontal waterfall chart's construction logic in Power BI on LinkedIn:
LineFree
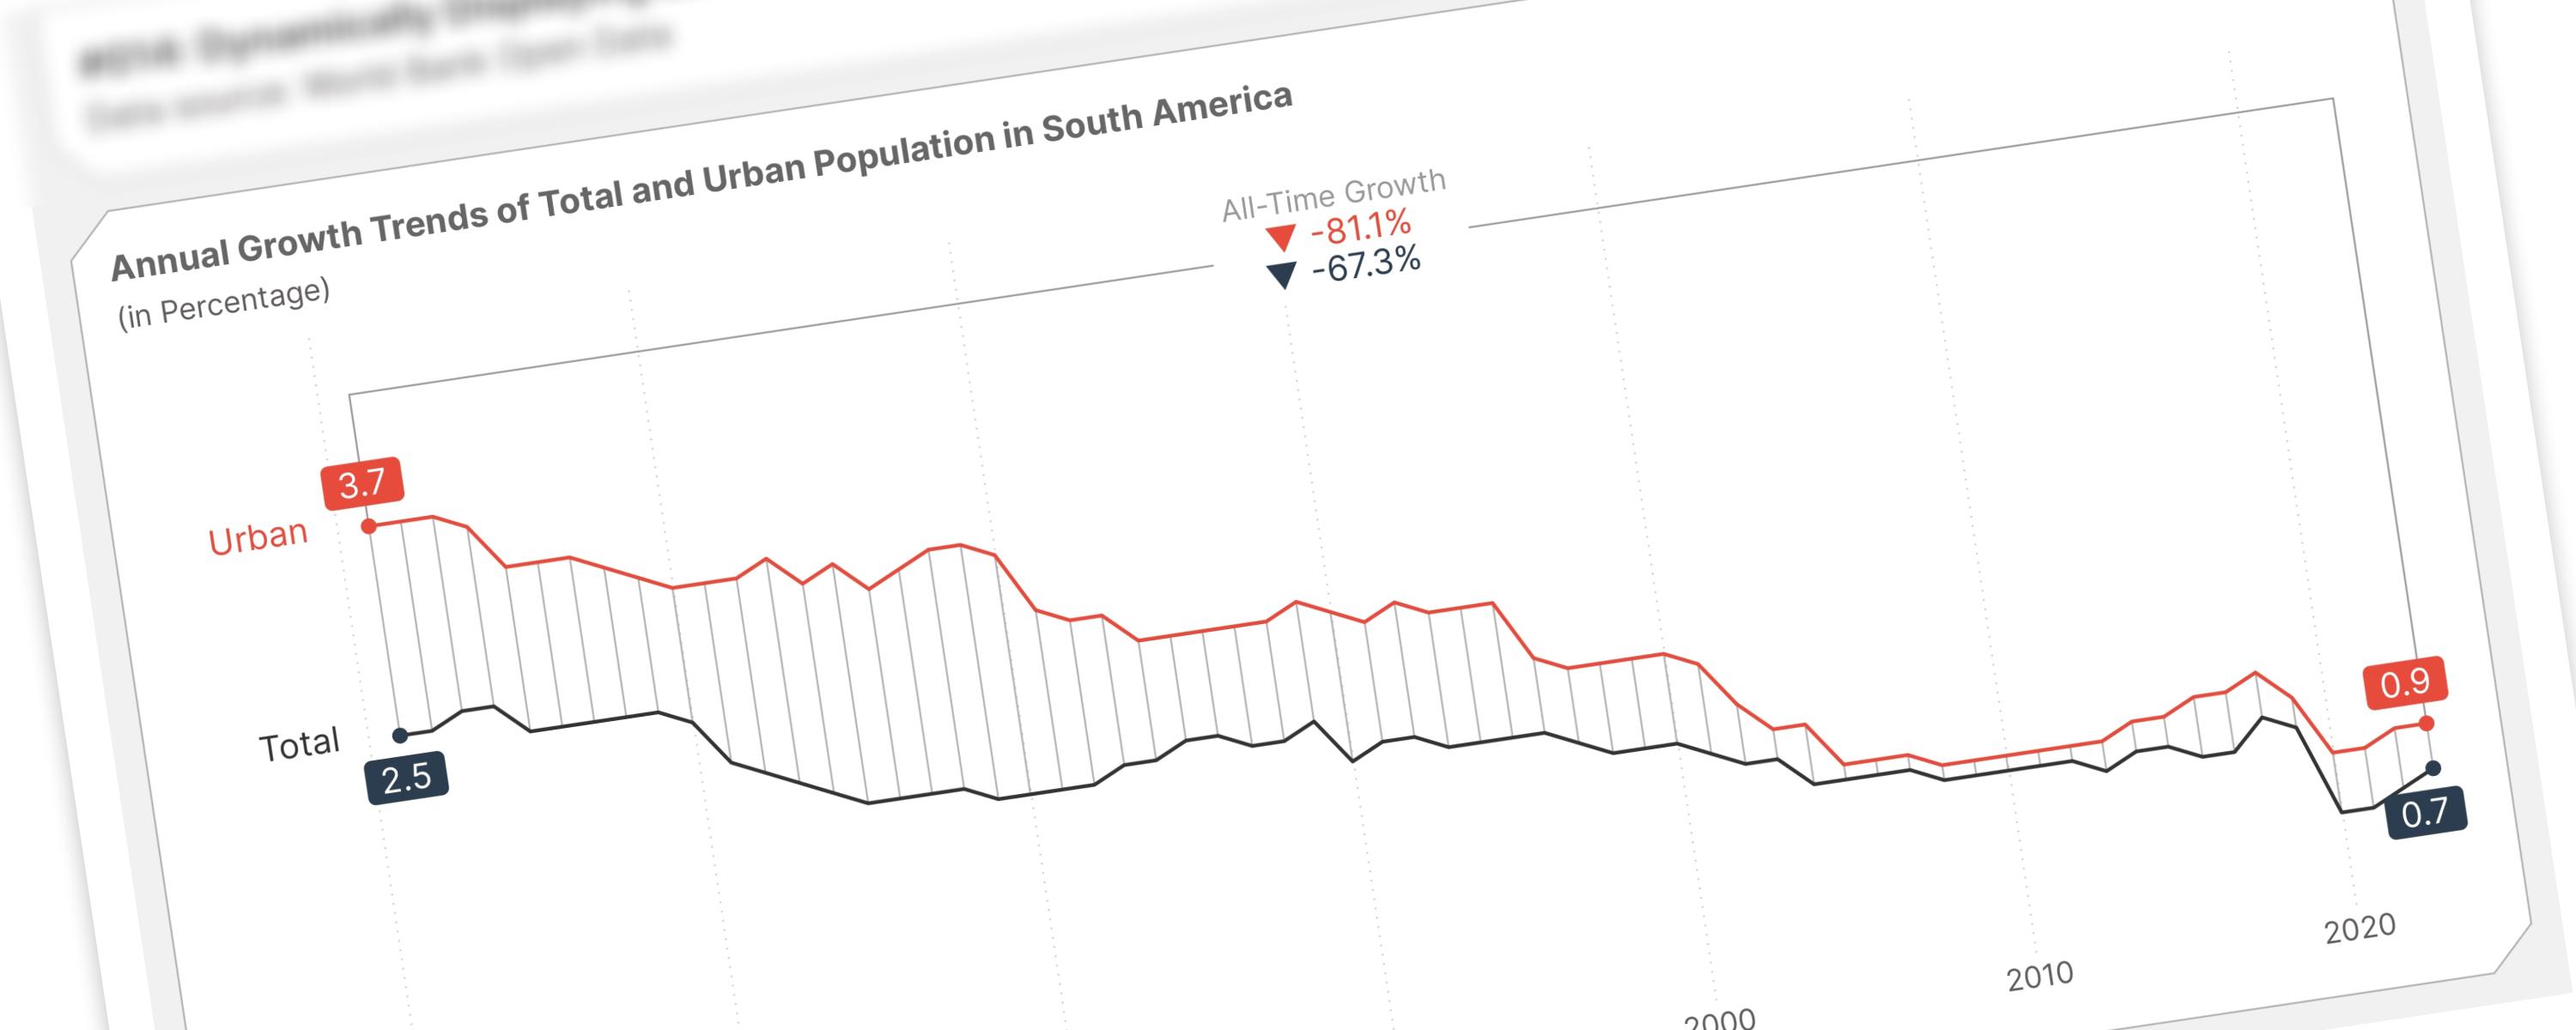
This documentation provides a guide on marking the earliest and latest selected years on a line chart and visualizing growth over time with reference lines.
LineFree
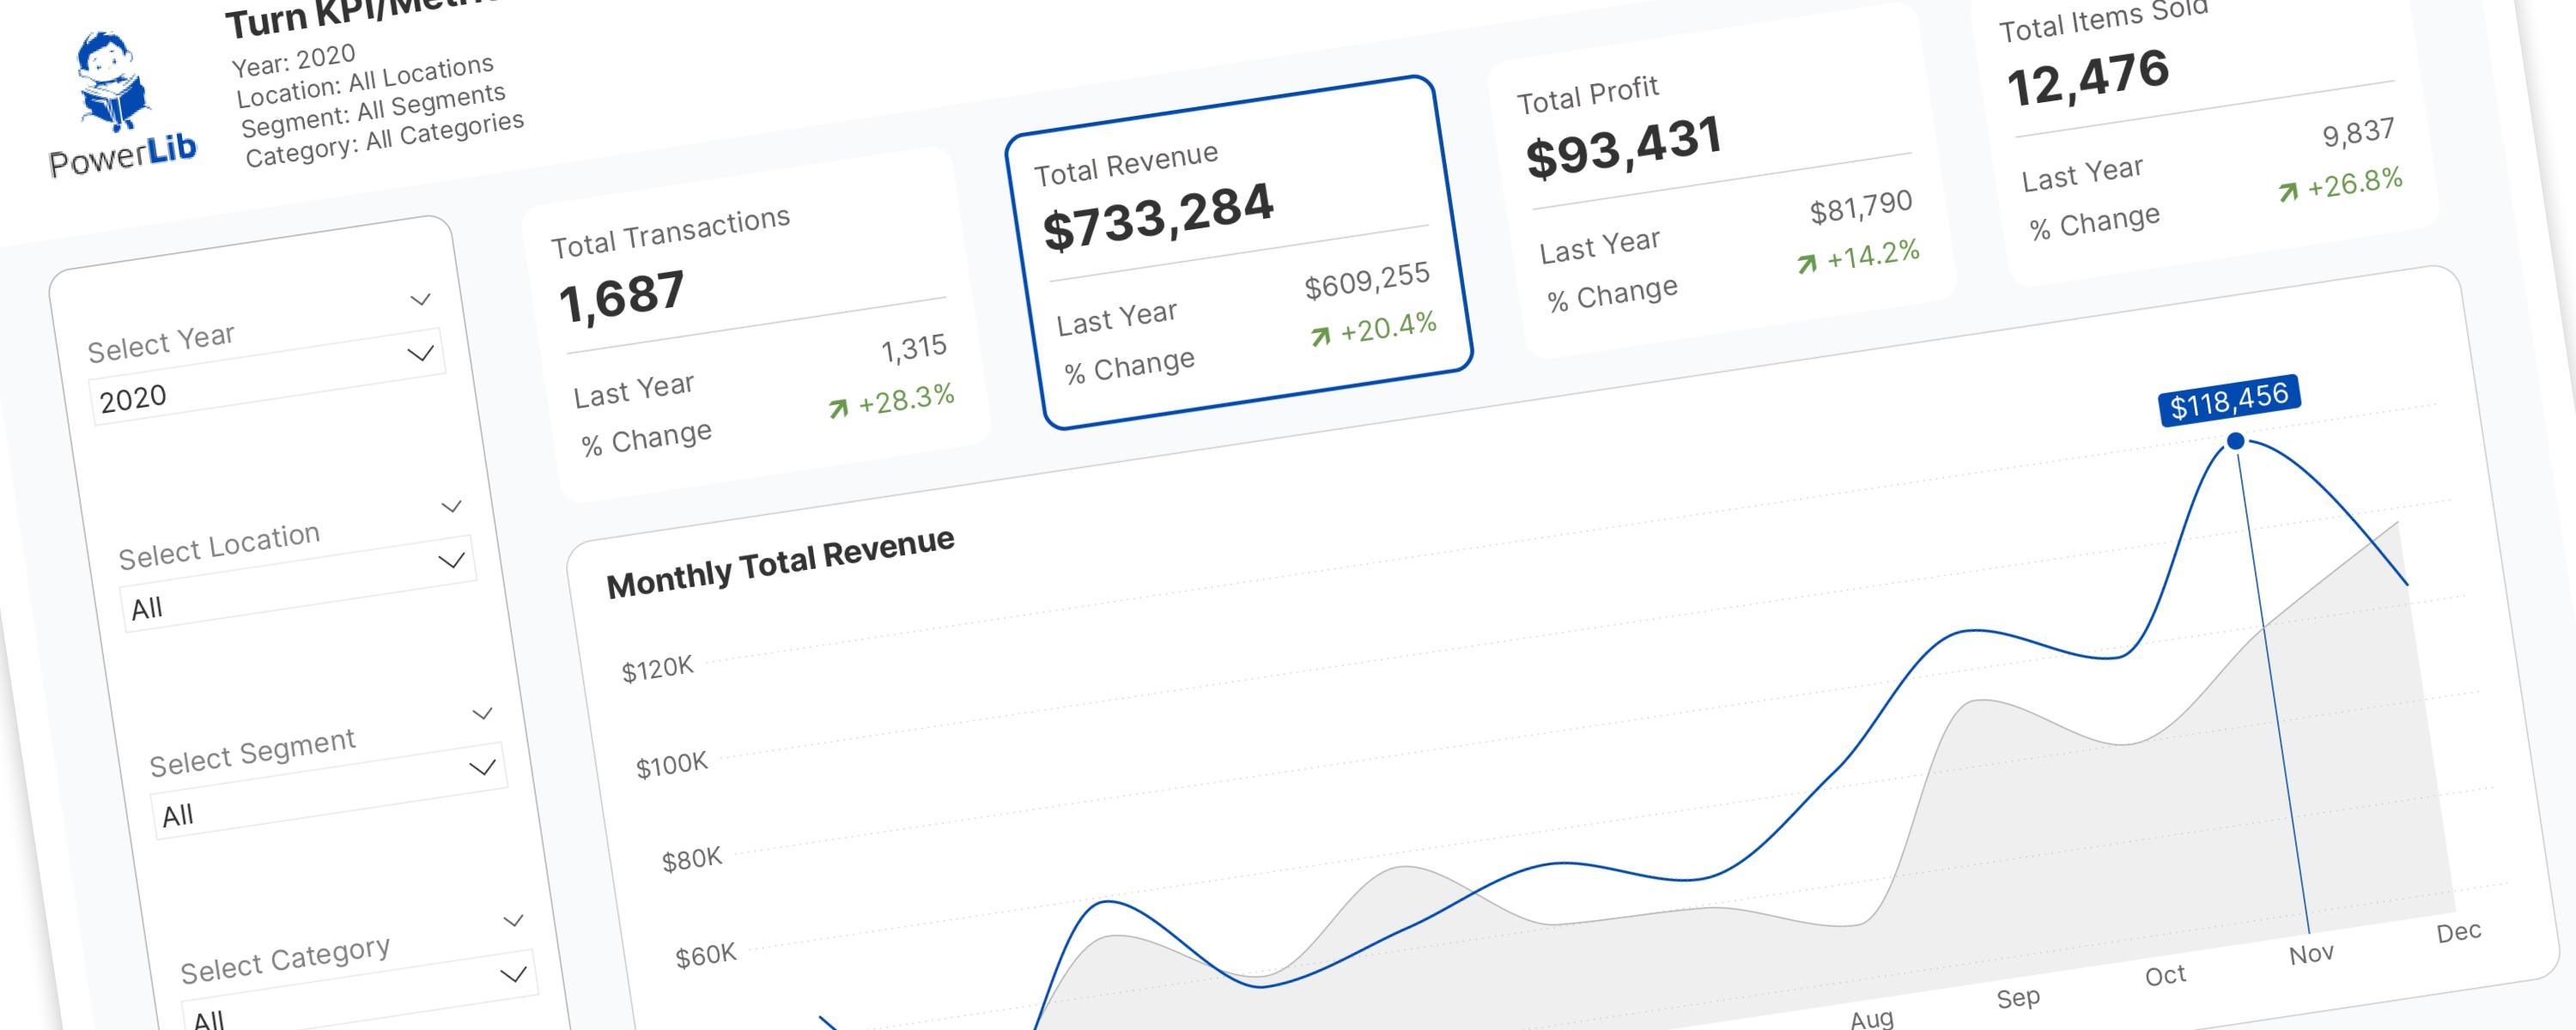
In the world of Power BI, Key Performance Indicator (KPI) and metric cards are essential.
Scatter PlotMember-Only
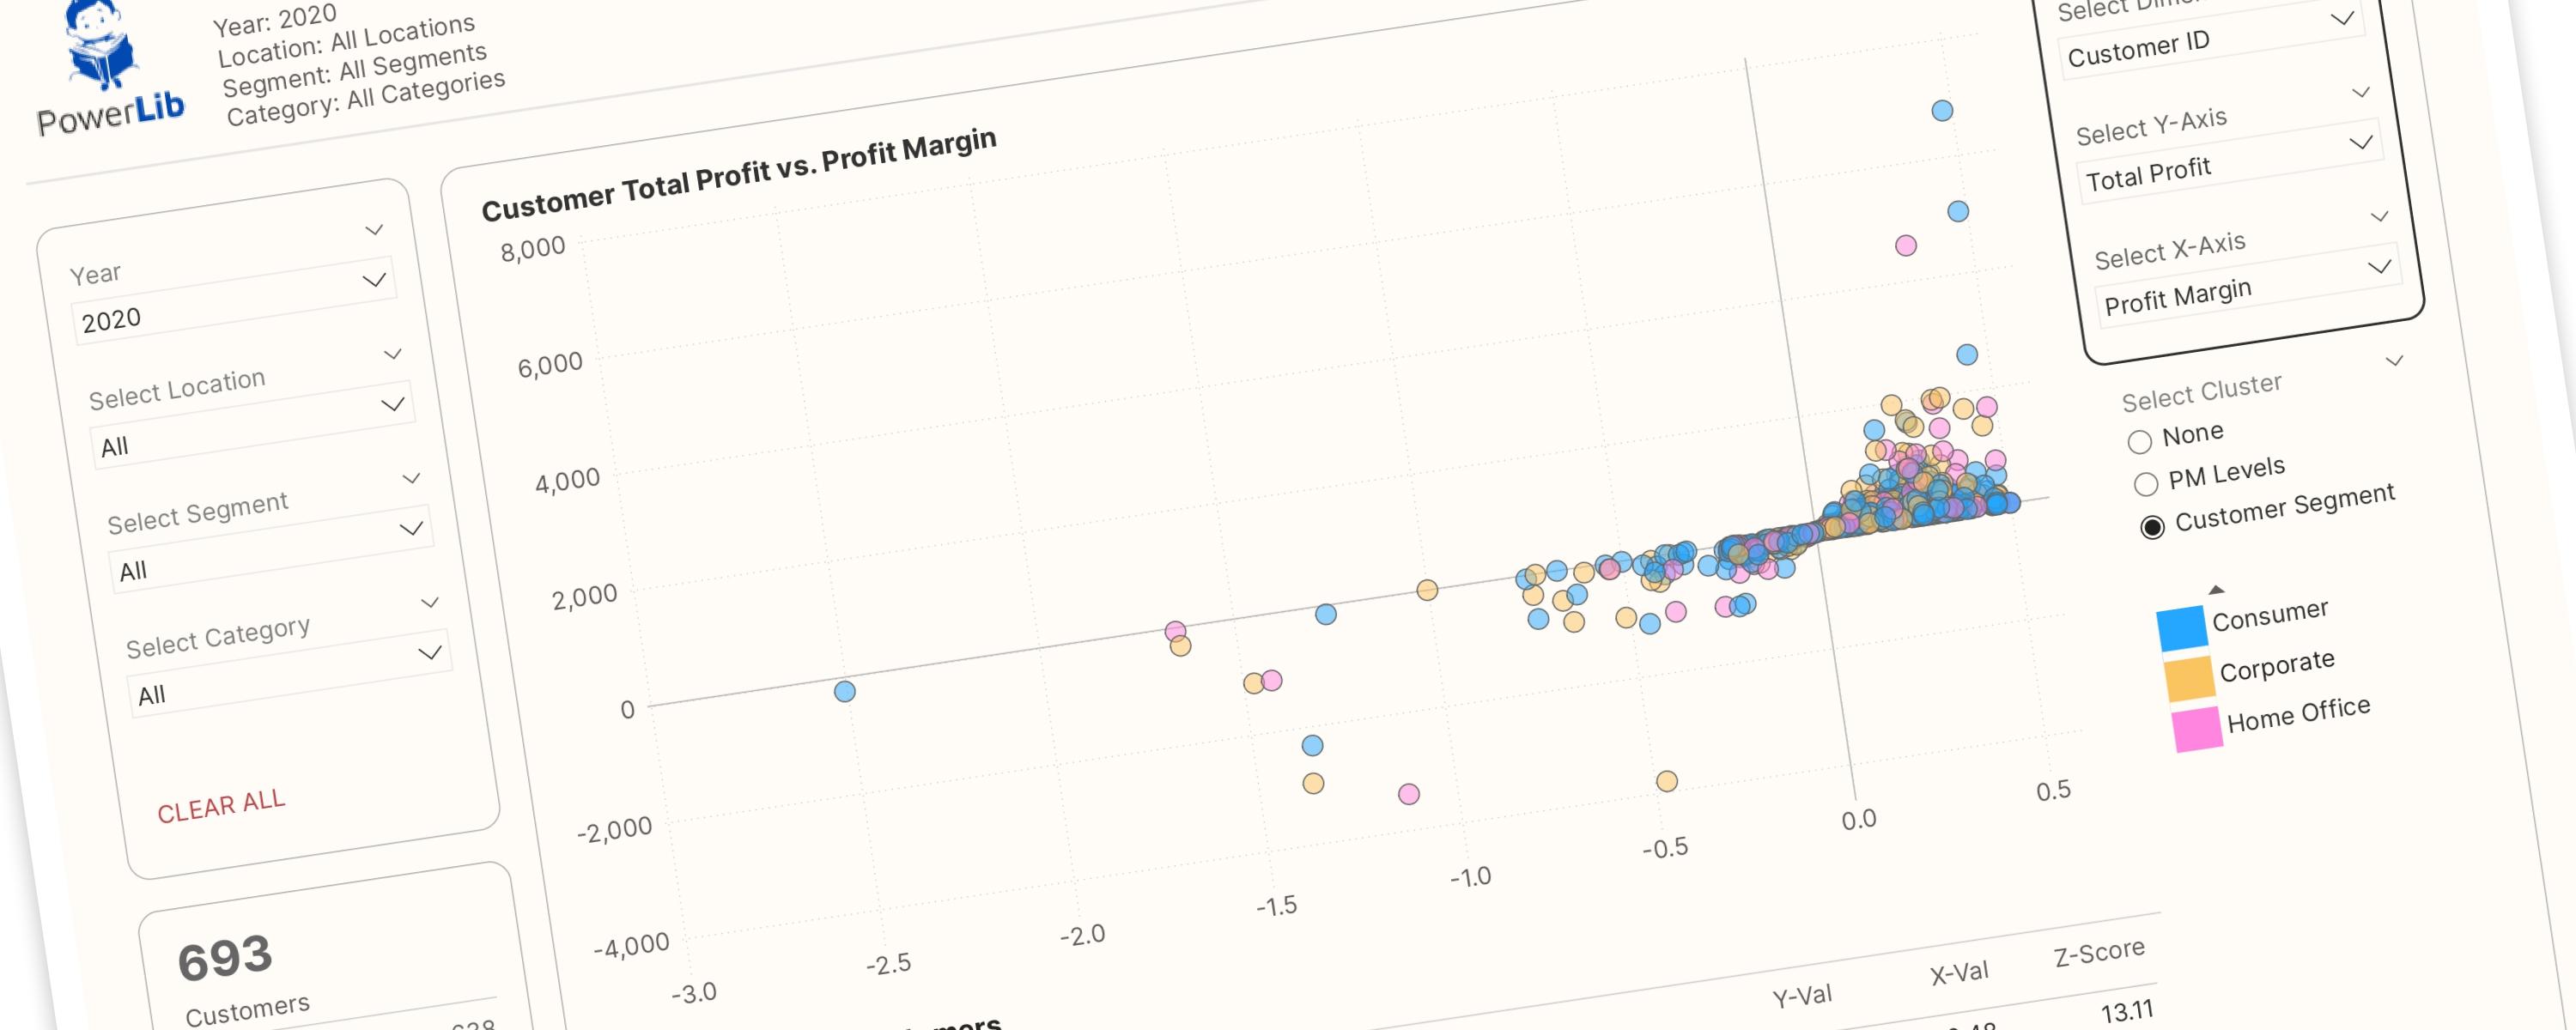
This interactive scatter plot is designed to empower users to interactively explore relationships between different dimensions and metrics. Key features include:
LineFree
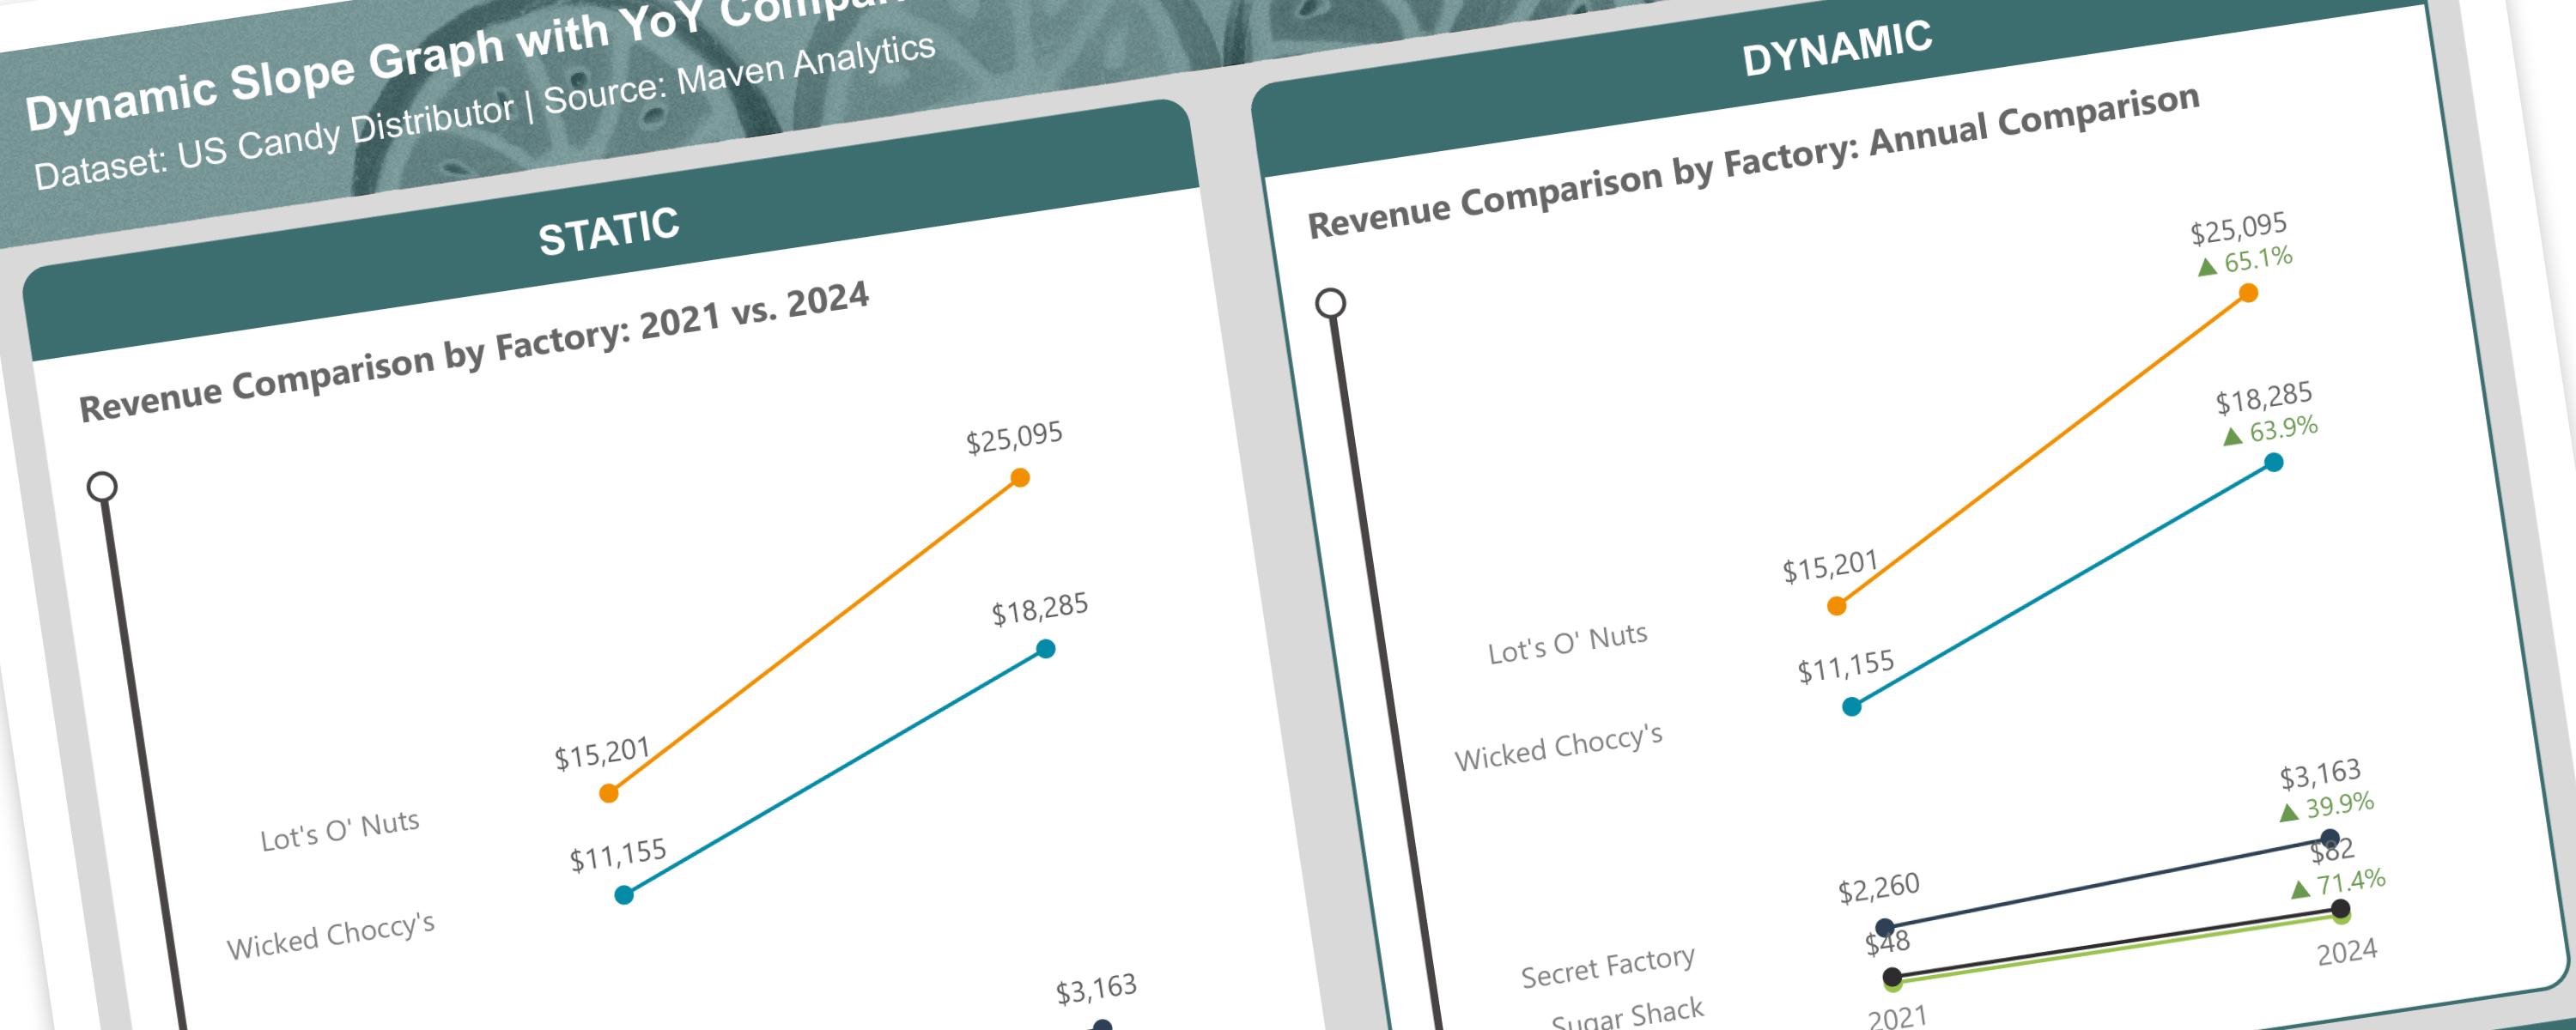
A slope graph is a type of line chart that shows changes between two points in time or two different states.