LineMember-Only
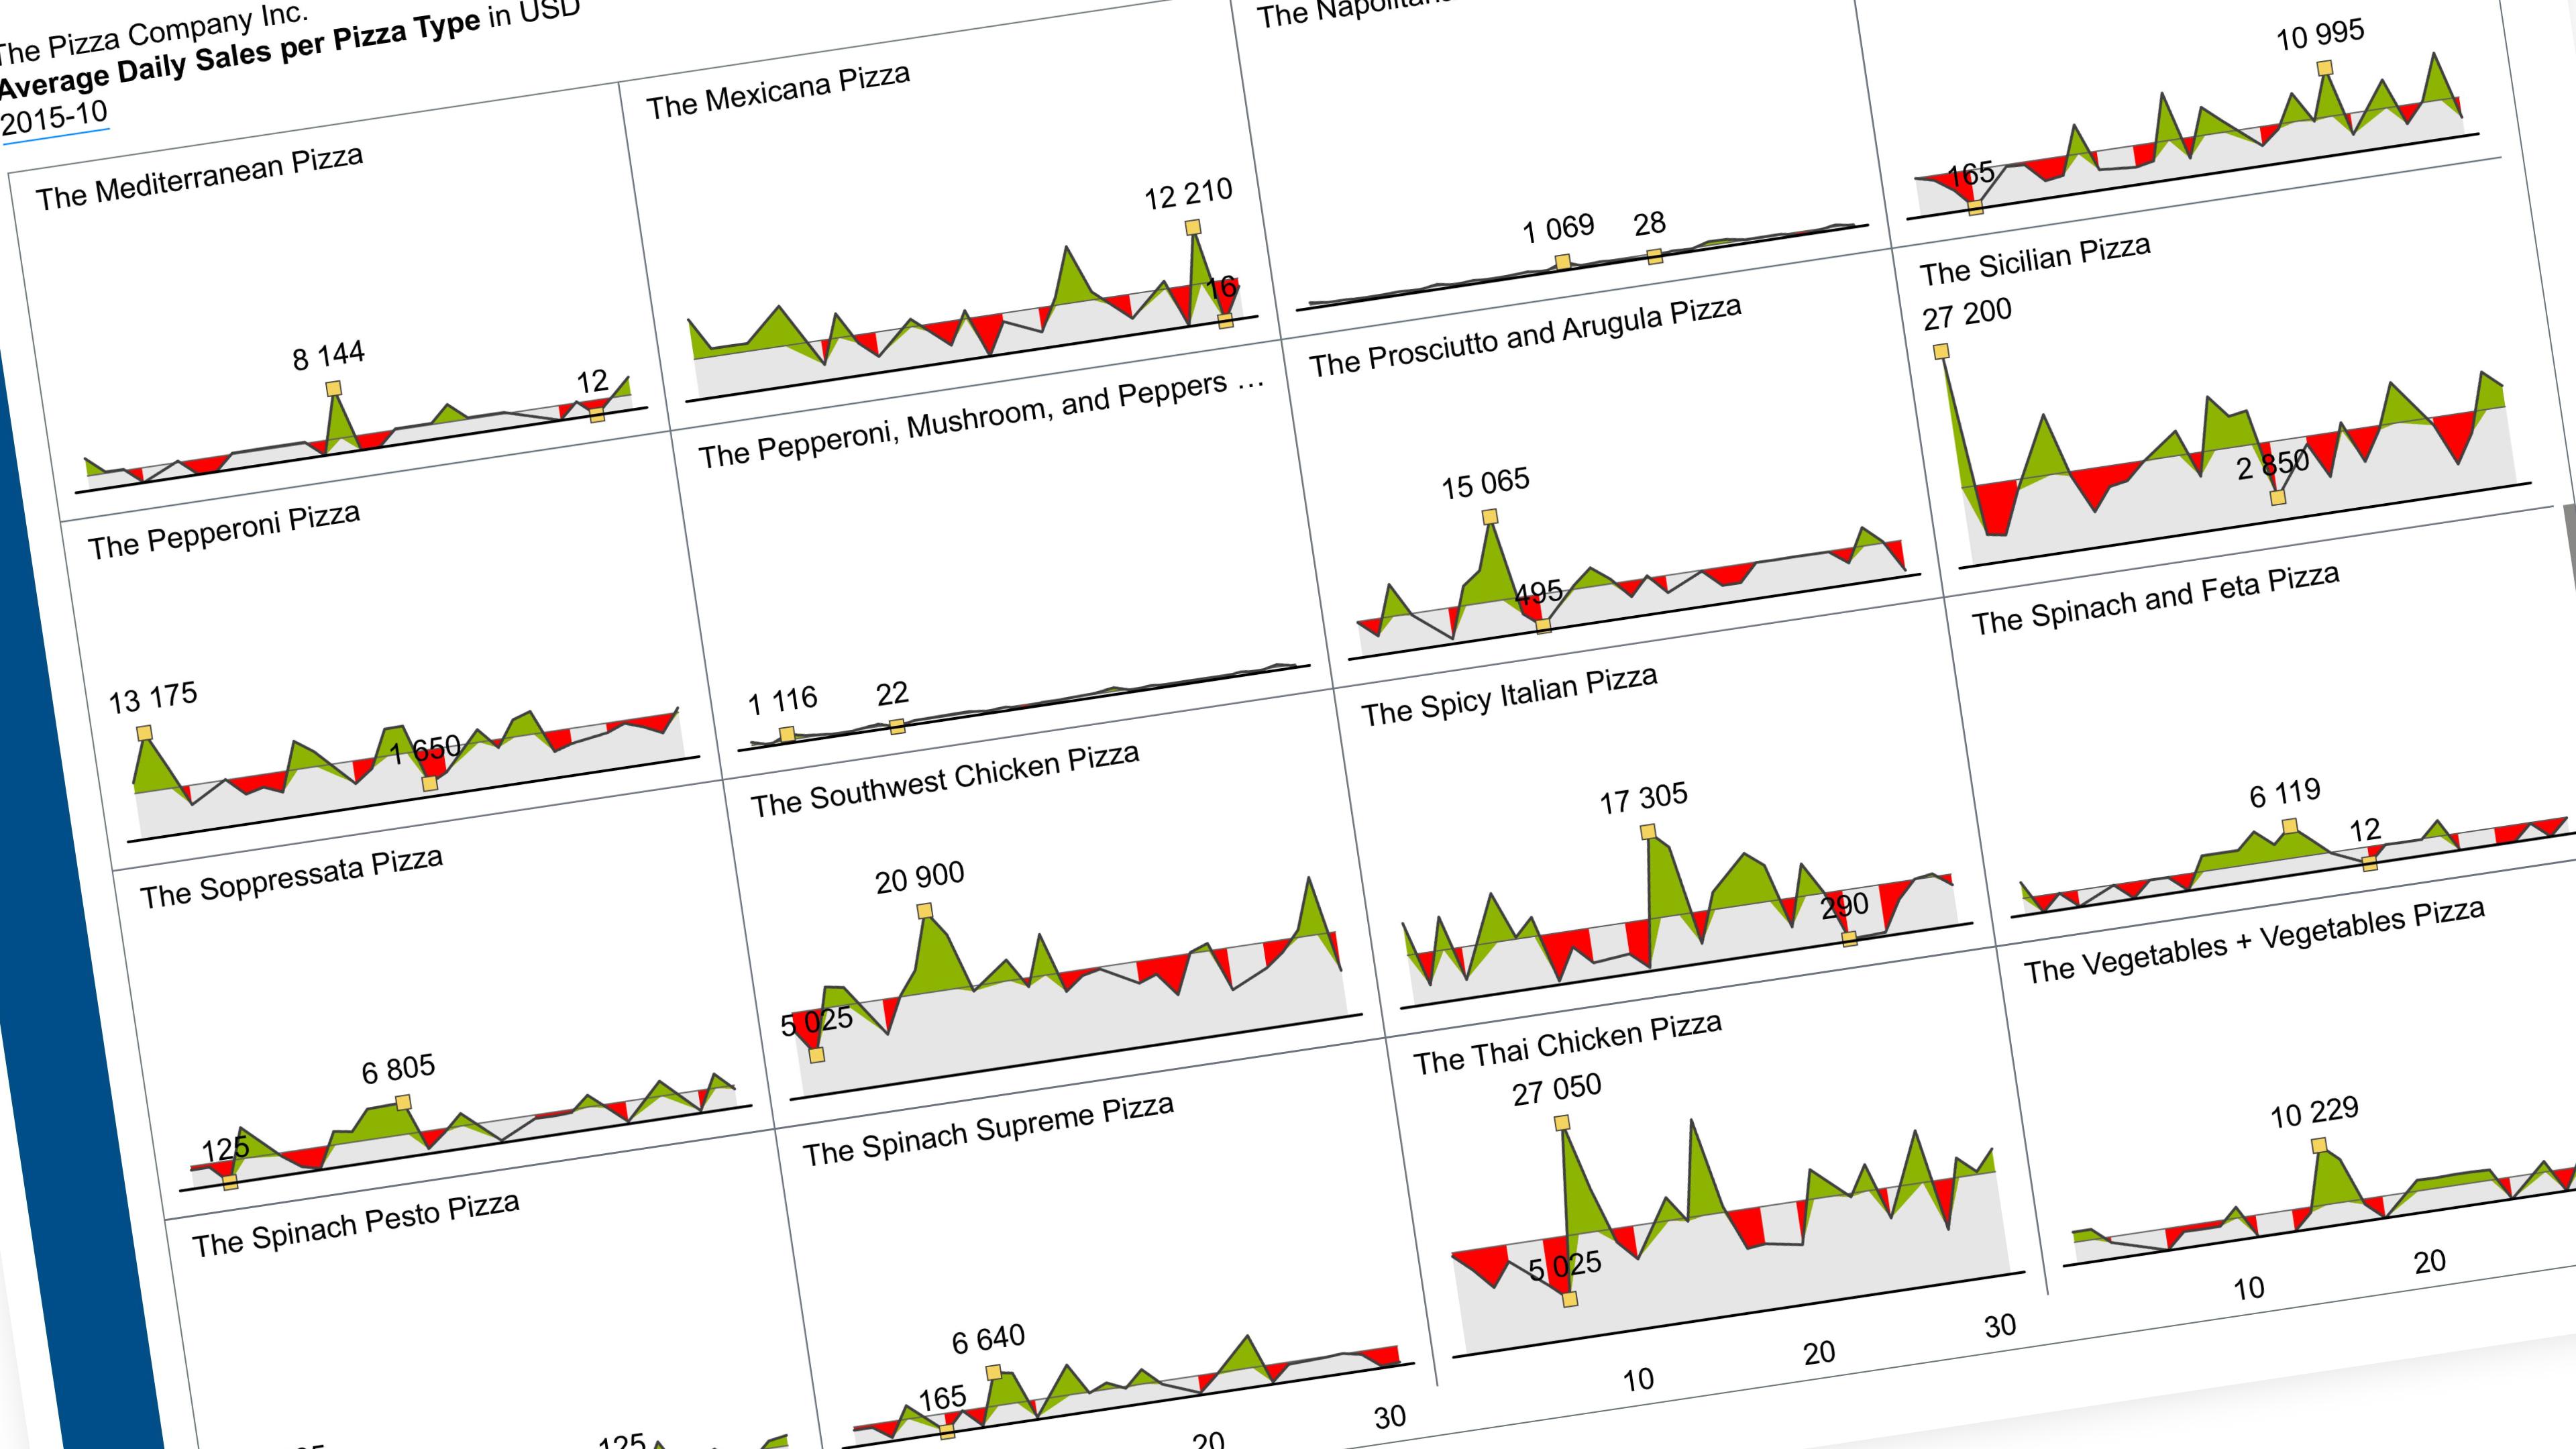
Small Multiples to Show Daily Trends Across Many Categories (Part 1)
Show one metric’s daily trend, one small chart per category, all on the same scale.
12 July 202610 min read
Documented Power BI techniques — the model change, the DAX, and the exact visual settings. Most are free to read; the rest come with the model files for members.
LineMember-Only
Show one metric’s daily trend, one small chart per category, all on the same scale.
LineMember-Only
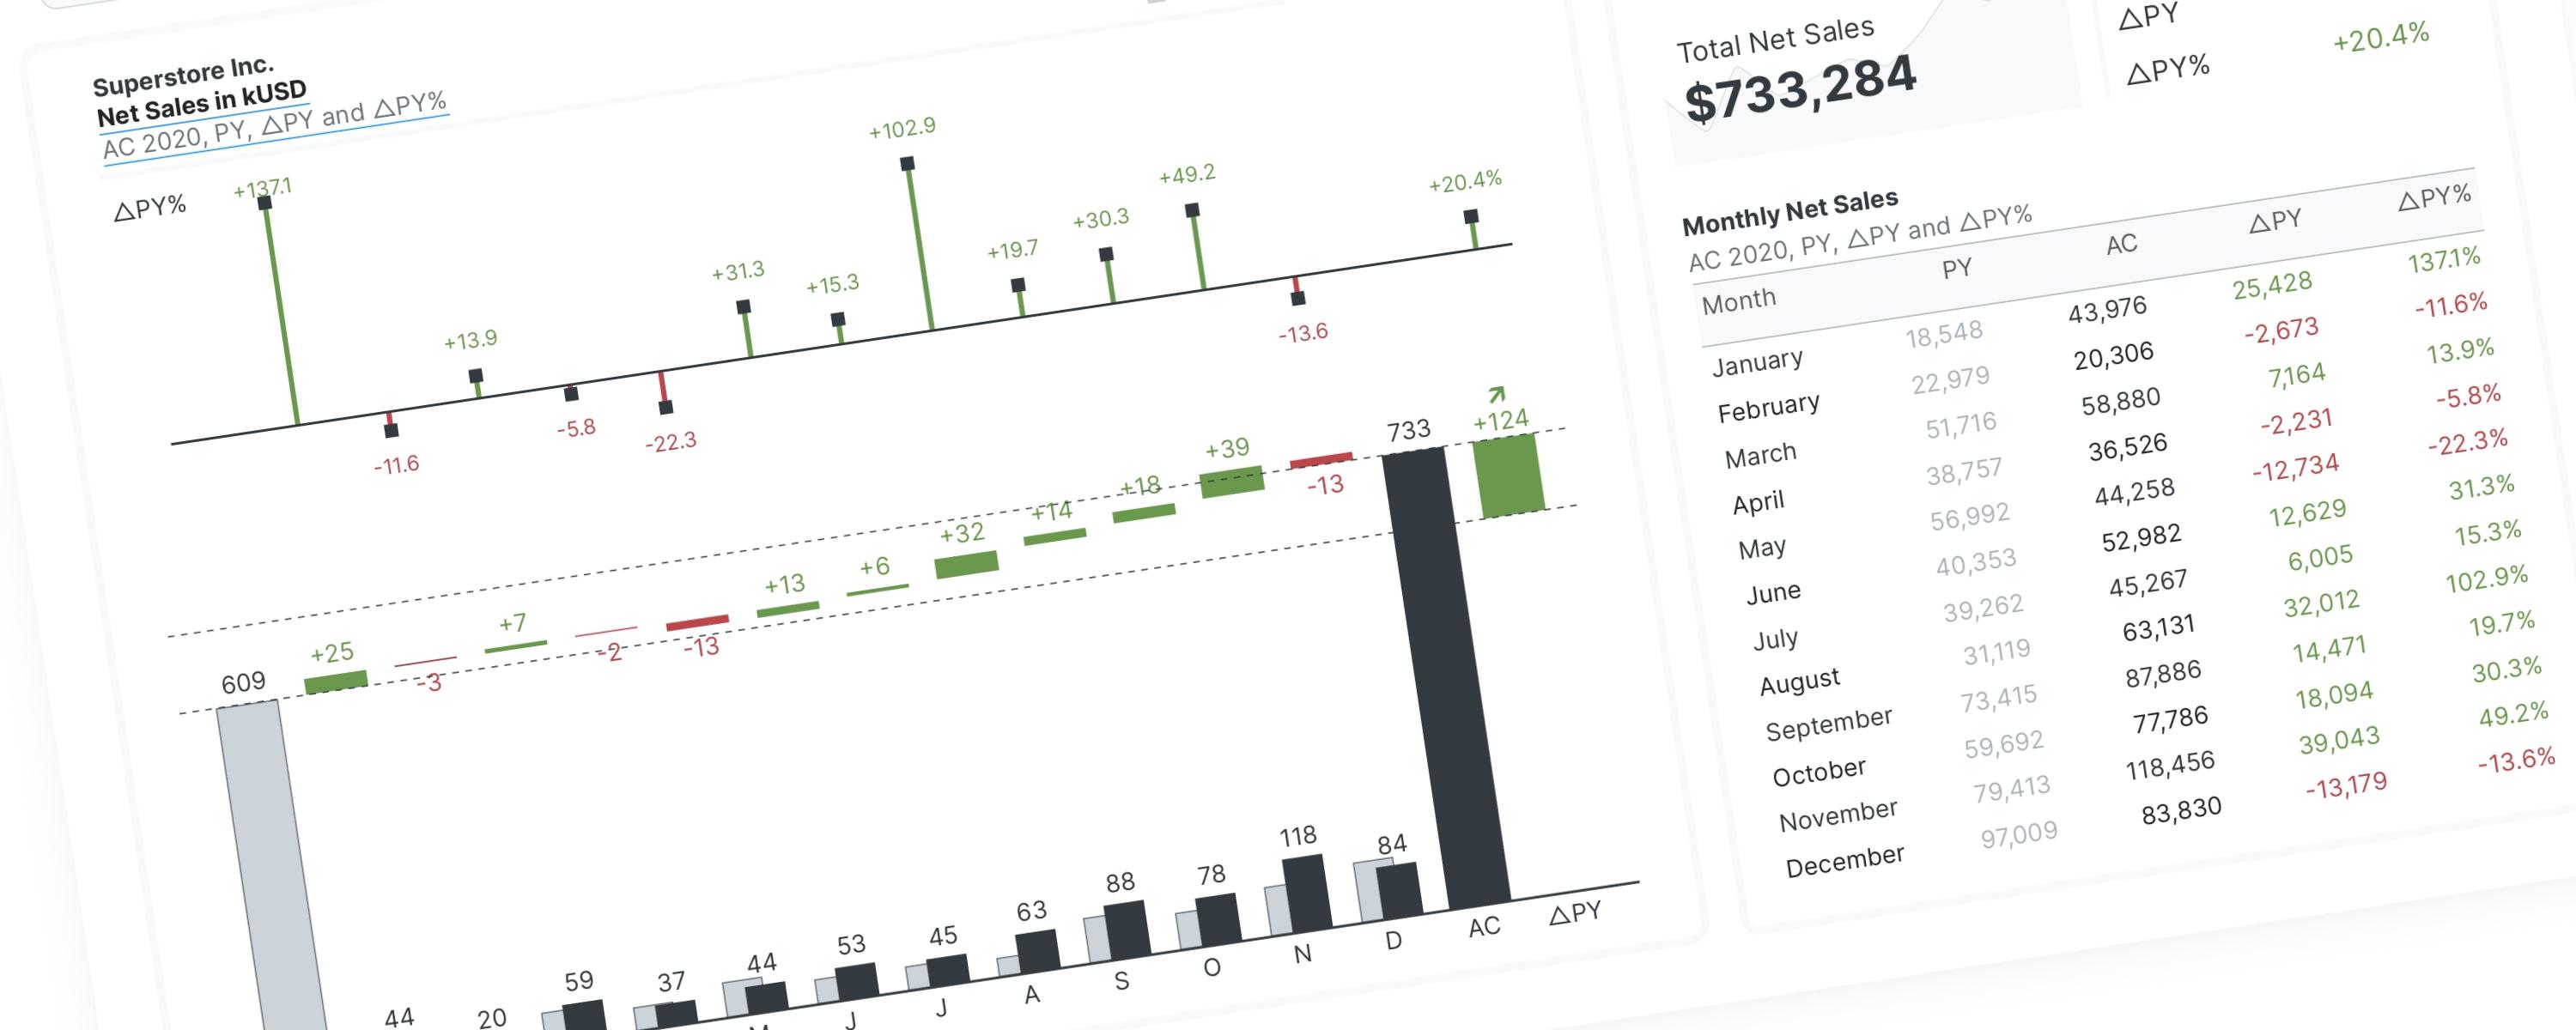
You can find my explanation of the IBCS horizontal waterfall chart's construction logic in Power BI on LinkedIn:
LineMember-Only
The DAX measures used here have been improved and modified for better readability and performance. </Callout>