LineFree
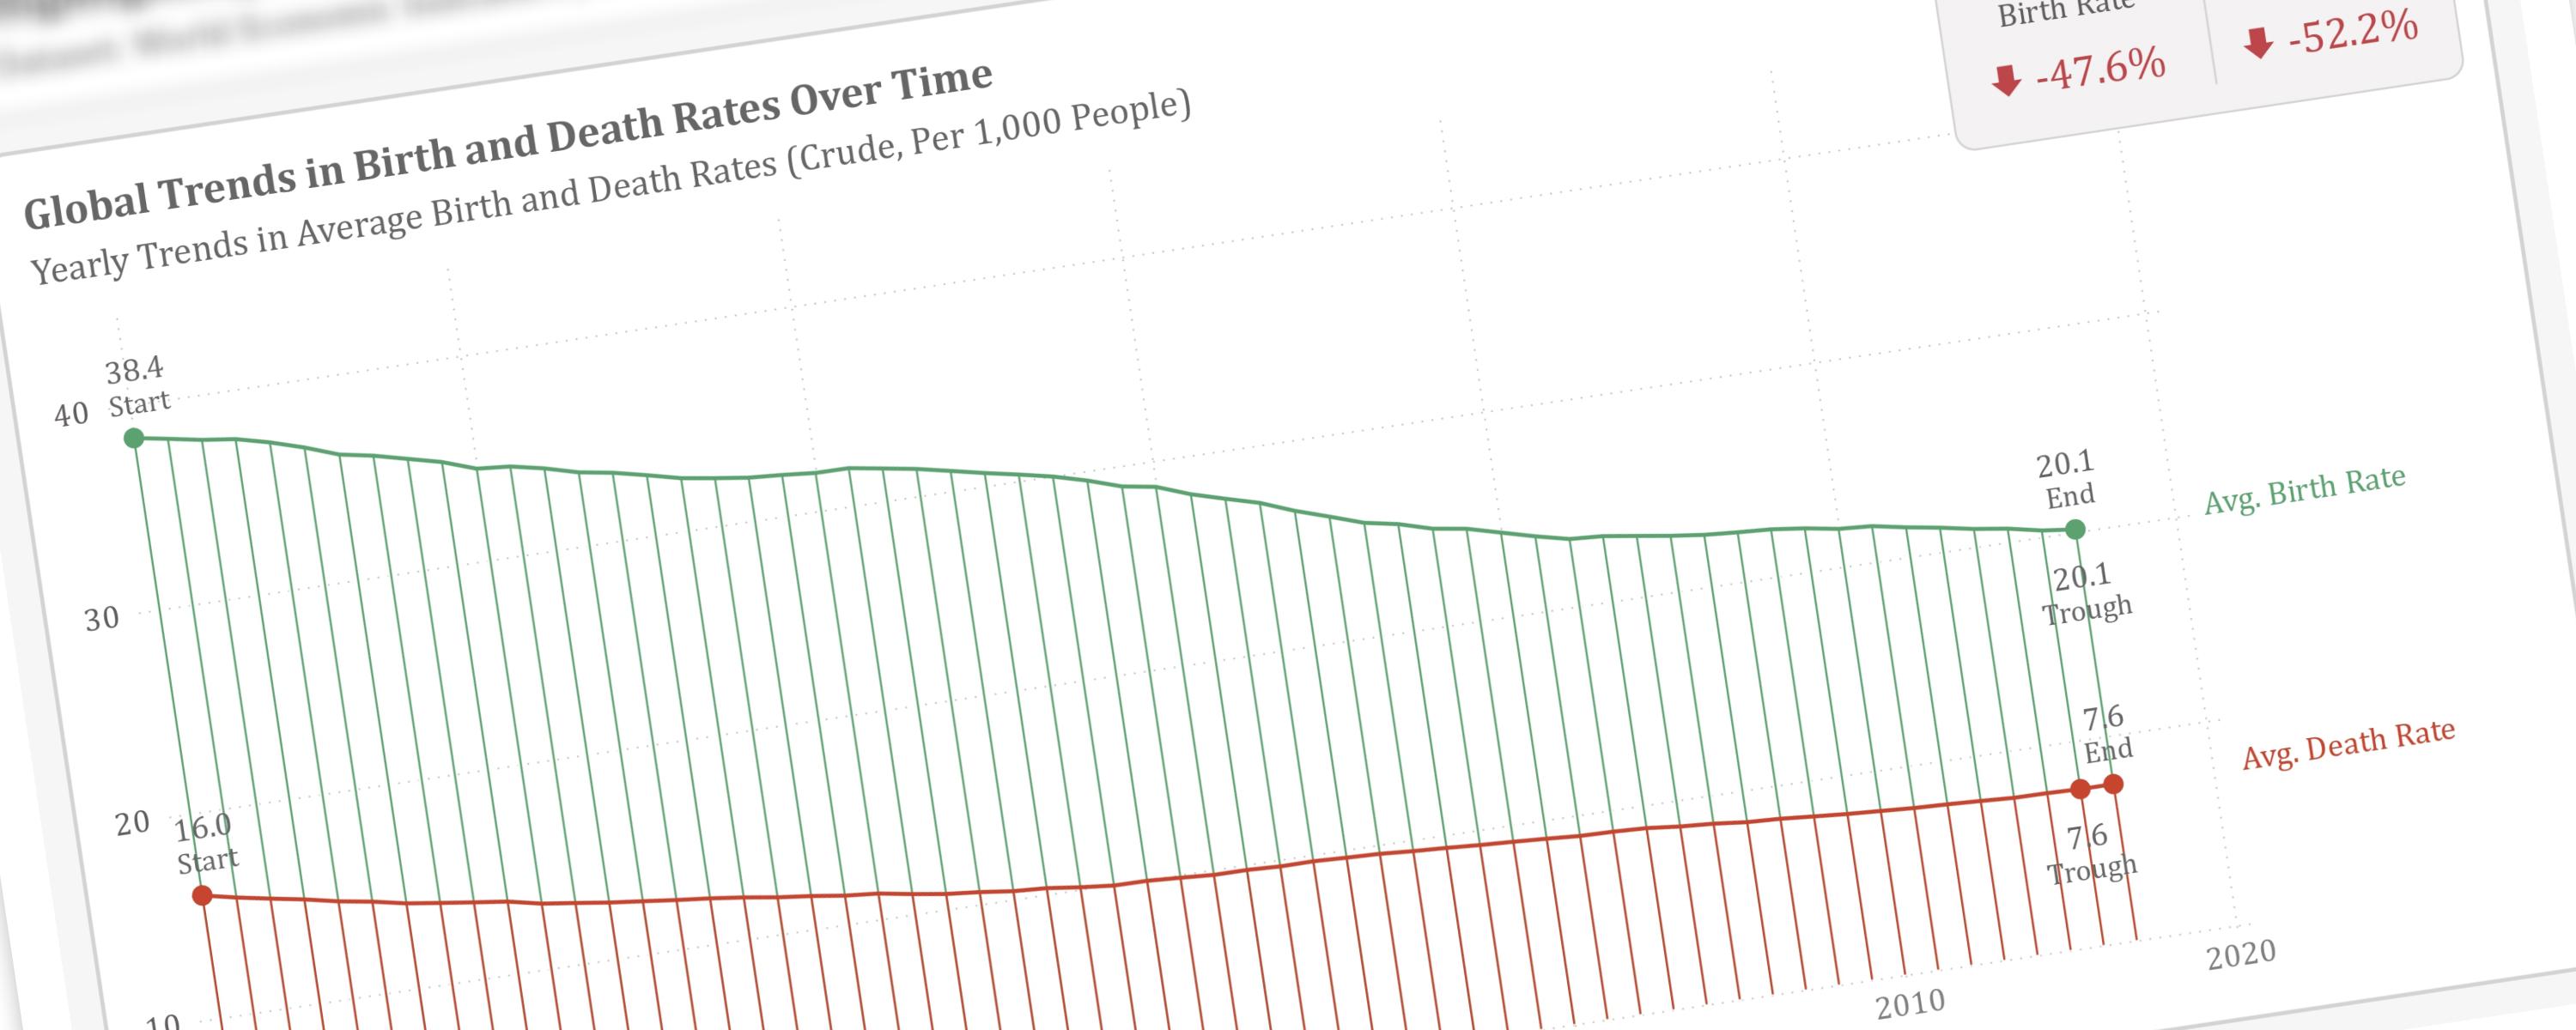
Highlighting Specific Values in a Line/Area Chart
This article will guide you through the process of visually emphasizing key data points within a line chart.
29 September 202511 min read
Documented Power BI techniques — the model change, the DAX, and the exact visual settings. Most are free to read; the rest come with the model files for members.
LineFree
This article will guide you through the process of visually emphasizing key data points within a line chart.
Matrix/TableFree
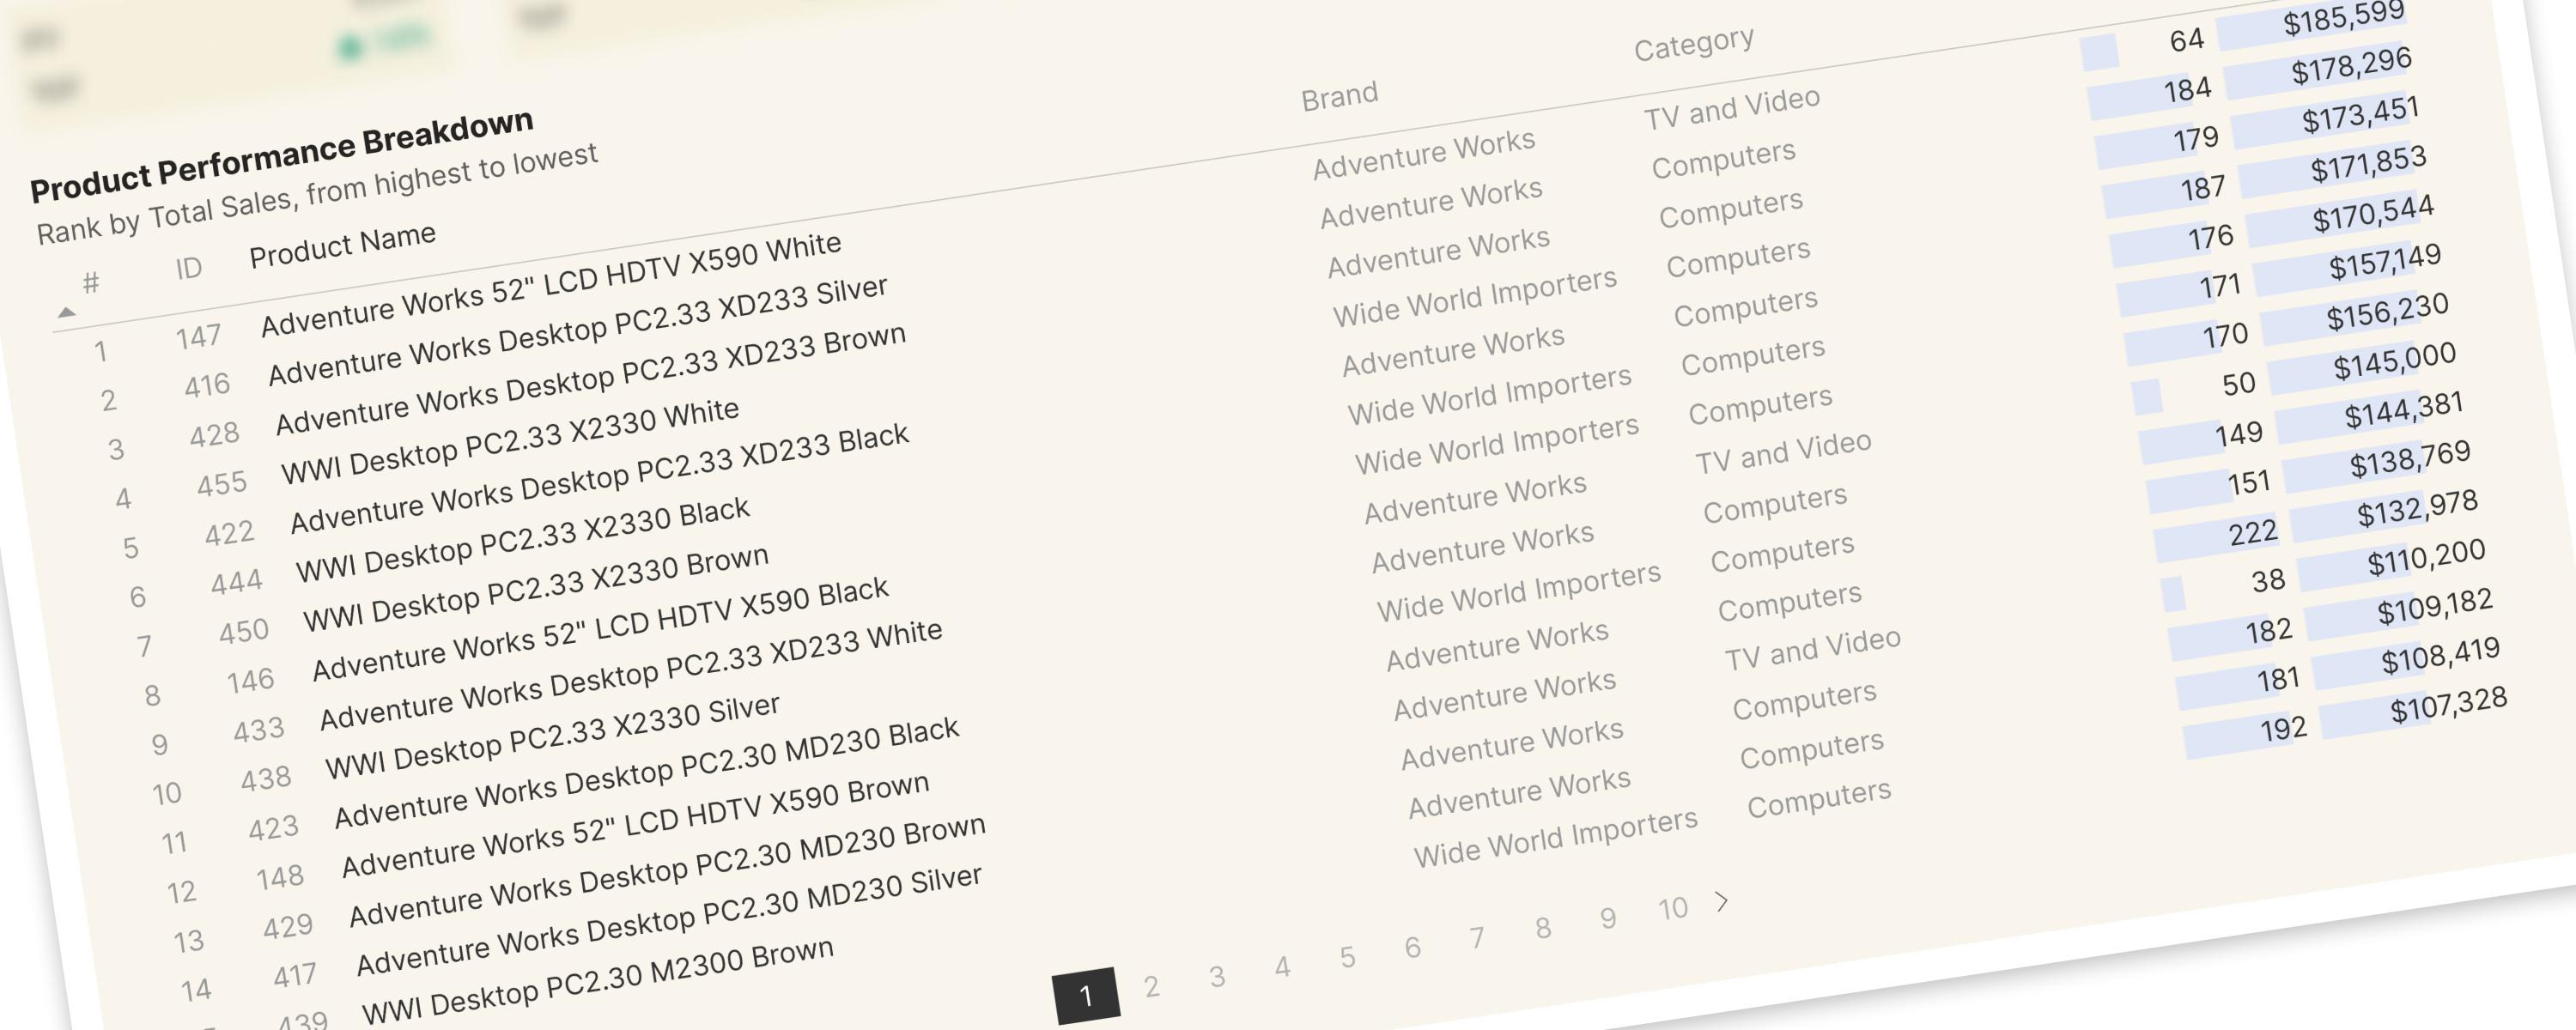
For the improved version, please refer to the following documentation page:
Metric/KPIFree
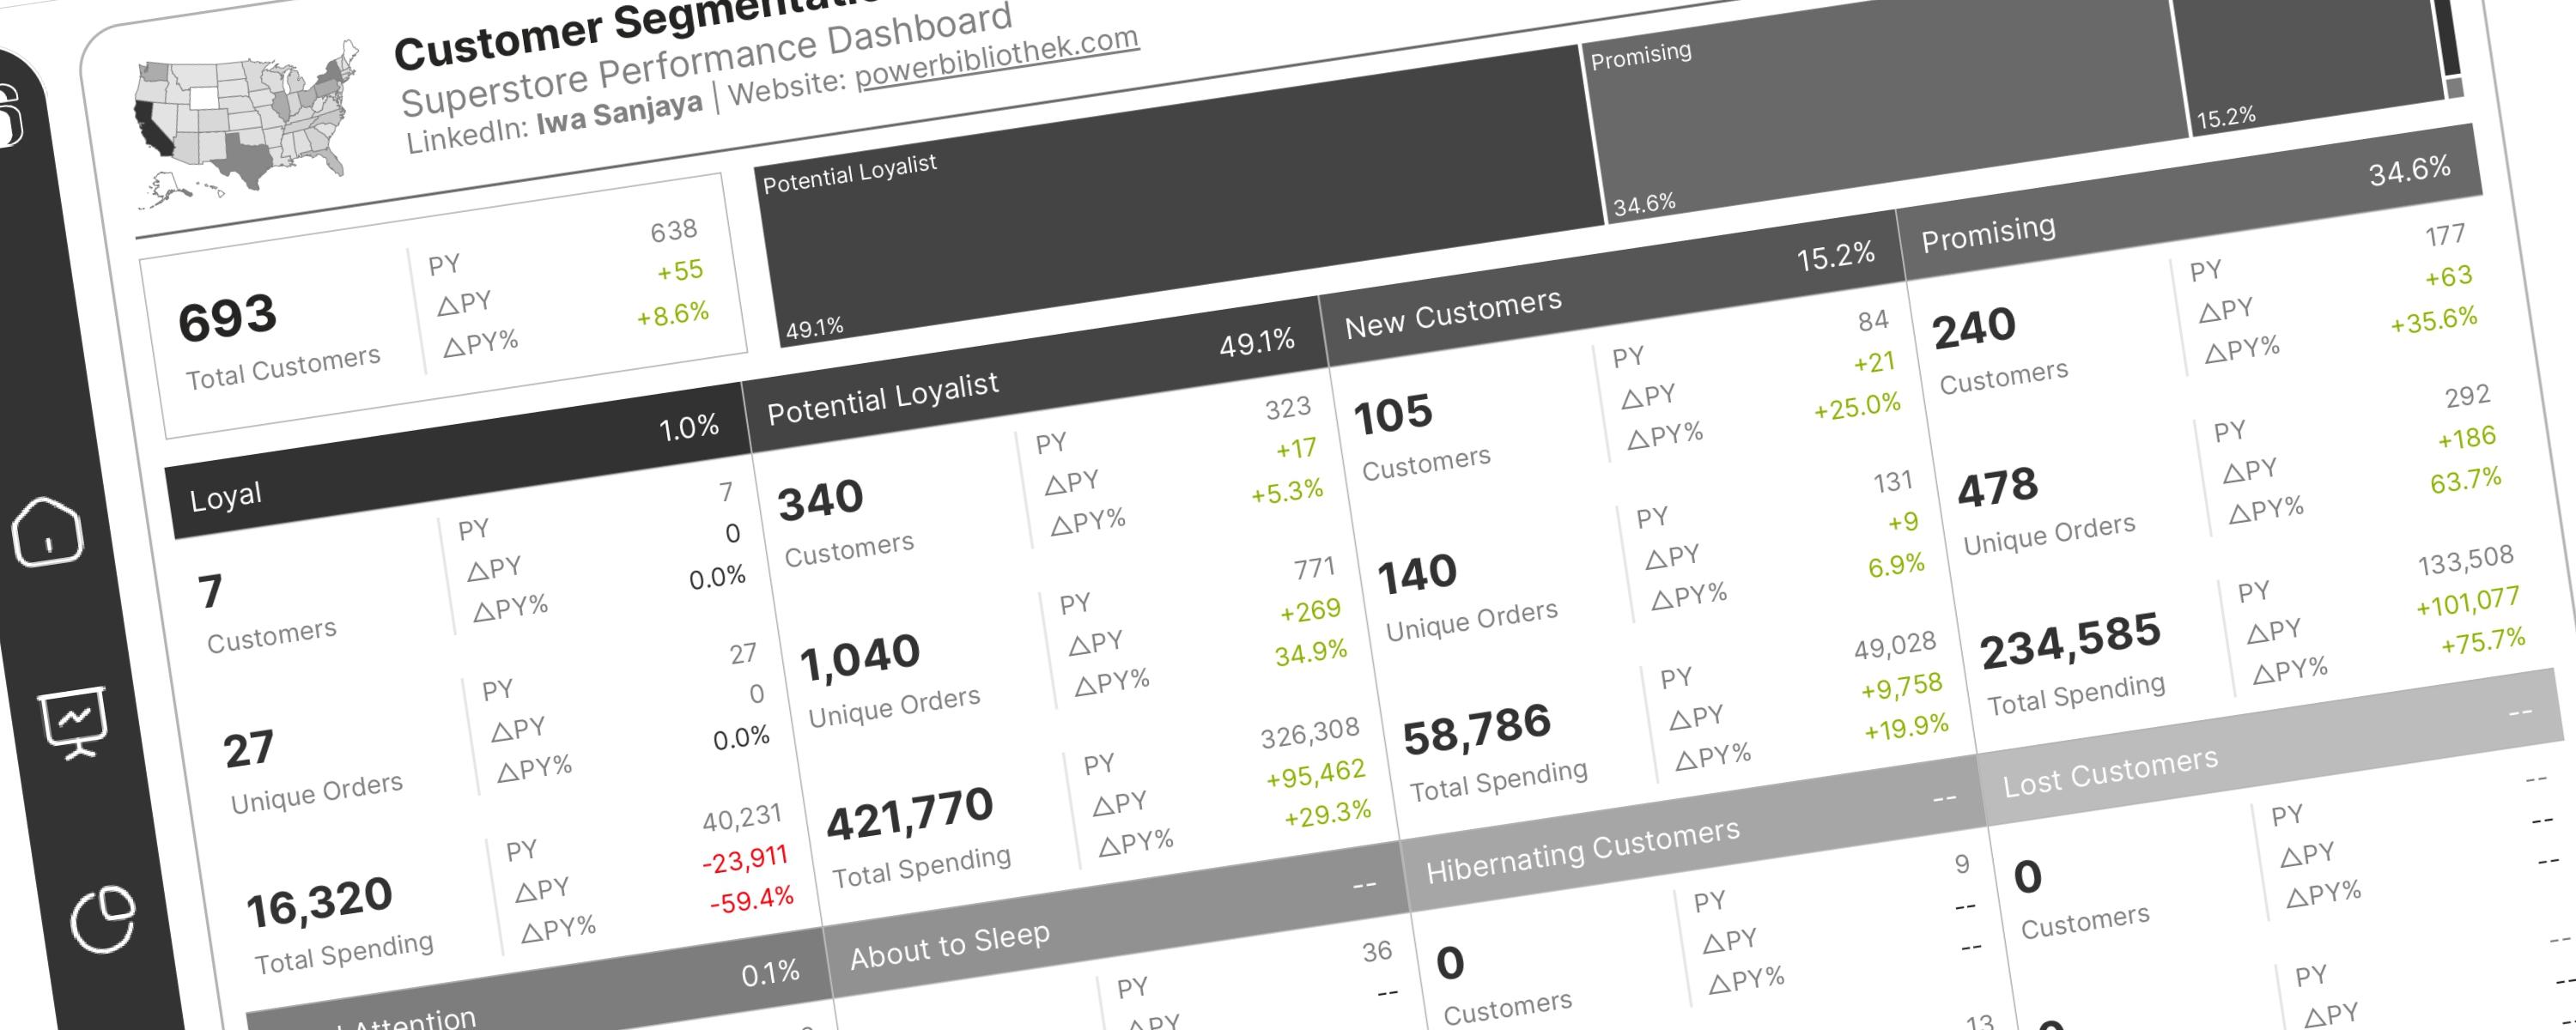
This documentation guides you on how to perform RFM analysis for customer segmentation in Power BI.
LineMember-Only
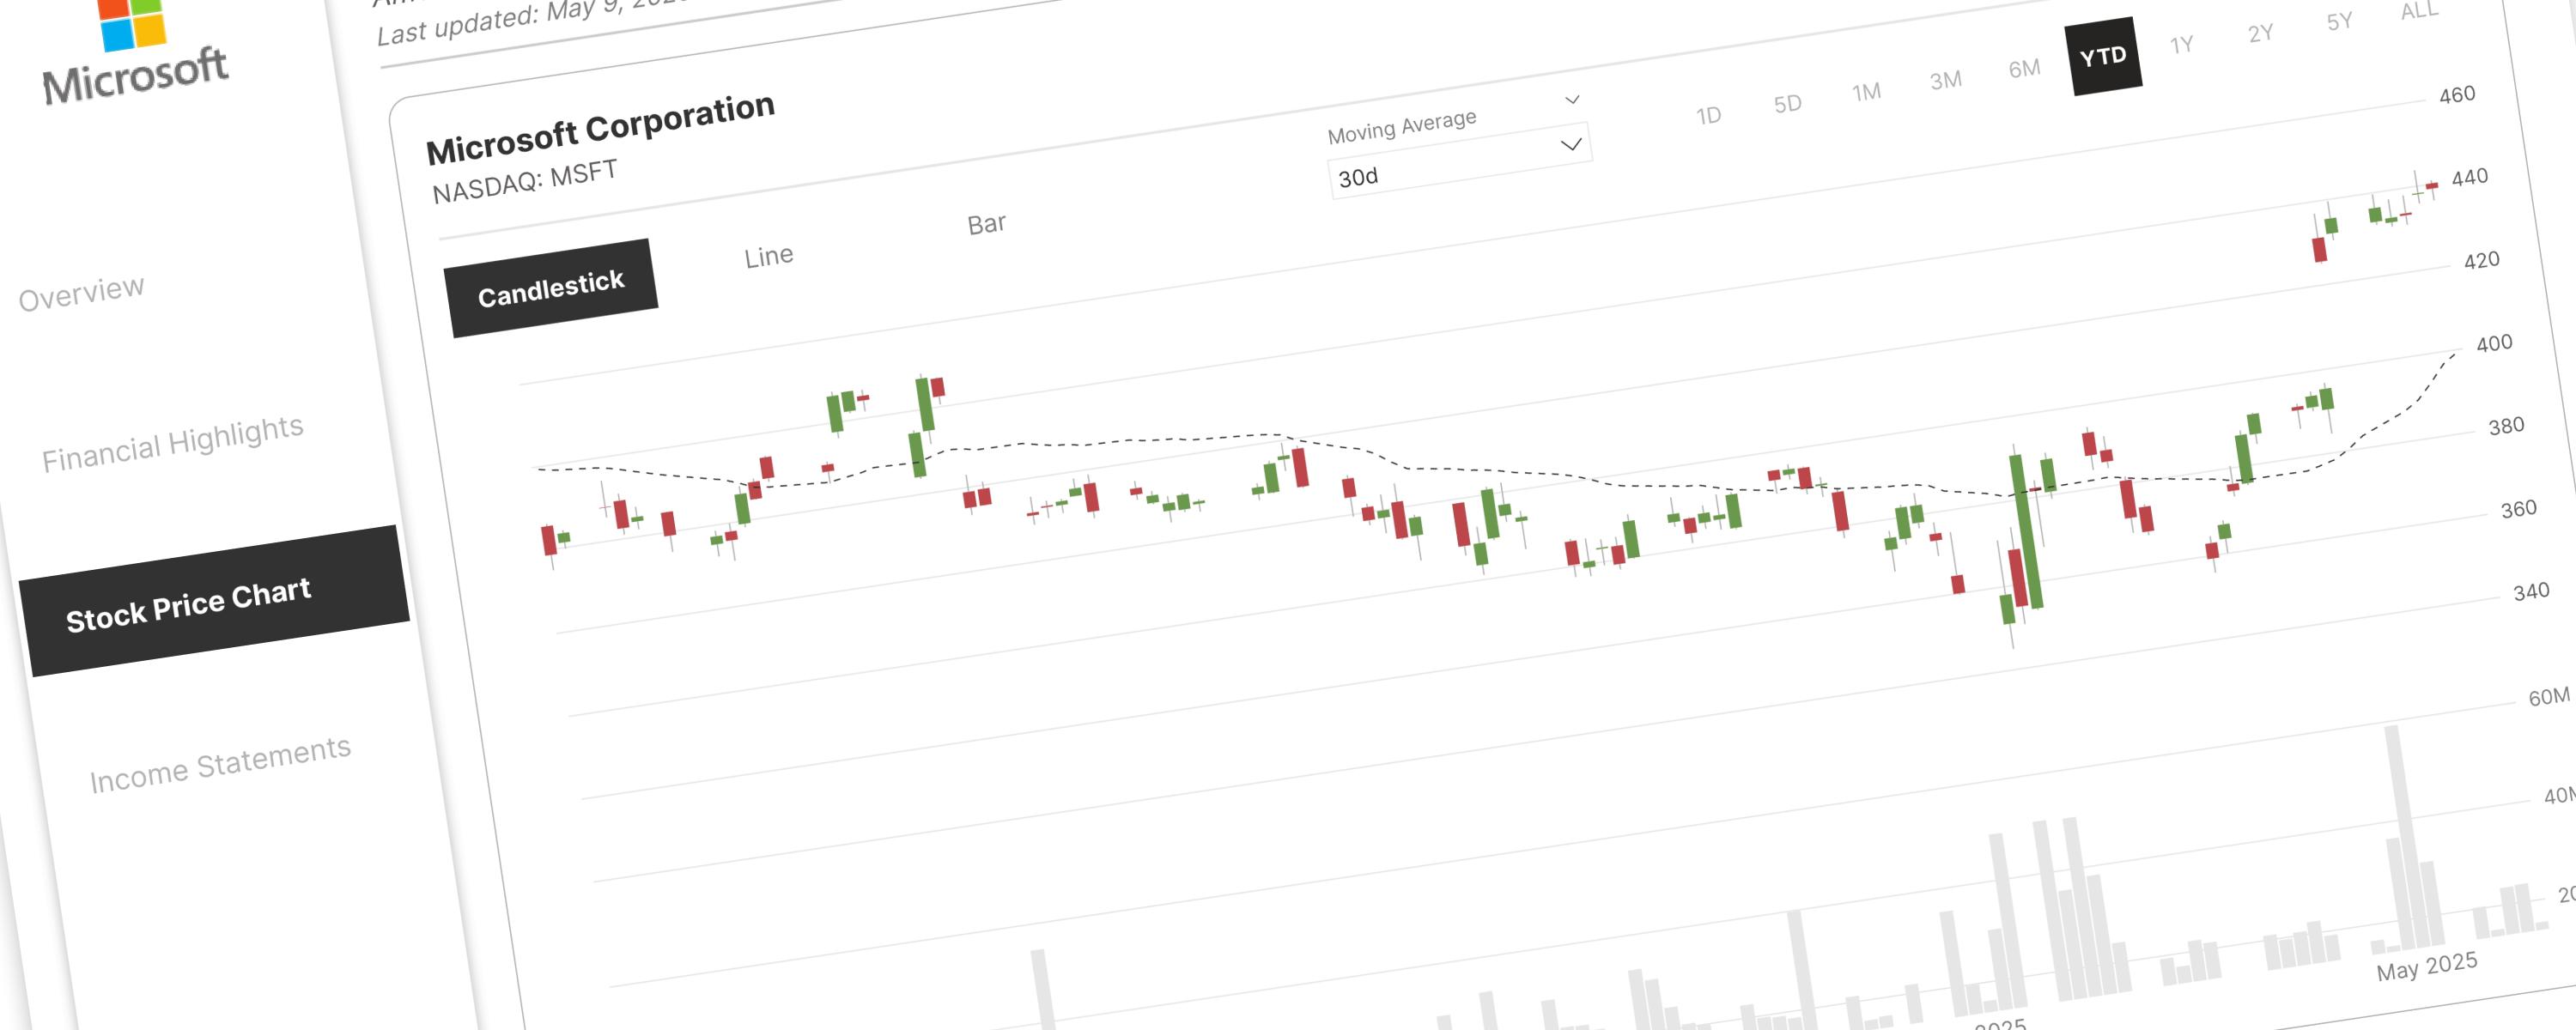
The DAX measures used here have been improved and modified for better readability and performance. </Callout>