For the improved version, please refer to the following documentation page:
The list below offers important context for understanding this documentation.
Foreword
Objectives
Problem Statement
In Power BI, pagination offers a more user-friendly alternative to scrolling when displaying numerous items in a visual. I began by implementing Bas Dohmen’s pagination technique, as described in his video tutorial. However, this approach has two key limitations.
-
Performance impact: the DAX measure used for filtering items introduced a significant performance bottleneck, increasing report loading times.
-
Ranking inconsistencies: the ranking logic did not correctly handle duplicate values. Items with identical values received the same rank, creating gaps in the ranking sequence (for example, if two items are ranked #30, the subsequent item would be ranked #32, skipping #31).
To address these issues, I developed an improved solution that provides faster loading times through a modified [Item Filter] measure and ensures sequential ranking without gaps by incorporating a secondary criterion for items with identical primary values.
Context
Documentation
Step 1: Building Table Visual
Step 2: Implementing Item Ranking
Here, I modified Bas Dohmen’s DAX measure to address the issue of duplicate ranks and skipped values. His original measure ranked items using only one criterion (total sales, in this case).
_Item Rank =
RANKX(
  ALL(Products),
  [_02 Total Sales]
)
The issue emerges when implementing the above measure. Since multiple products can have identical total sales values, they receive the same rank, causing subsequent products to skip ranks in the list.
This problem is more complex than it initially appears. While using total gross profit, total COGS, or total quantity as secondary sorting criteria might seem straightforward, it doesn’t solve our challenge. Multiple items in our dataset share identical values across all these metrics—matching sales, quantity sold, gross profit, and COGS. Therefore, we must use the product key as our secondary sorting criterion, since it uniquely identifies each item in the dataset.
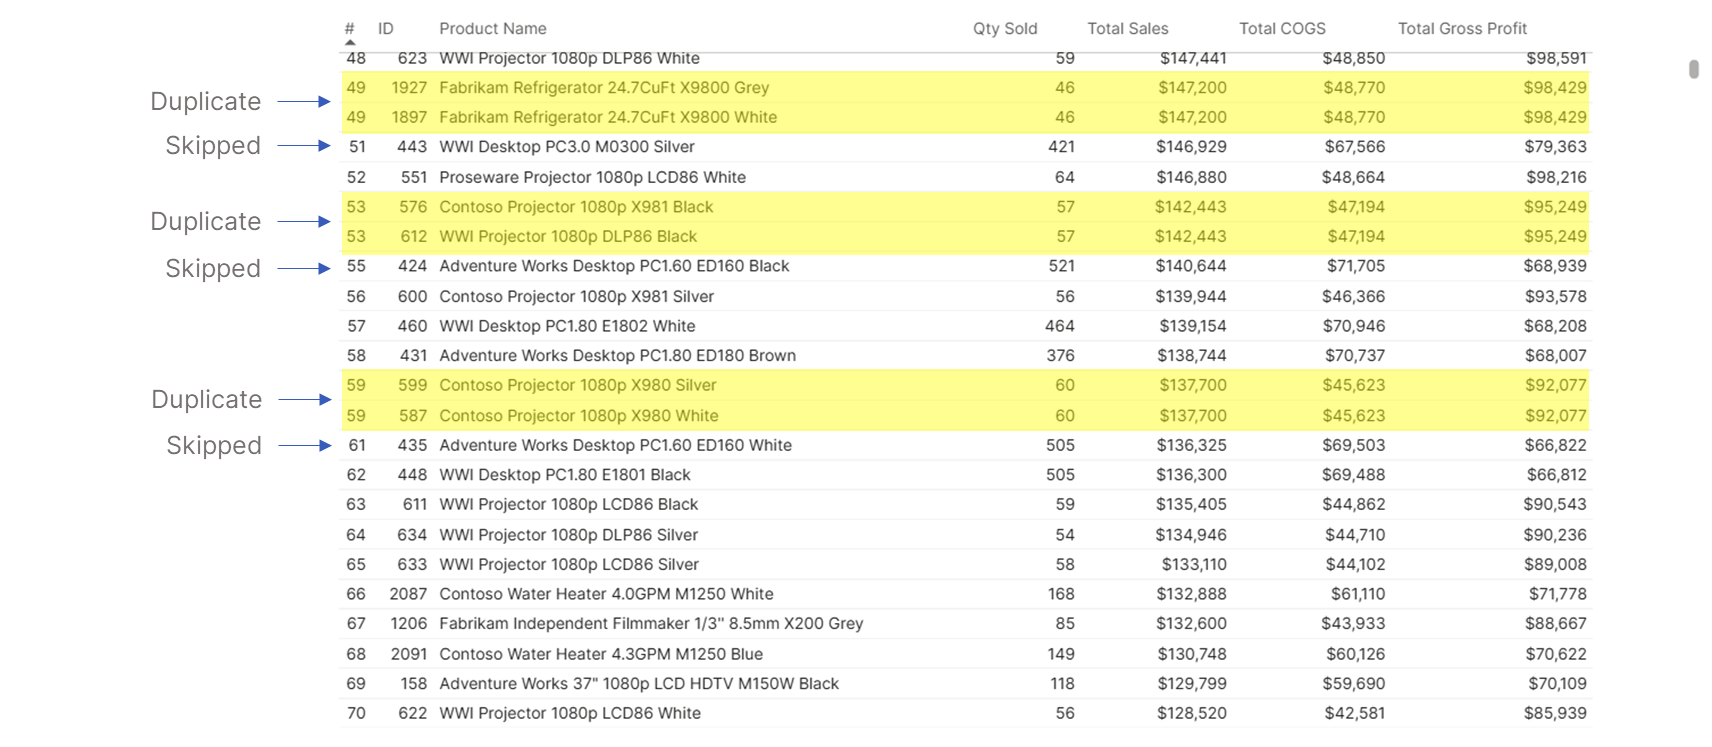 Items sharing the same total sales cause duplicate ranking and lead to subsequent items skipping ranks in the list
Since the ranking formula requires an aggregation, we will sum the product key to use it as the secondary criterion.
_08 Second Criterion for Ranking (Aggregated Product Key) = SUM(Products[ProductKey])This measure is used as a tie breaker when products have the same total sales. Because product key is unique, it will make sure that even items with duplicate sales, will have different ranks.
_05 Item Rank =
RANKX(
  ALL(Products),
  [_02 Total Sales] * 1000000 + [_08 Second Criterion for Ranking (Aggregated Product Key)],
  ,
  DESC,
  Dense
)
In summary, this DAX measure does the following:
-
Ranks products based on their total sales, with higher sales receiving higher ranks.
-
Uses the product key as a secondary criterion to break ties when products have the same total sales.
-
Assigns ranks in descending order (highest sales first).
-
Ensures that the ranks are assigned without gaps.
Multiplying it by 1,000,000 (one million) shifts the sales values significantly higher. This is done to ensure that the primary ranking criterion (total sales) has a much greater impact on the final rank than the secondary criterion.
DESC specifies that the ranking should be in descending order. This means that the product with the highest combined value (total sales * 1,000,000 + sum of product key) will receive rank 1.
Dense specifies that the ranks should be assigned without gaps. If two or more products have the same combined value, they will receive the same rank, and the next product will receive the subsequent rank (without skipping any ranks). Without the Dense argument, the next rank would skip the amount of duplicate ranks.
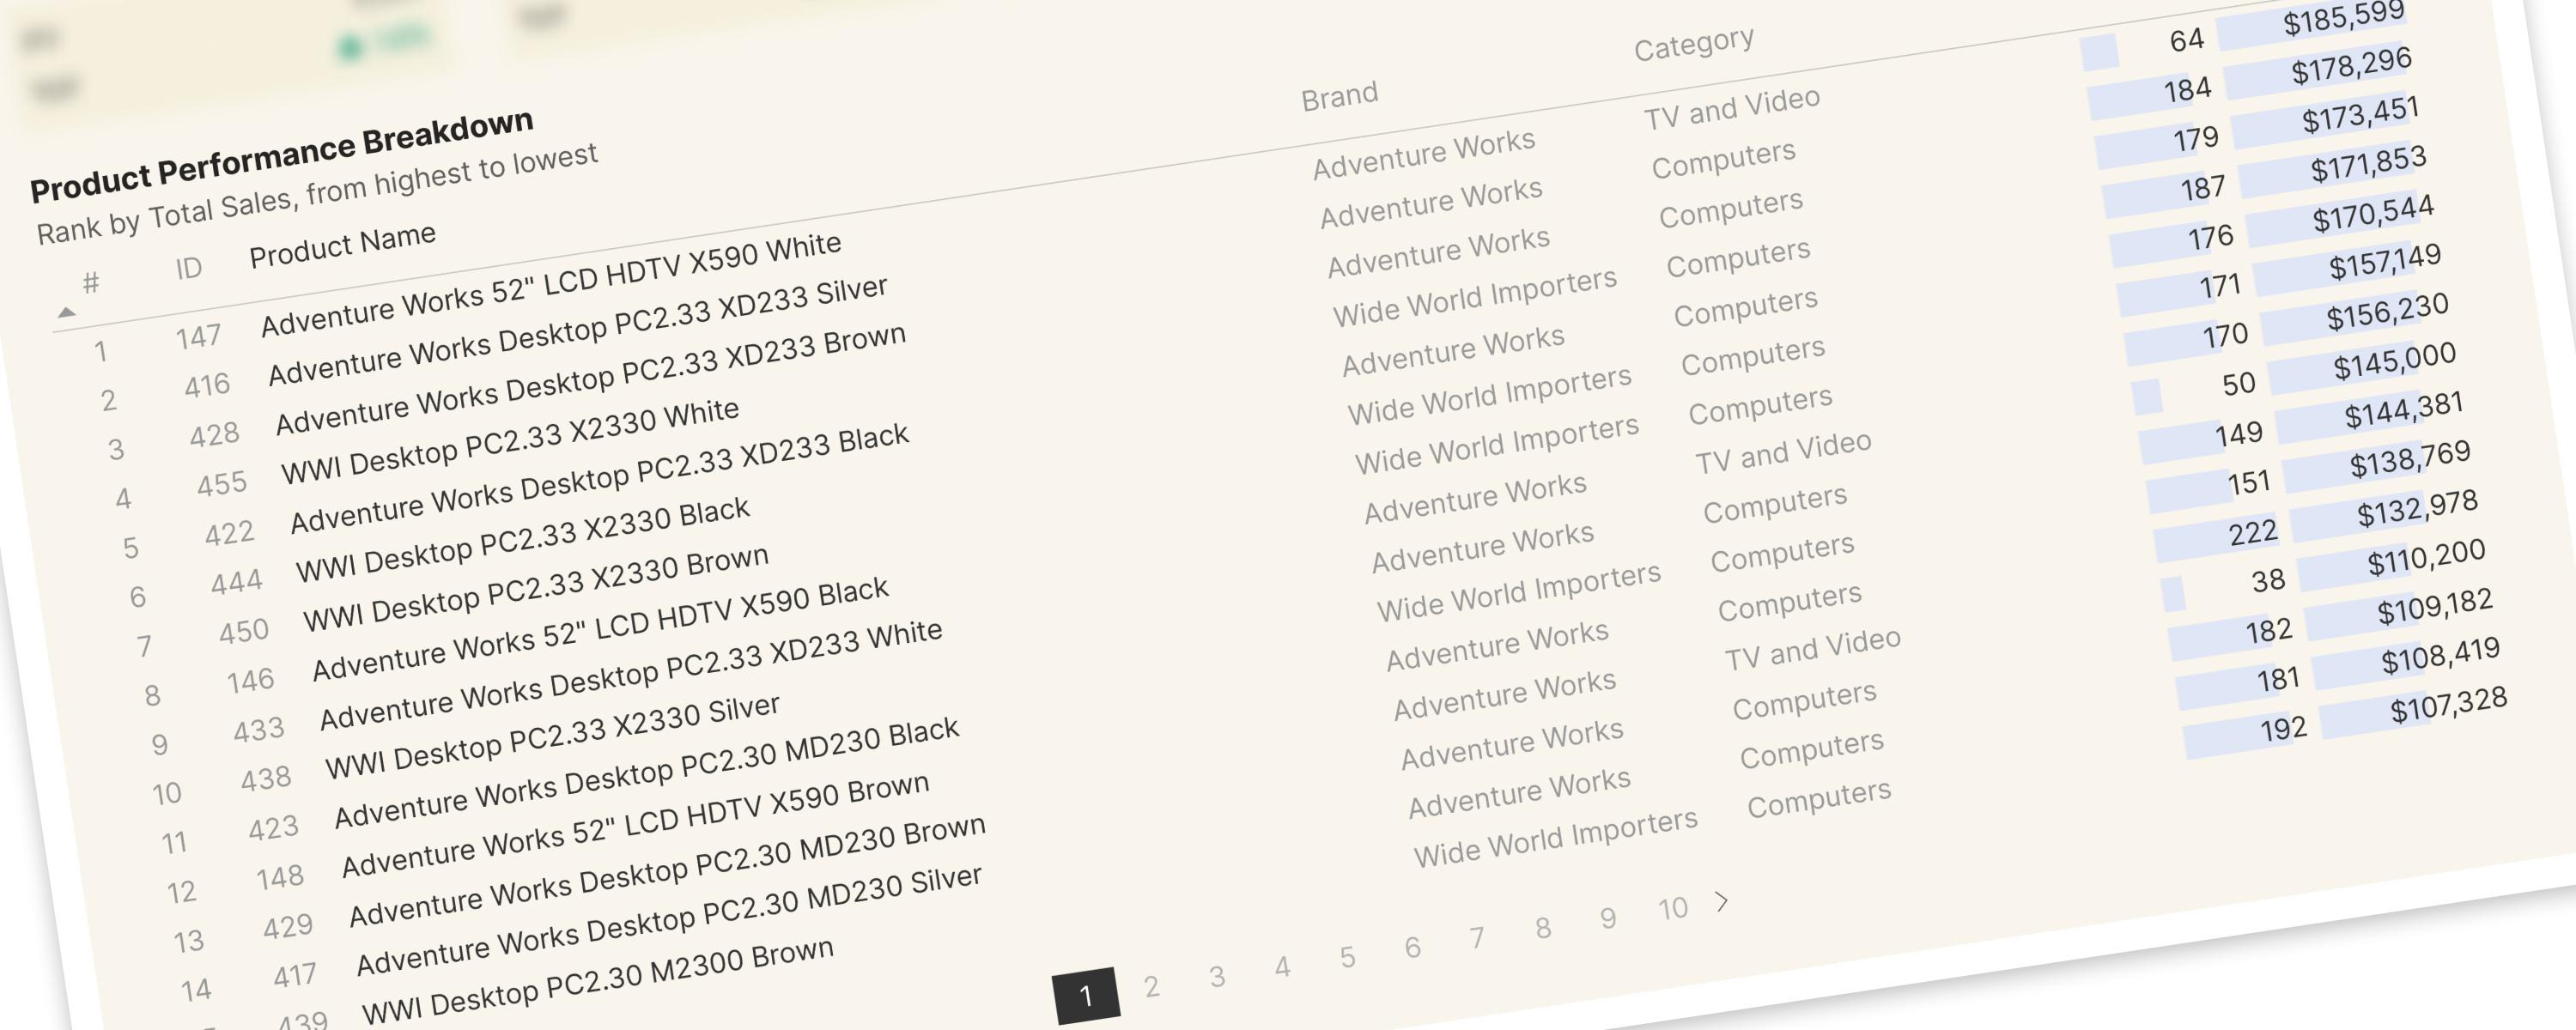
Complete the table visual by adding the [_05 Item Rank] measure and sorting by this measure.
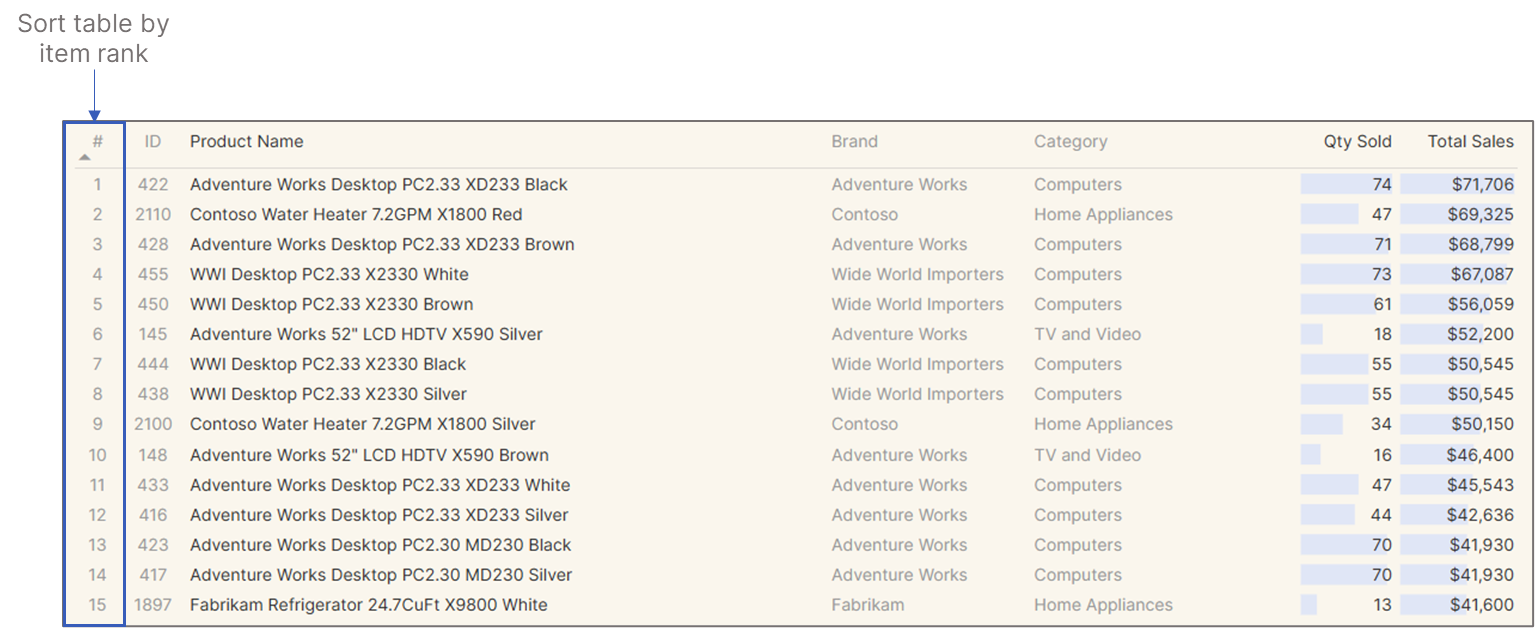 Display ranking within the table visual
Step 3: Creating Field Parameters
Step 4: Implementing Item and Page Filters
This step involves defining DAX measures that dynamically adjust the number of items displayed in the visual, the corresponding number of pages in the page slicer, and the item ranking based on user selections in the item slicer.
_06 Item Filter =
VAR _Page = [# Pages Value]              // Current page number
VAR _Number_of_Items = [# Items Value]     // Items per page
VAR _StartIndex = (_Page - 1) * _Number_of_Items + 1  // First item on current page
VAR _EndIndex = _Page * _Number_of_Items    // Last item on current page
VAR _ItemRank = [_05 Item Rank]           // Current item's rank
RETURN
  IF(
      _ItemRank >= _StartIndex && _ItemRank <= _EndIndex,
      1,
      0
  )
This measure is designed to filter items for a paginated visual in Power BI.
1. Variable Declarations:
-
VAR _Page = [# Pages Value]:- This line retrieves the current page number from a measure named
[# Pages Value]. This measure comes from our previously defined parameter that allows users to select the desired page.
- This line retrieves the current page number from a measure named
-
VAR Number_of_Items = [# Item Value]:- This line retrieves the number of items to display per page from a measure named
[# Item Value]. This measure comes from our previously defined parameter that allows users to control the number of items shown on each page.
- This line retrieves the number of items to display per page from a measure named
-
VAR StartIndex = (Page - 1) * Number_of_Items + 1:- This calculates the starting rank of the items to be displayed on the current page.
(Page - 1): Determines the offset from the first page.Number_of_Items: Multiplies the offset by the number of items per page.+1: Adds 1 to get the actual starting rank.
-
VAR EndIndex = Page * Number_of_Items:- This calculates the ending rank of the items to be displayed on the current page.
Page * Number_of_Items: Multiplies the current page number by the number of items per page to get the last rank.
-
VAR ItemRank = [_05 Item Rank]:- This line retrieves the rank of the current item from a measure named
[05 Item Rank]. This measure likely assigns a unique rank to each item in the dataset.
- This line retrieves the rank of the current item from a measure named
2. Return Statement:
RETURN IF(_ItemRank >= _StartIndex && _ItemRank <= _EndIndex, 1, 0):- This is the core logic of the formula.
_ItemRank >= _StartIndex && _ItemRank <= _EndIndex: This checks if the current item’s rank falls within the range of ranks for the current page.1: If the item’s rank is within the range, the formula returns 1 (meaning “include this item”).0: If the item’s rank is outside the range, the formula returns 0 (meaning “exclude this item”).
In essence, this DAX measure performs the following:
-
Determines the starting and ending ranks for the items to be displayed on the current page based on the selected page number and the number of items per page.
-
Checks if the rank of each item falls within this range.
-
Returns 1 if the item should be displayed (its rank is within the range) and 0 if it should be hidden (its rank is outside the range).
This measure essentially creates a filter that can be used to show only the items that belong on the current page. For example, if we’re displaying 10 items per page and we’re on page 2, it will return 1 for items ranked 11-20 and 0 for all other items.
This next DAX measure is designed to control which page navigation elements are visible in a paginated Power BI report. Its primary goal is to ensure that users only see page numbers that actually exist within the dataset.
_07 Page Filter =
VAR _TotalNrItems =
  CALCULATE(
      DISTINCTCOUNT(Products[ProductKey]),
      ALL(Products[ProductKey])
  )
VAR _ShowNrItems = [# Item Value]
VAR _NumberofPages =
  ROUNDUP(
      DIVIDE(
          _TotalNrItems,
          _ShowNrItems
      ),
      0
  )
VAR _PageFilter =
  IF(
      SELECTEDVALUE( '# Pages'[# Pages] ) <= _NumberofPages,
      1,
      0
  )
RETURN
  _PageFilter
1. Calculating Total Items:
VAR _TotalNrItems = CALCULATE(DISTINCTCOUNT(Products[ProductKey]), ALL(Products[ProductKey])):- This part calculates the total number of unique product keys (
ProductKey) in theProductstable. DISTINCTCOUNT(Products[ProductKey])counts the number of unique values in theProductKeycolumn.CALCULATE(..., ALL(Products[ProductKey]))removes any existing filters on theProductKeycolumn, ensuring that the total count is accurate regardless of other filters applied in the report.
- This part calculates the total number of unique product keys (
2. Retrieving Items Per Page:
VAR _ShowNrItems = [# Item Value]:- This retrieves the number of items that should be displayed on each page from a measure named
[# Item Value]. This measure comes from our previously defined parameter that allows users to control the number of items displayed per page.
- This retrieves the number of items that should be displayed on each page from a measure named
3. Calculating Total Pages:
VAR _NumberofPages = ROUNDUP(DIVIDE(_TotalNrItems, _ShowNrItems), 0):- This calculates the total number of pages required to display all items.
DIVIDE(_TotalNrItems, _ShowNrItems)divides the total number of items by the number of items per page.ROUNDUP(..., 0)rounds the result up to the nearest whole number. This ensures that even if the last page has fewer items than the specified number, it’s still counted as a page.
4. Determining Page Visibility:
VAR _PageFilter = IF(SELECTEDVALUE('# Pages'[# Pages]) <= _NumberofPages, 1, 0):- This is the core logic of the measure. It determines whether the currently selected page number is valid.
SELECTEDVALUE('# Pages'[# Pages])retrieves the page number currently selected by the user from a table or slicer named'# Pages'.IF(..., 1, 0)checks if the selected page number is less than or equal to the total number of pages calculated earlier.- If the selected page number is valid (less than or equal to the total number of pages), it returns
1(meaning “show this page”). - If the selected page number is invalid (greater than the total number of pages), it returns
0(meaning “hide this page”).
5. Returning the Result:
RETURN _PageFilter:- The measure returns the
_PageFiltervalue, which is either1or0. This value is then used to filter the page navigation elements, ensuring that only valid page numbers are displayed.
- The measure returns the
Once the necessary measures are defined, we’ll proceed to generate the item and page slicers (if they don’t already exist). Then, we’ll apply the appropriate measures to the item slicer and the table visual to enable pagination.
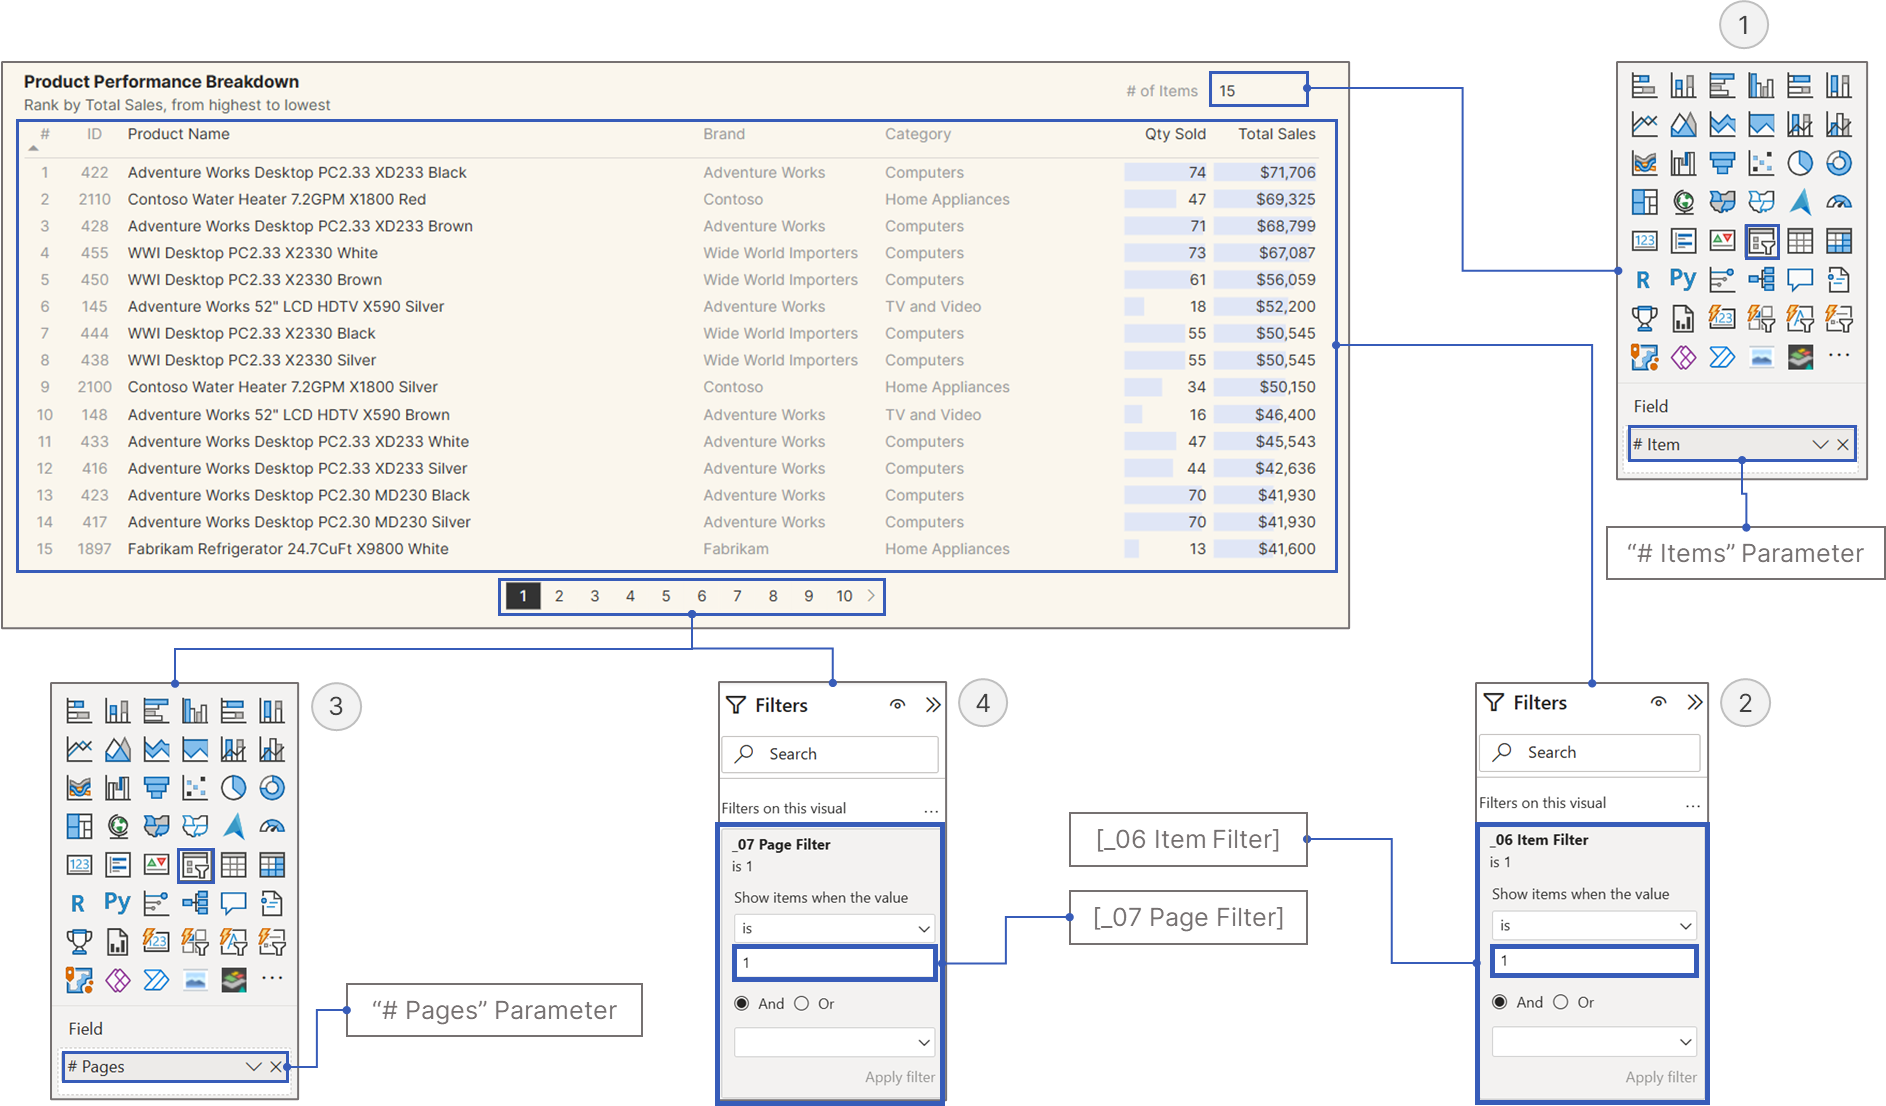 Implementing item and page filters
Additional Notes
I found that the following DAX measure, from Bas Dohmen, greatly enhanced loading speeds:
Item Filter =
VAR _Page = [# Pages Value]
VAR _Number_of_Items = [# Items Value]
VAR _ItemRank = [_05 Item Rank]
VAR _ItemsFilteredTbl =
FILTER(
  ALLSELECTED(Products[ProductKey]),
  _ItemRank > (_Page - 1) * _Number_of_Items
  && _ItemRank  <= (_Page) * _Number_of_Items
)
VAR __ItemsShow =
IF(
  SELECTEDVALUE(Products[ProductKey]) IN _ItemsFilteredTbl,
  1,
  0
)
RETURN
  __ItemsShow
Compared to the improvements applied to the DAX measure in this case study:
_06 Item Filter =
VAR _Page = [# Pages Value]
VAR Number_of_Items = [# Items Value]
VAR StartIndex = (Page - 1) * Number_of_Items + 1
VAR EndIndex = Page * Number_of_Items
VAR ItemRank = [_05 Item Rank]
RETURN
  IF(
      _ItemRank >= _StartIndex && _ItemRank <= _EndIndex,
      1,
      0
  )
The first DAX measure, [Item Filter], is slower because it creates a temporary table to filter products by rank and page range. Meanwhile, the second measure, [_06 Item Filter], is more efficient because it simply checks if an item’s rank falls within the calculated page range, avoiding the need for temporary tables.
Regardless, Bas Dohmen deserves immense credit for the original approach. I recommend exploring his content for a wealth of creative data visualization techniques.