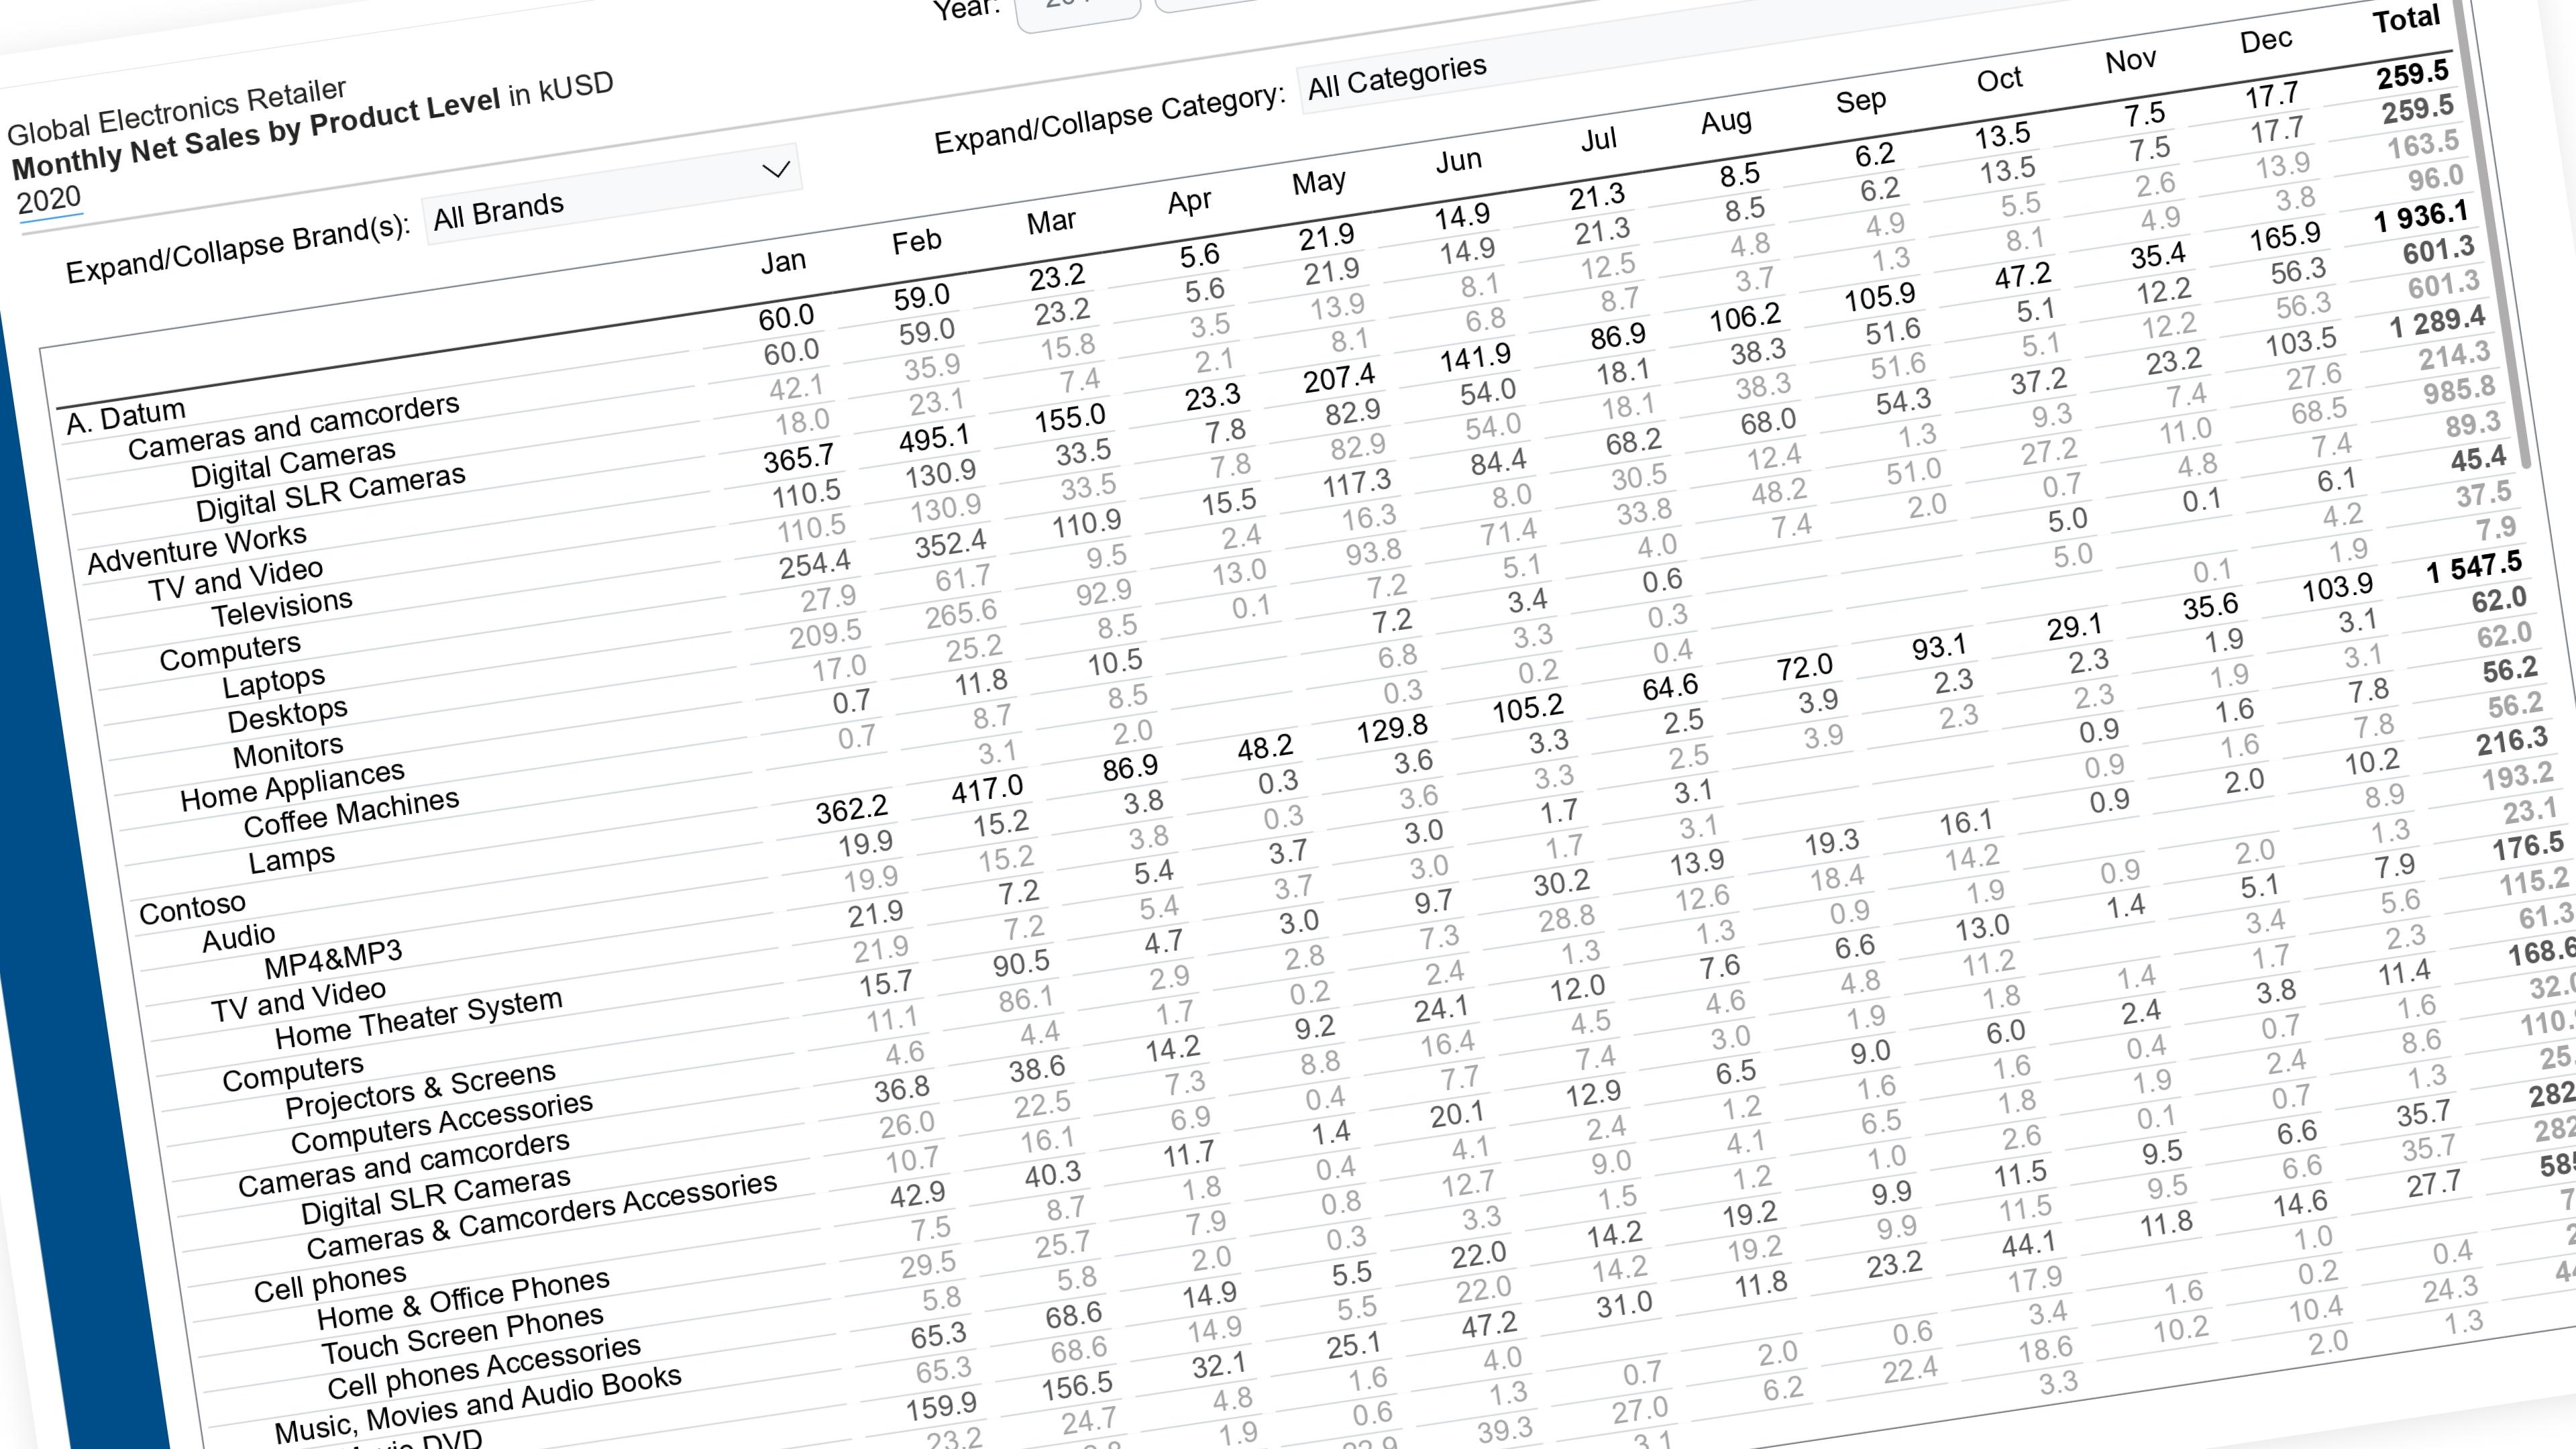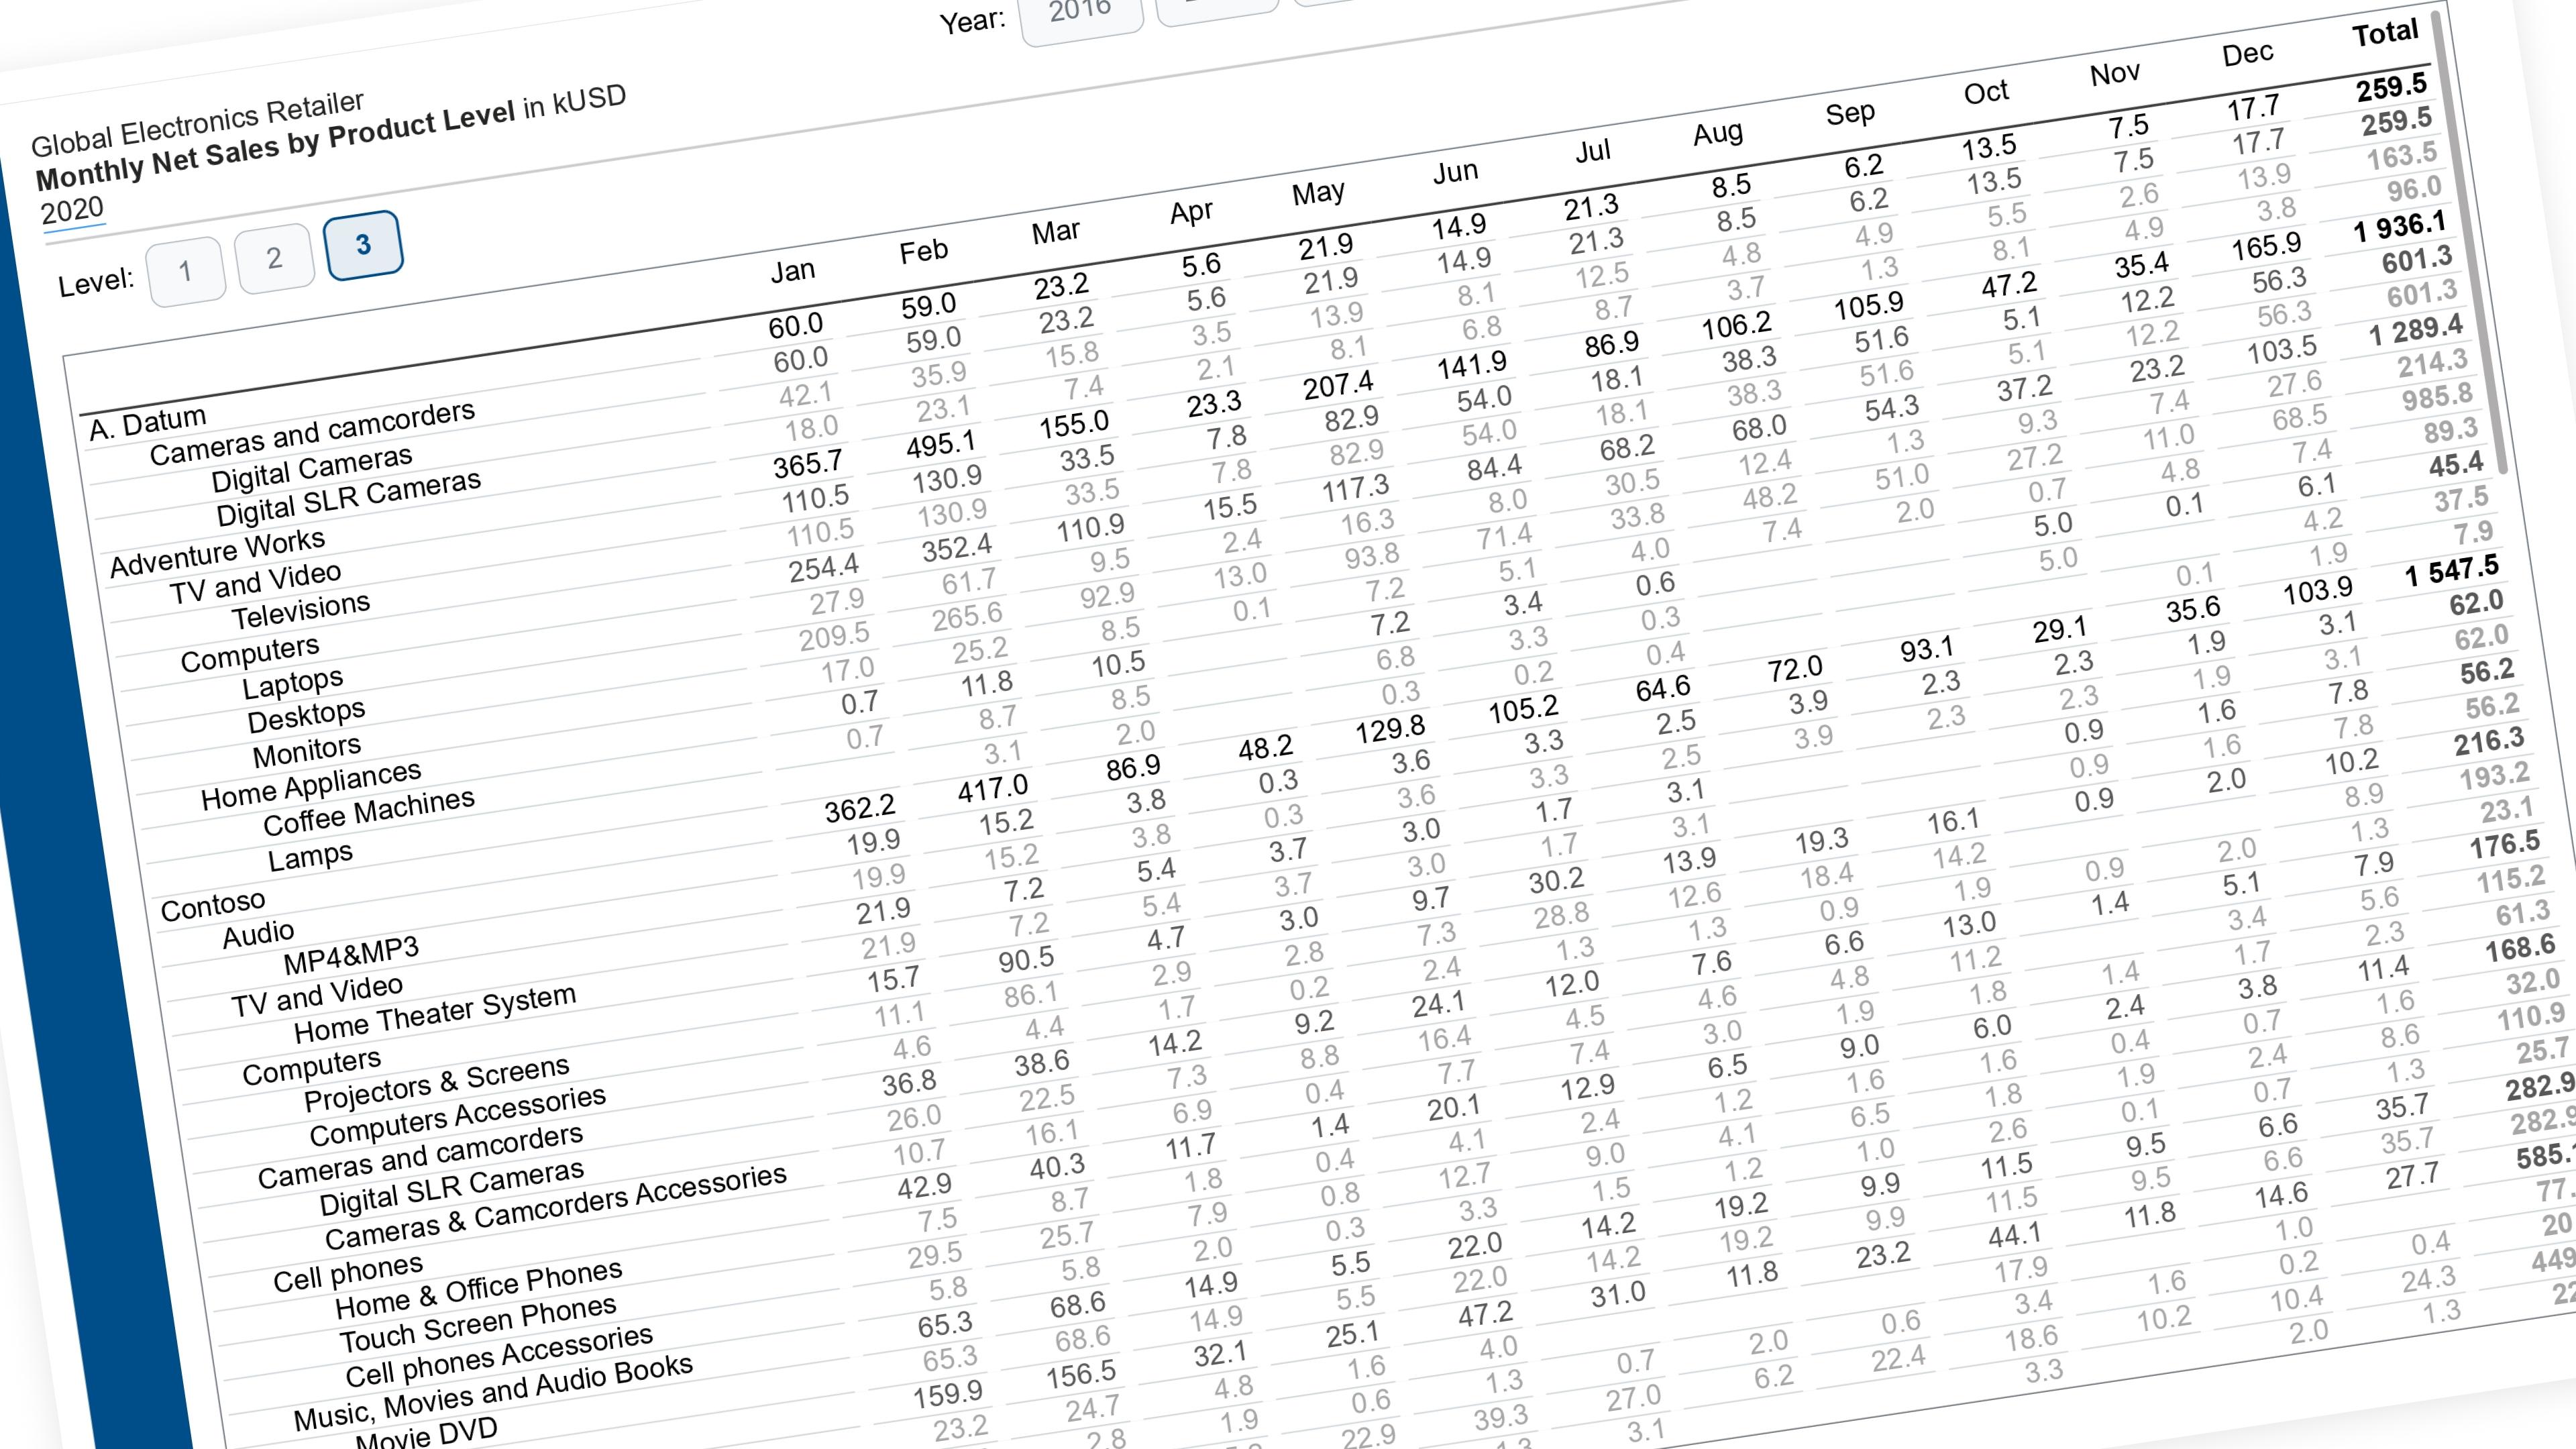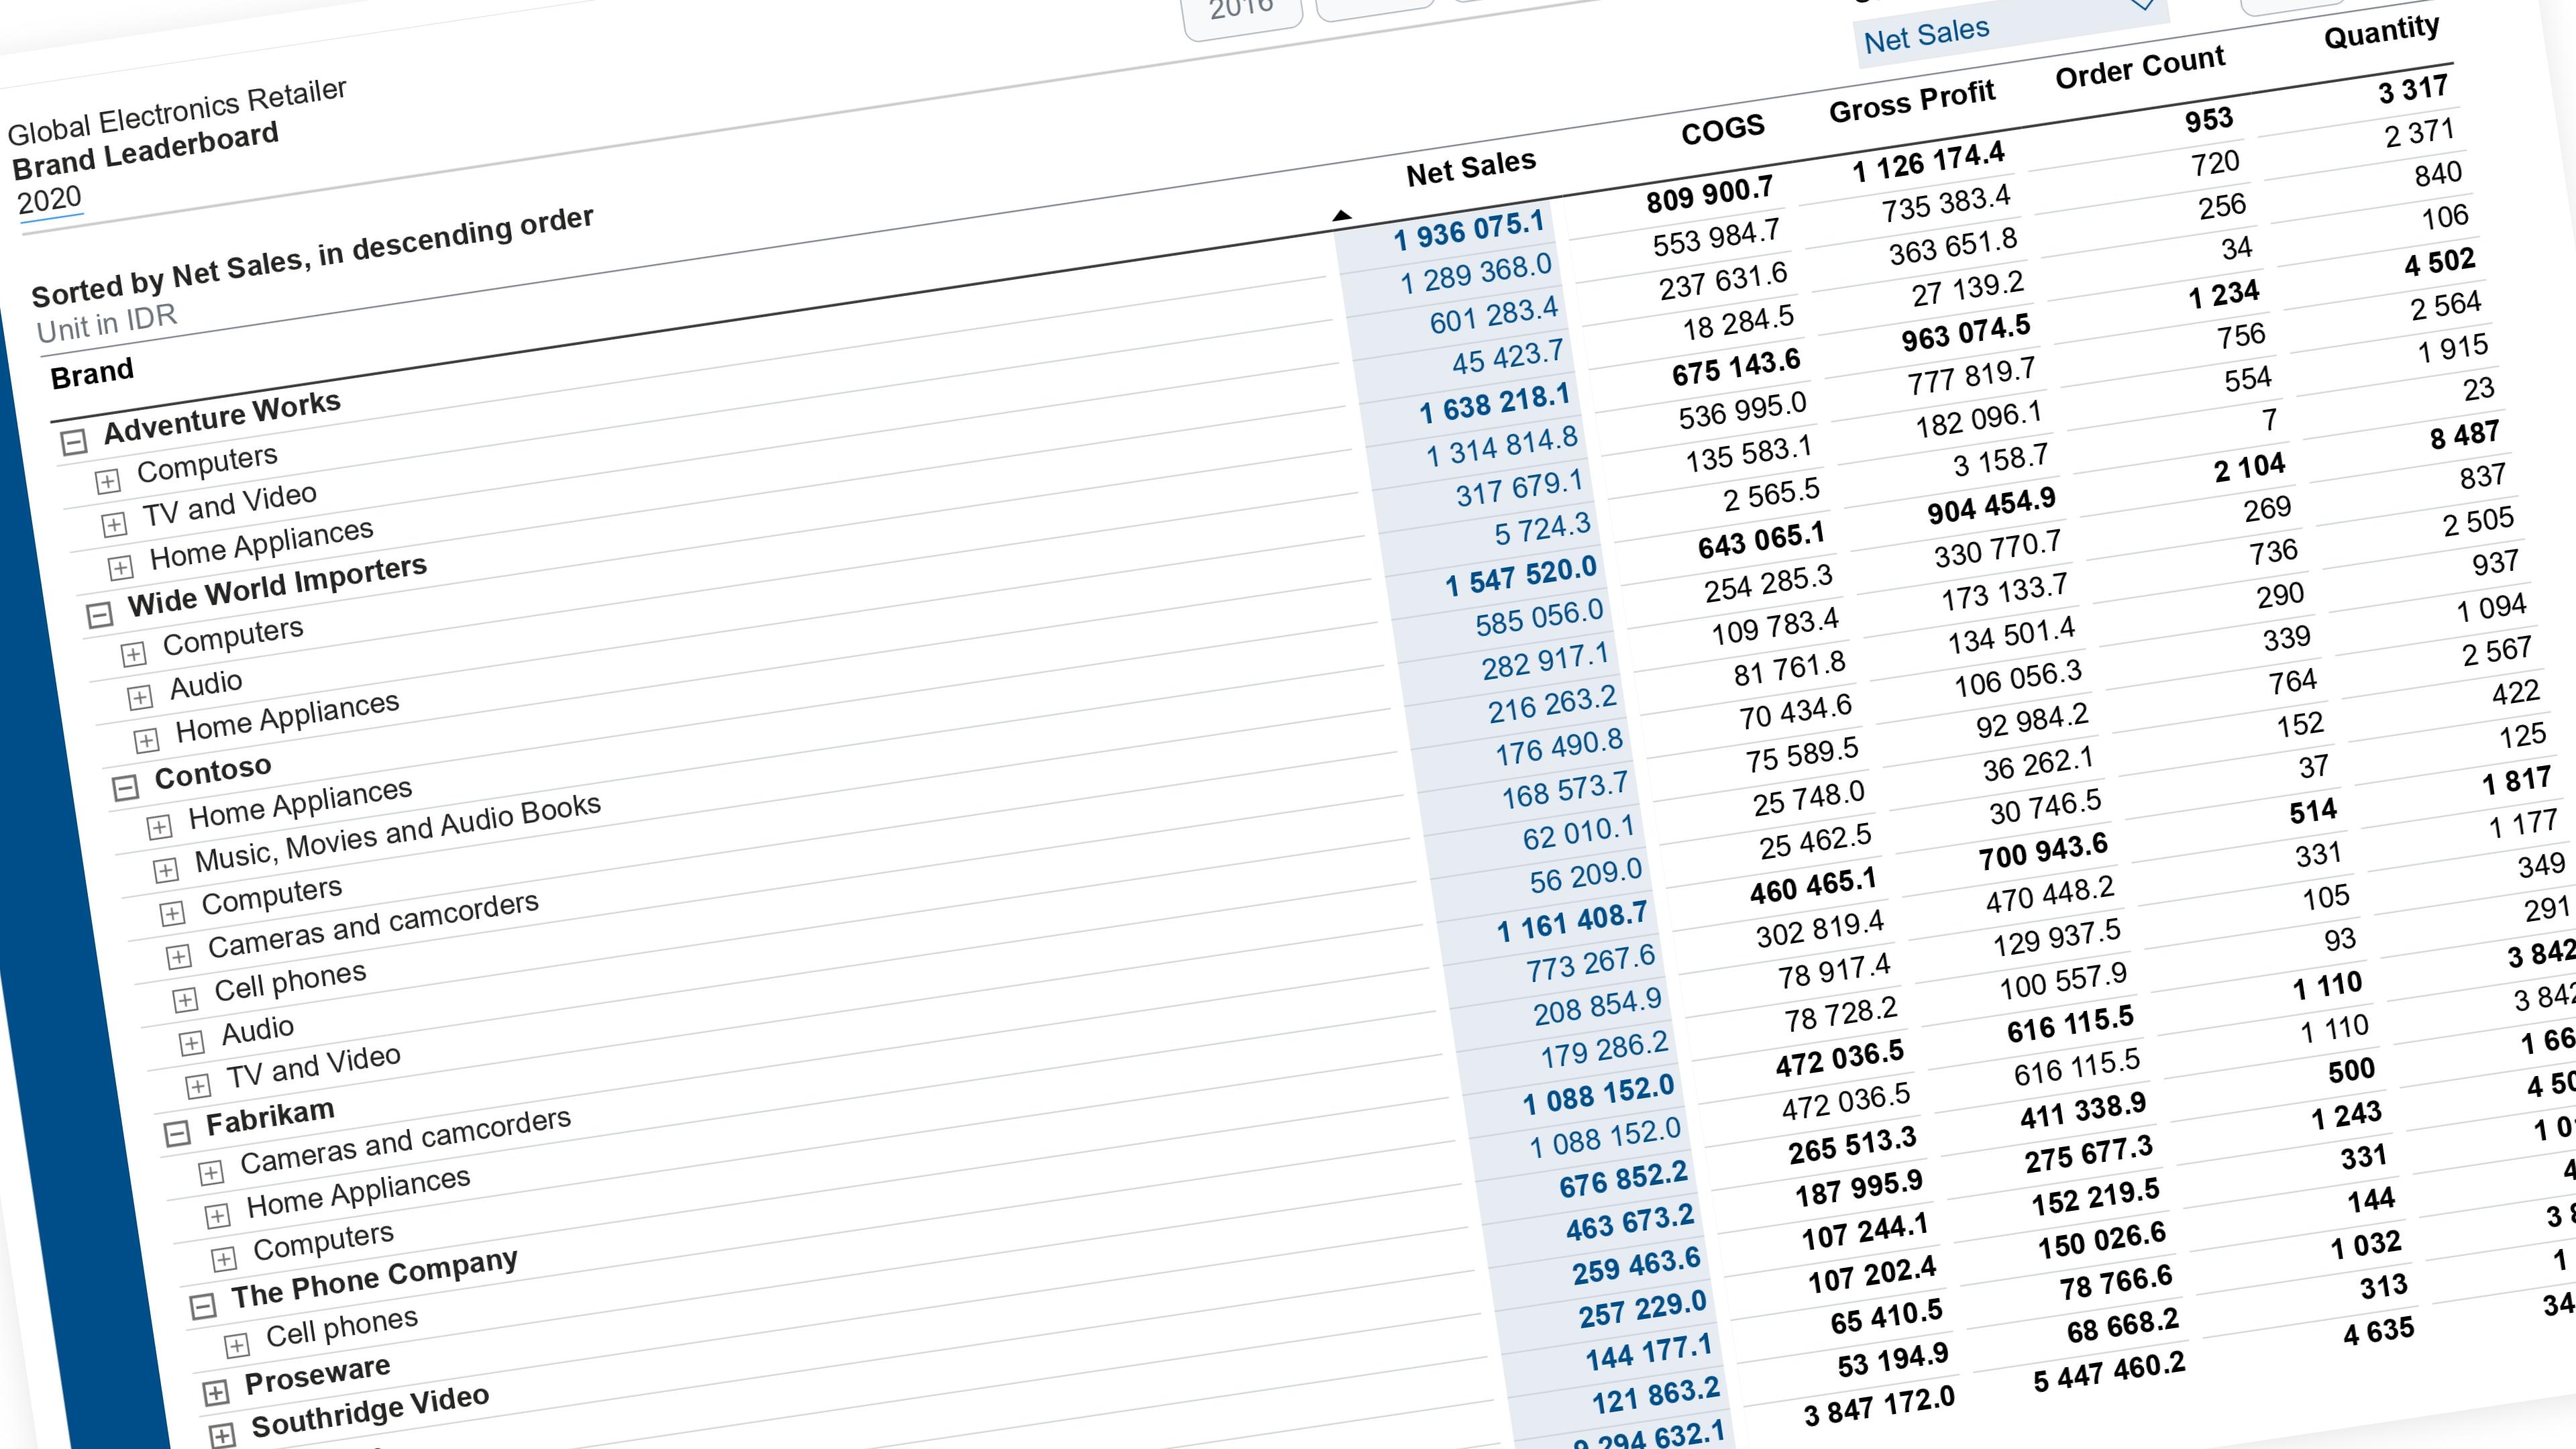
Let the reader pick a metric from a slicer — the matrix re-sorts by it, and that metric’s column lights up so it’s obvious what’s driving the order. Works at every level of a matrix’s row hierarchy at once: pick a metric while looking at Brands, drill into Category, and it keeps ranking whichever level you’re currently looking at.
The trick: one measure, not one per hierarchy level. A matrix can sort its rows by any measure in its Values well — the hard part is that “rank within Brand” and “rank within Category” are different populations, and a naive single measure gets that population wrong the moment you expand a row. ISINSCOPE lets one measure detect which level is on screen right now and rank against the matching population.
What you’re building
| Reader does | What happens |
|---|---|
| Picks a metric (e.g. Gross Profit) from the slicer | That column’s header and cells highlight in color; every other metric column goes back to plain text |
| Picks a direction (▲ Ascending / ▼ Descending) | The matrix re-sorts its current rows by the highlighted metric, in that direction |
| Expands a row (Brand → Category → Subcategory → …) | The same metric keeps sorting — now within whichever level just got expanded, not the level above it |
The rest of this walkthrough is for members
You have read the problem. What is behind the paywall is the fix:
- The full step-by-step build, from measures to formatting
- Every DAX measure with the reasoning behind it
- The .pbix with the model already wired up
Already a member? Sign in with your email