Foreword
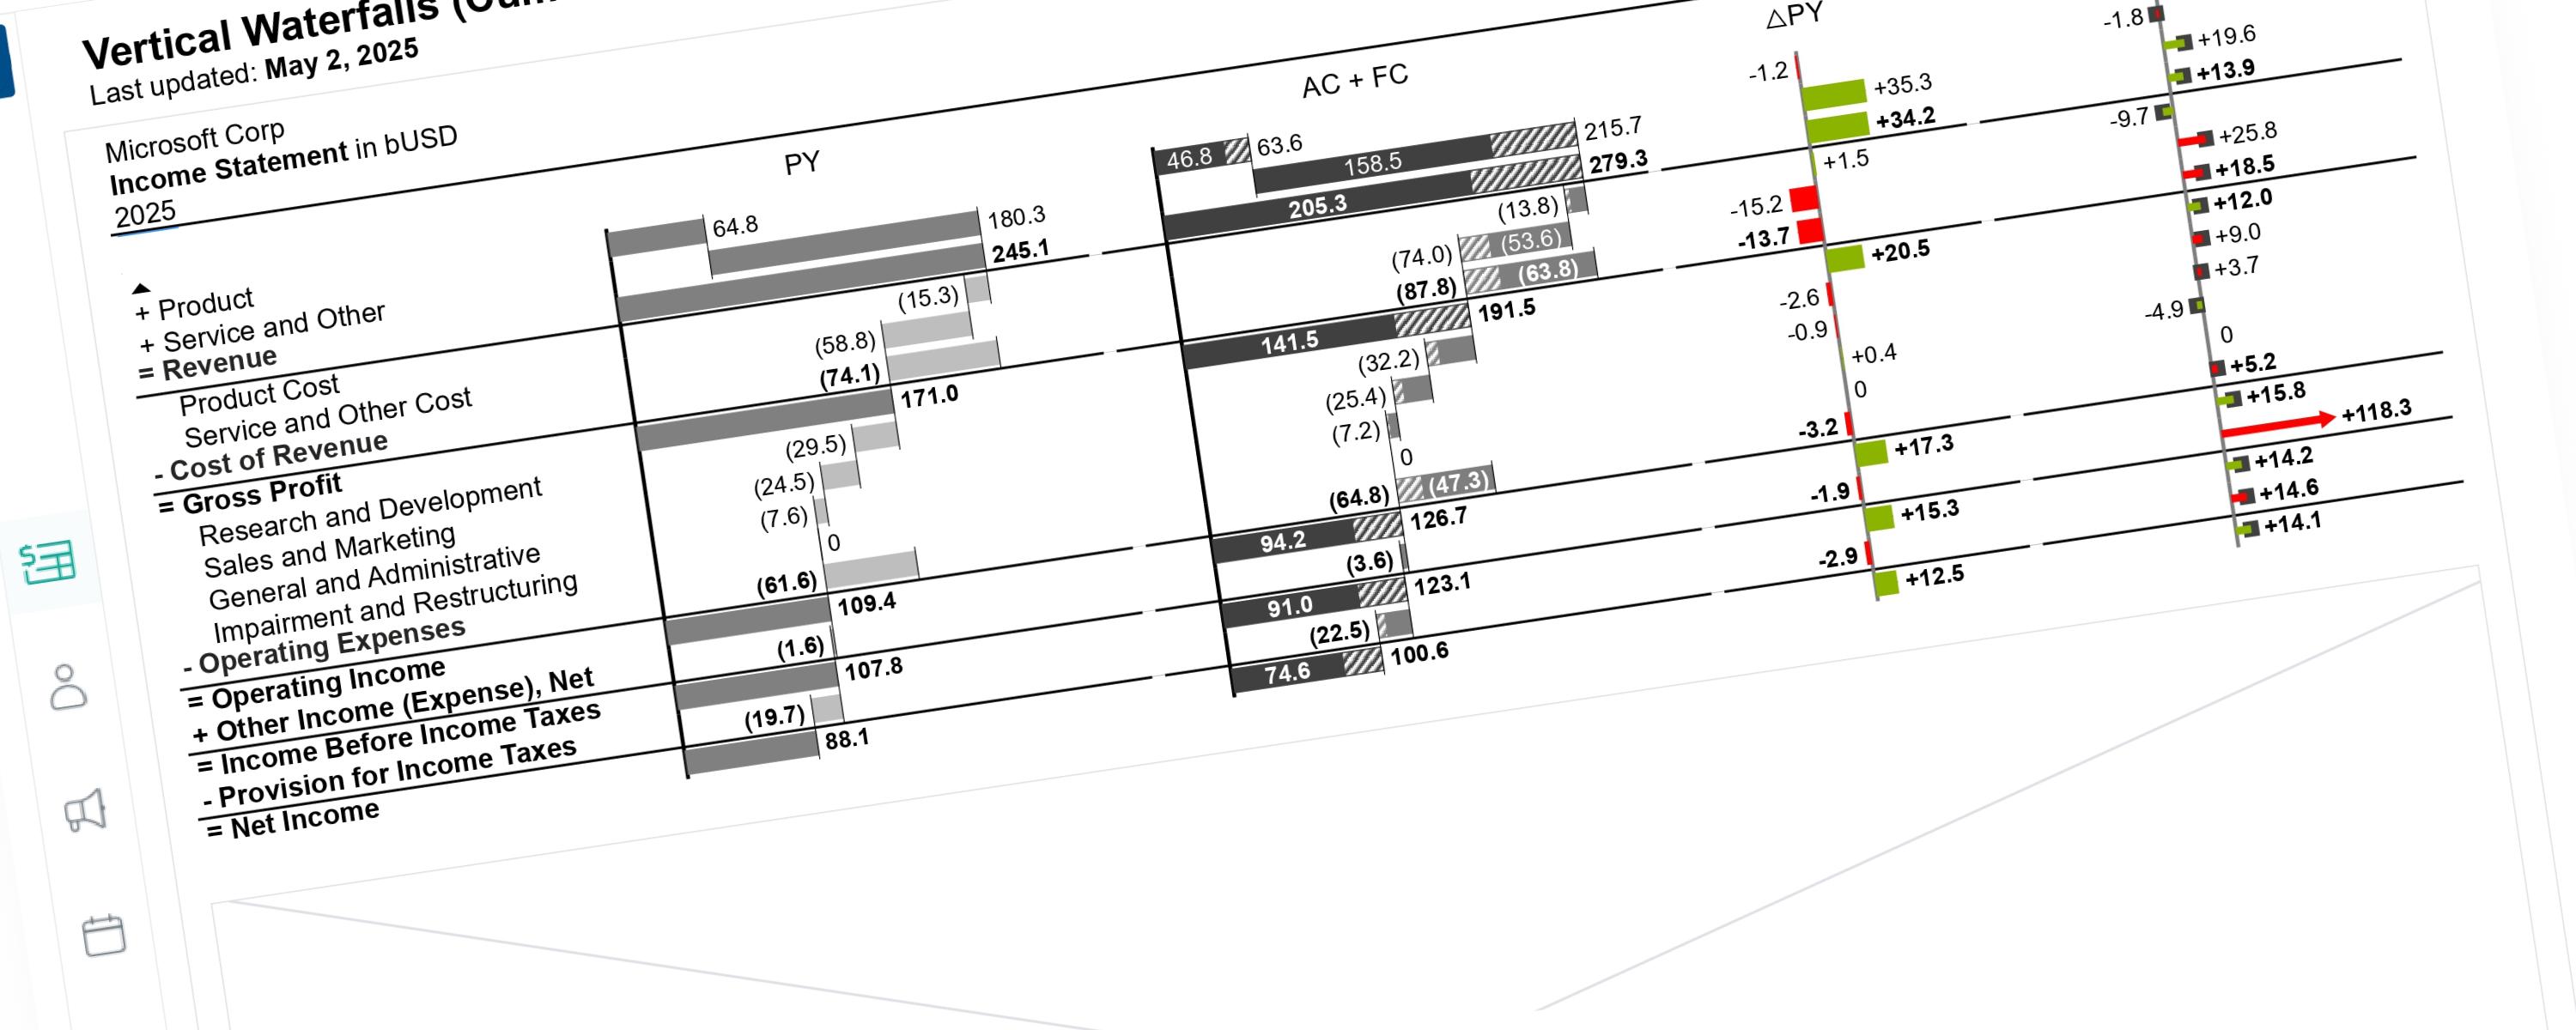
This documentation details the enhancements made to the previous visualization version. These updates focus on global scaling logic and cumulative data representation. Key updates include:
-
Global Scaling Logic: Bar lengths are now scaled based on the entire period’s dataset. This ensures visual consistency regardless of year or quarter filters.
-
Cumulative Calculations: The bars now support multi-quarter selections, allowing for aggregated views:
- Single Quarter: Displays the value for the selected period.
- Multi-Quarter/Full Year: Bars aggregate the values of all selected quarters. If a full year is selected (or all quarters within a year), the bars represent the total annual value.
- Forecast Visuals: Quarters containing forecast data are automatically styled with a hatched fill.
- Hybrid Views (Actuals + Forecast): If a selection includes both actual and forecast data, the Split Bar logic is applied: solid fills represent actuals, while hatched fills represent forecasted values.
Implementation Notes
-
Year Slicer: To ensure SVGs render correctly, your dashboard must use a single-select year slicer.
-
Future Roadmap: Subsequent updates may be released to further optimize DAX performance and code readability.
The rest of this walkthrough is for members
You have read the problem. What is behind the paywall is the fix:
- The full step-by-step build, from measures to formatting
- Every DAX measure with the reasoning behind it
- The .pbix with the model already wired up
Already a member? Sign in with your email