Visual Interpretation Guide
Vertical Waterfall Charts
What are Vertical Waterfall Charts?
Vertical waterfall charts (also called bar waterfalls) show you why a value changed between two different points. They are read from top to bottom and consist of three main parts:
-
Base and Total Bars: These represent your starting and ending points (e.g., Sales at the start and Profit at the end).
-
Contribution Bars: These sit between the totals. They show the individual "steps"—the increases or decreases—that lead from the start to the finish.
-
The Flow: Each new bar starts where the previous one ended, creating a visual path that shows how individual elements accumulate to reach the final total.
The Two Main Types
1. Calculation Waterfalls
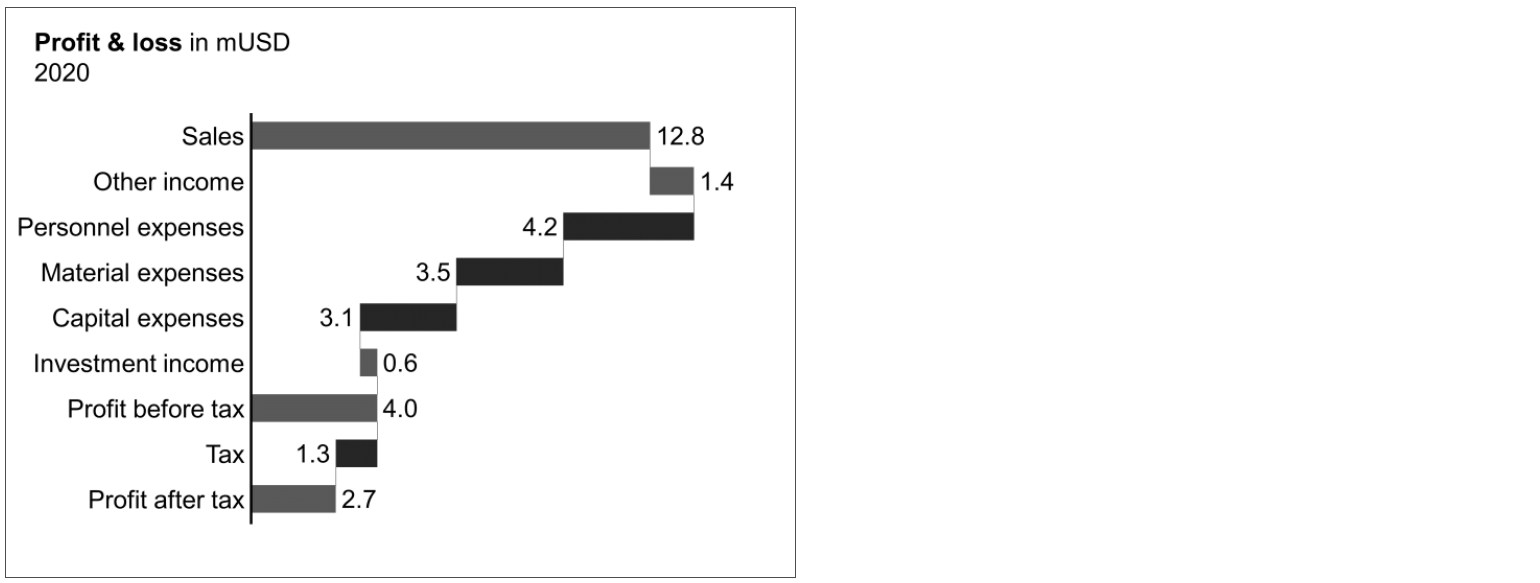 Calculation waterfall (example) — Source: IBCS Standards 1.2
Use these to visualize a formula or a "calculation scheme," such as a Profit and Loss (P&L) statement.
The rest of this walkthrough is for members
You have read the problem. What is behind the paywall is the fix:
- The full step-by-step build, from measures to formatting
- Every DAX measure with the reasoning behind it
- The .pbix with the model already wired up
Already a member? Sign in with your email