Foreword
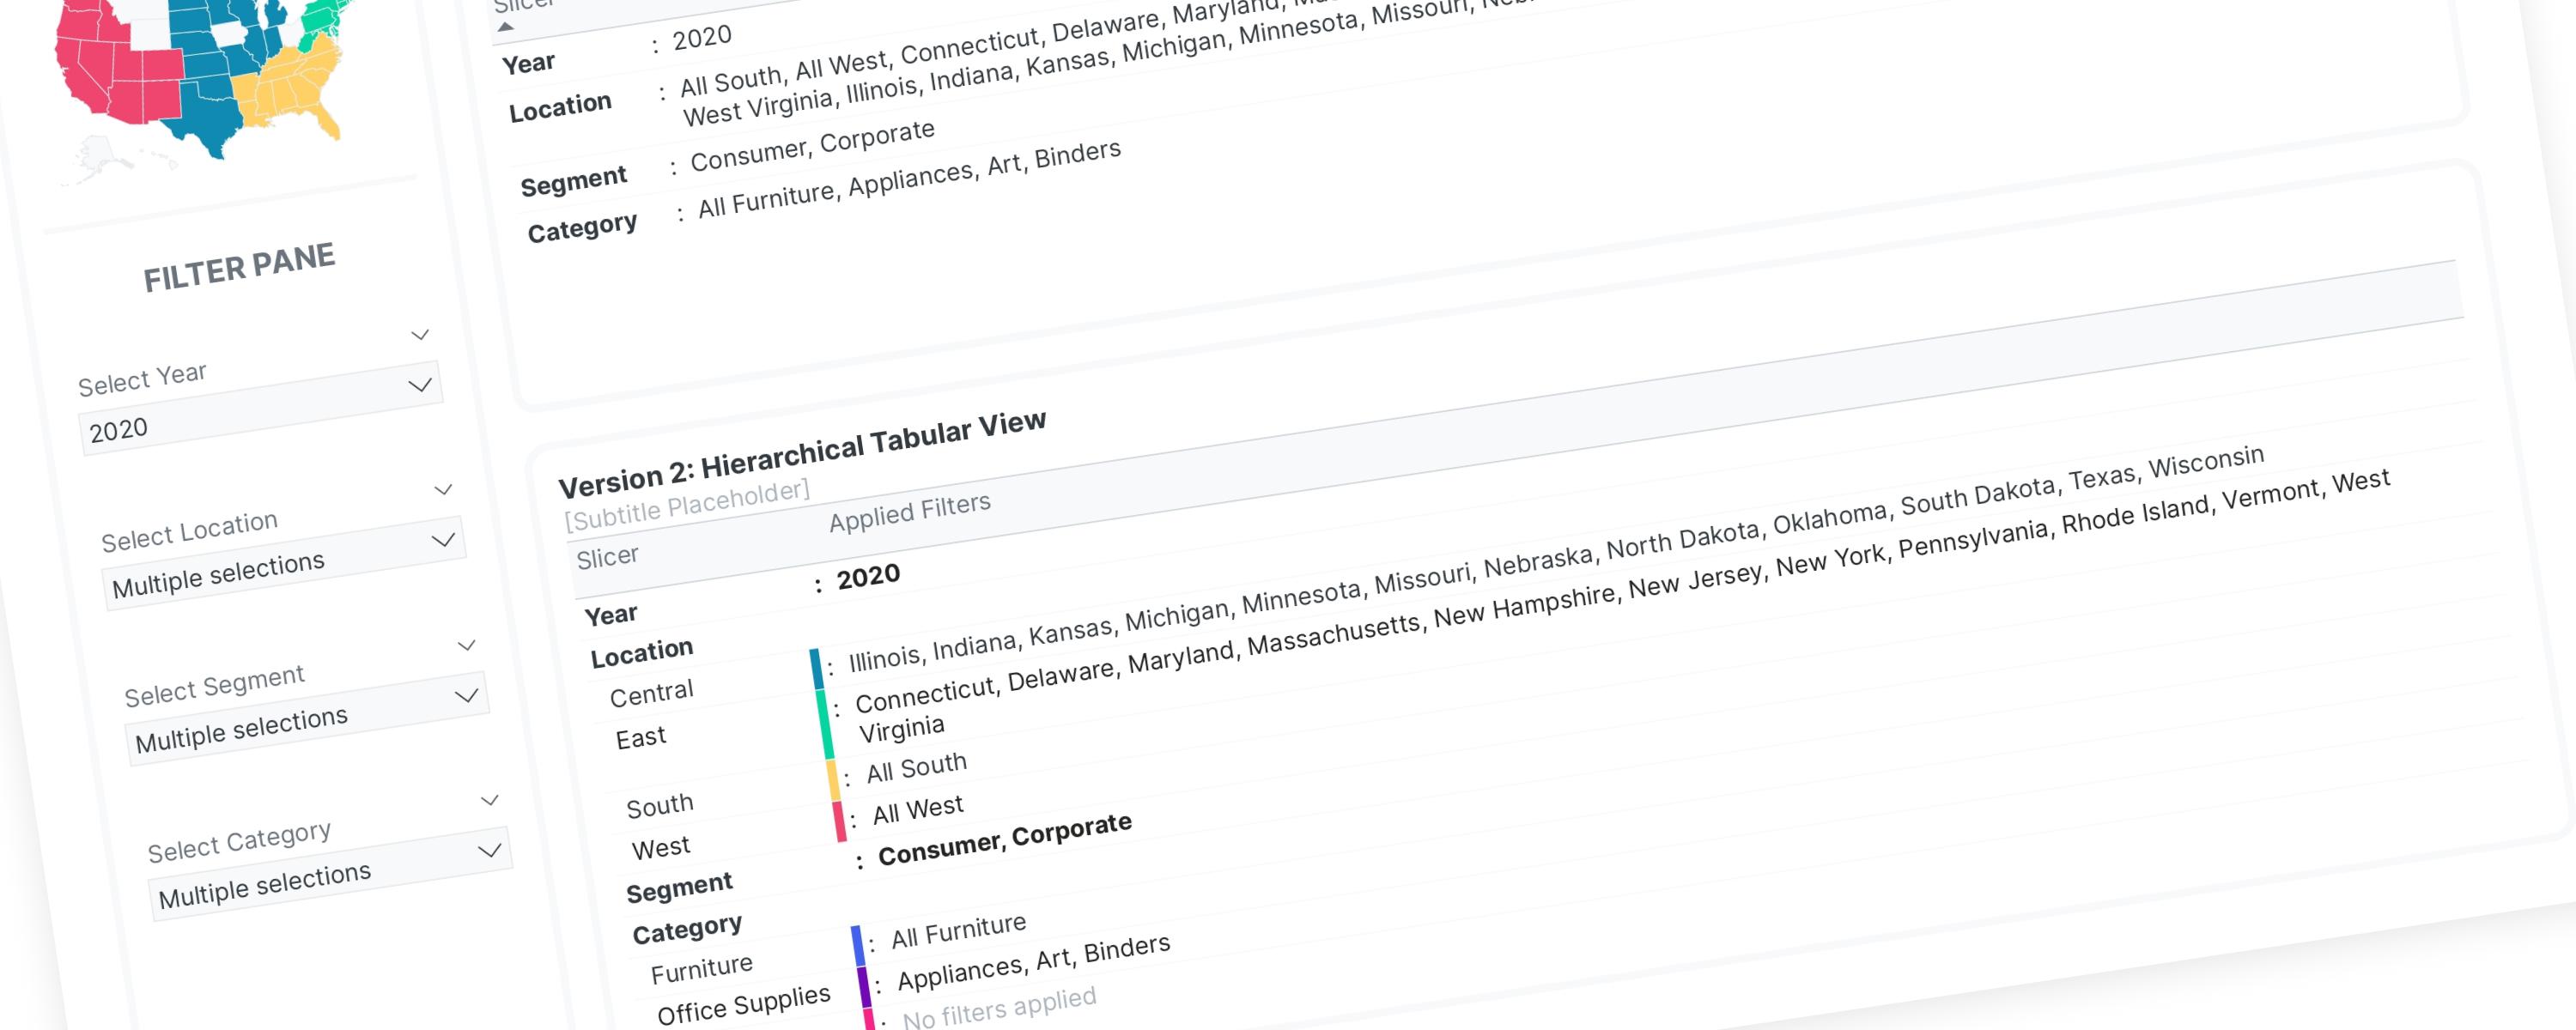
Inspired by Gustaw Dudek's work on displaying applied filters, I have developed two versions of a filter-display solution. Both versions use a matrix visual to show selections made in four slicers: Year, Location, Segment, and Category.
Slicer Configuration:
-
Non-Hierarchy Slicers: Year (single-select only) and Segment (multi-select).
-
Hierarchy Slicers: Location (Region/State) and Category (Category/Sub-category).
Filter Behavior Summary
The rest of this walkthrough is for members
You have read the problem. What is behind the paywall is the fix:
- The full step-by-step build, from measures to formatting
- Every DAX measure with the reasoning behind it
- The .pbix with the model already wired up
PowerLib Insideror $99 a year — two months free$9.99 / mo
Get accessAlready a member? Sign in with your email