The International Business Communication Standards (IBCS®) provide a set of rules for designing business reports, presentations, and dashboards to ensure clear and effective communication.
Foreword
Power BI’s add-ins, like Inforiver and Zebra BI, offer ready-made IBCS charts, though their advanced features require a subscription. However, creating IBCS visuals with native tools provides valuable learning experiences, despite the added effort and constraints.
My IBCS journey started with experimenting with small multiple pie charts. While pie charts are often discouraged, using them in small multiples with year-over-year comparisons significantly boosts information density. Although bar charts are the standard for this type of data, pie charts offer an engaging alternative.
For this exploration, I used the Superstore dataset, a popular resource within the LinkedIn community, which includes simple sales and profit details for each product.
Documentation
This documentation covers four crucial steps to construct IBCS-standard small multiple pie charts.
Step 1: Understanding the Concept
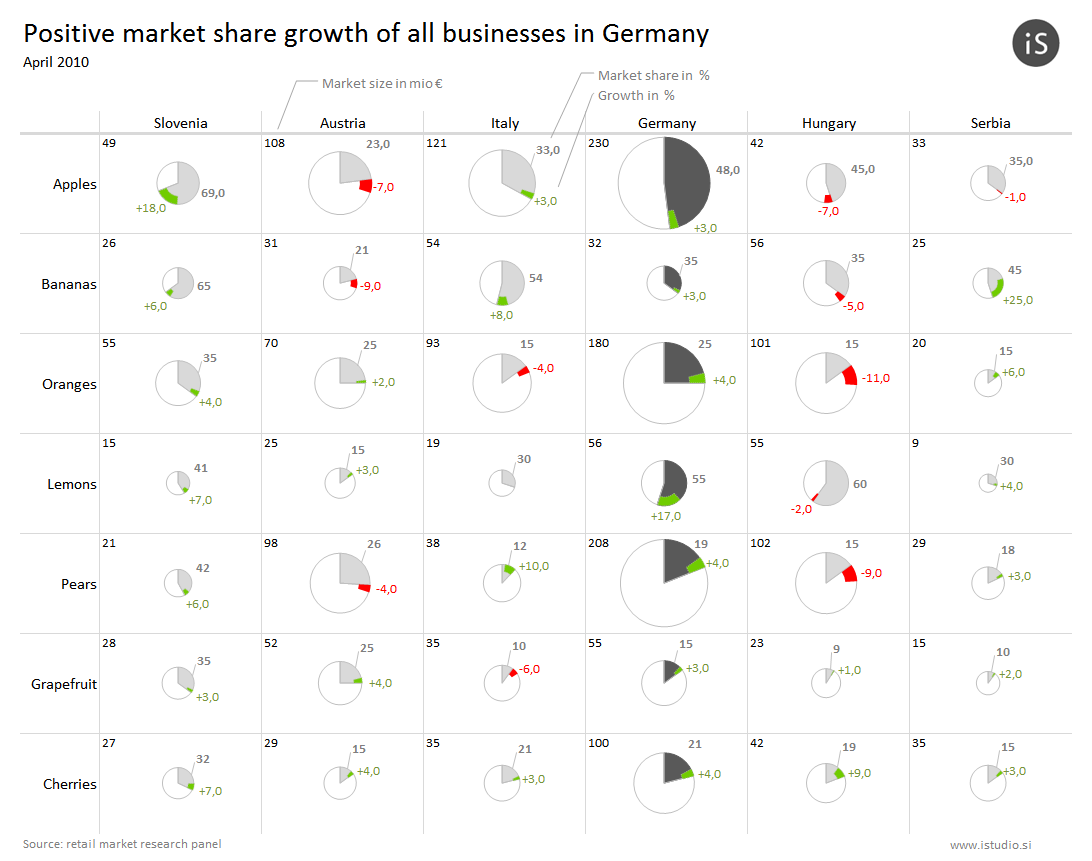 Example of Small Multiple Pie Charts with IBCS Standards
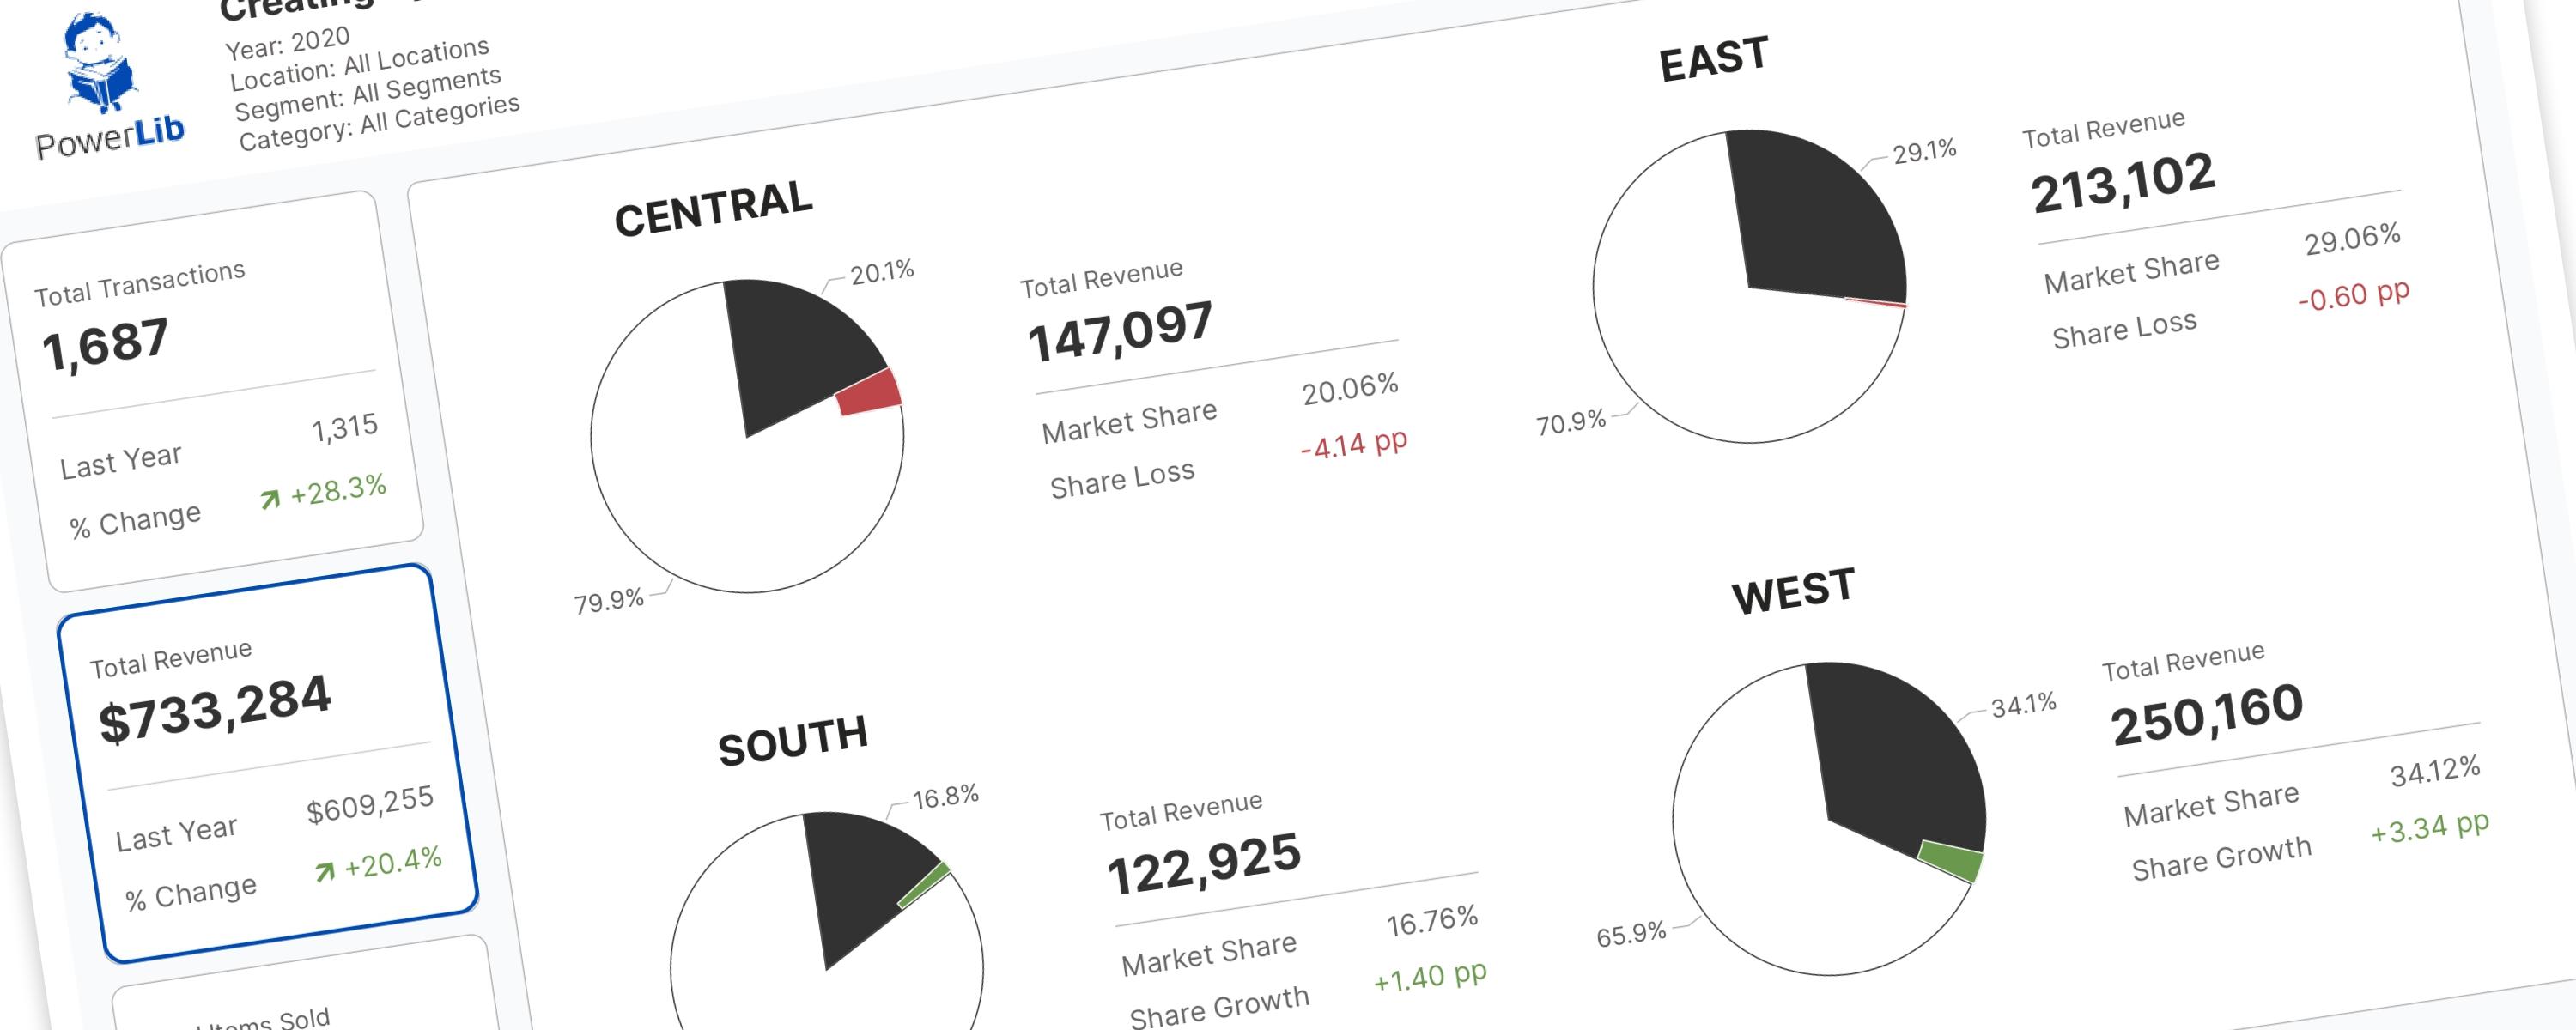
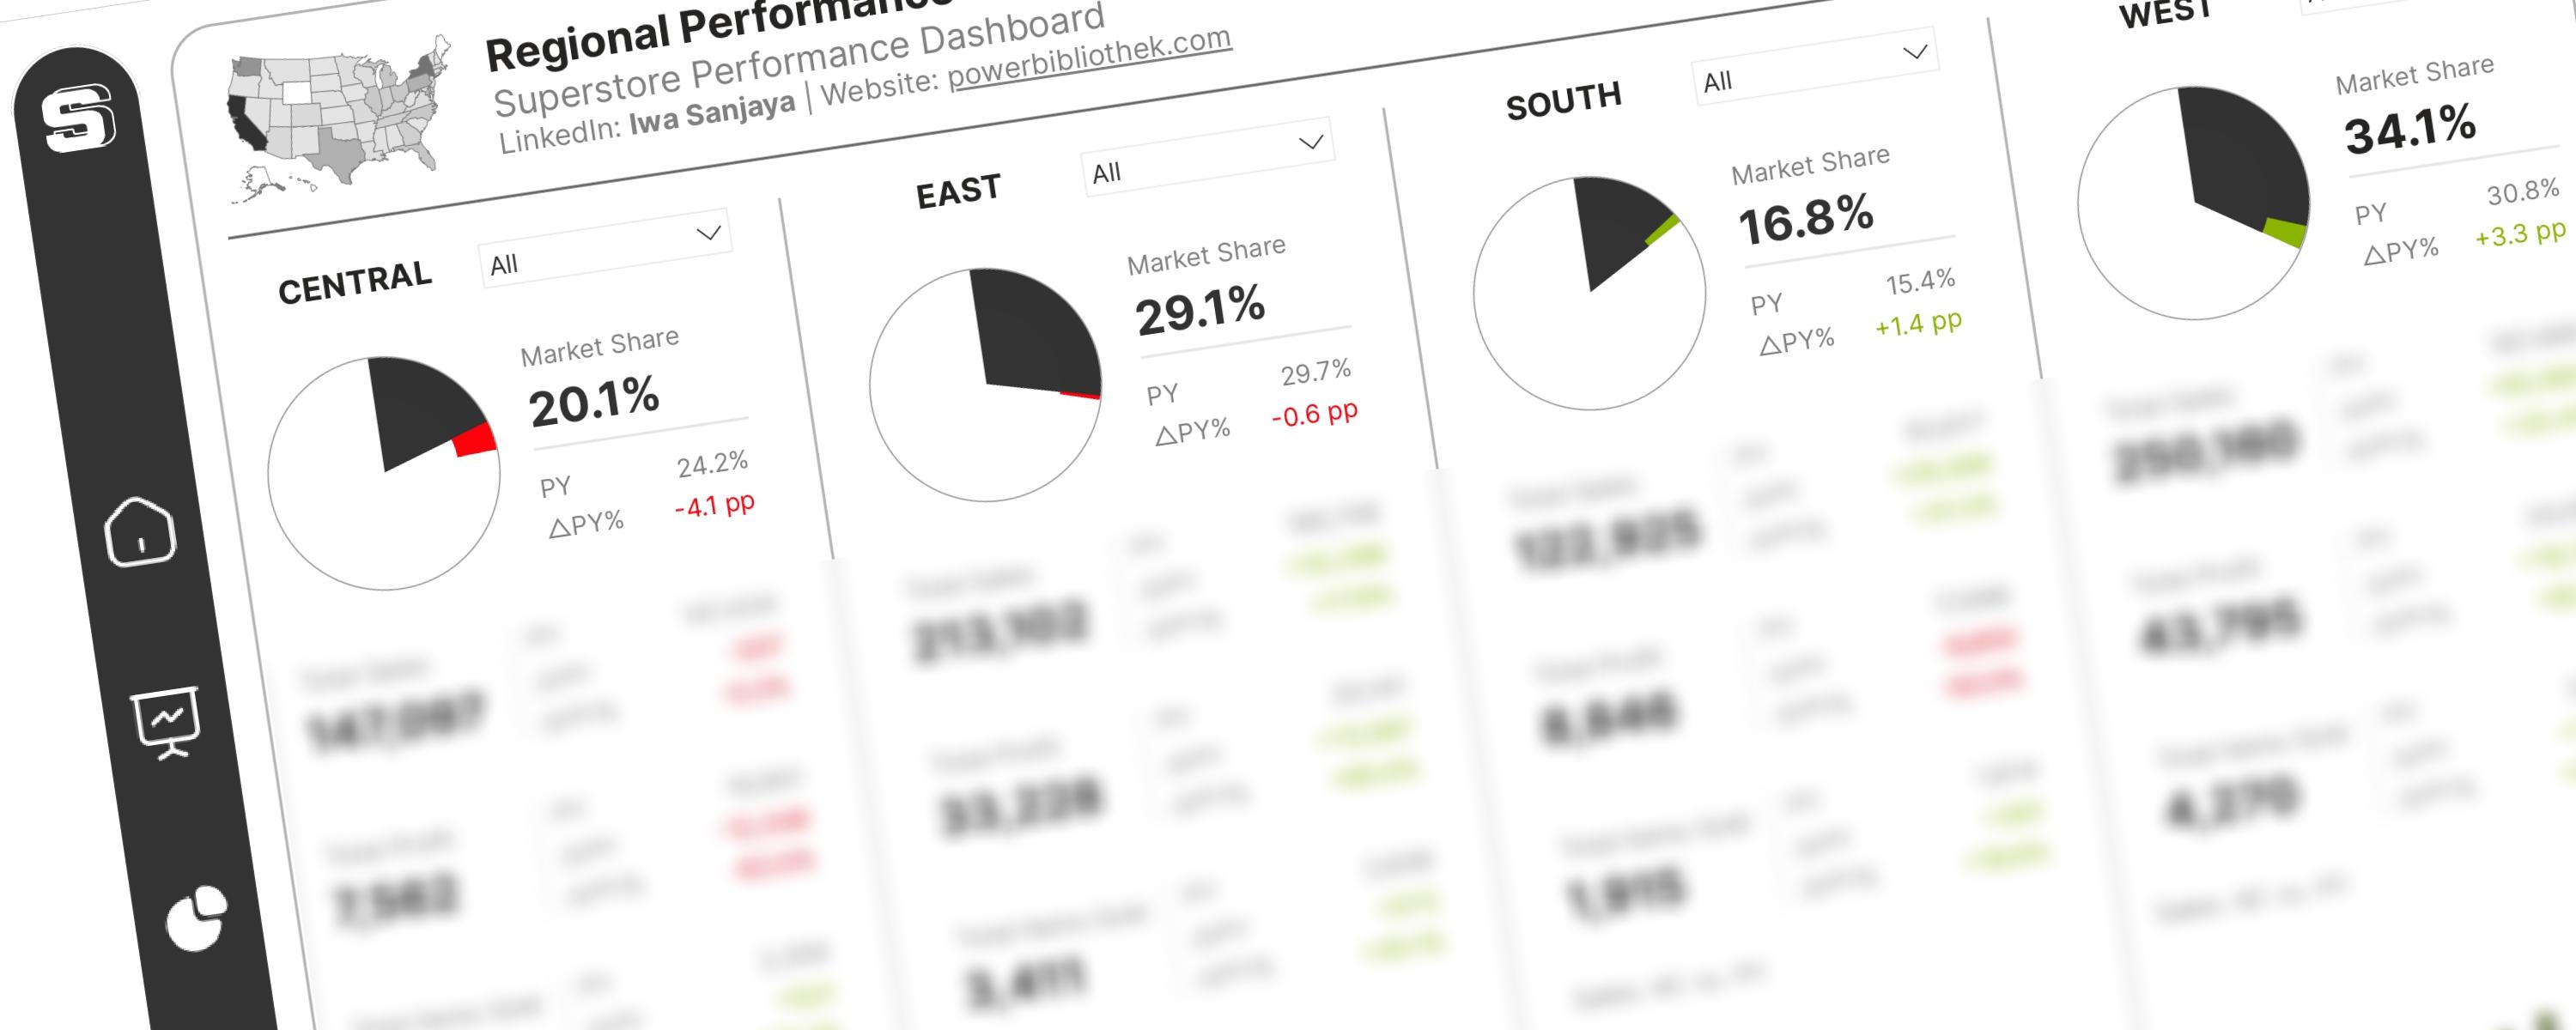
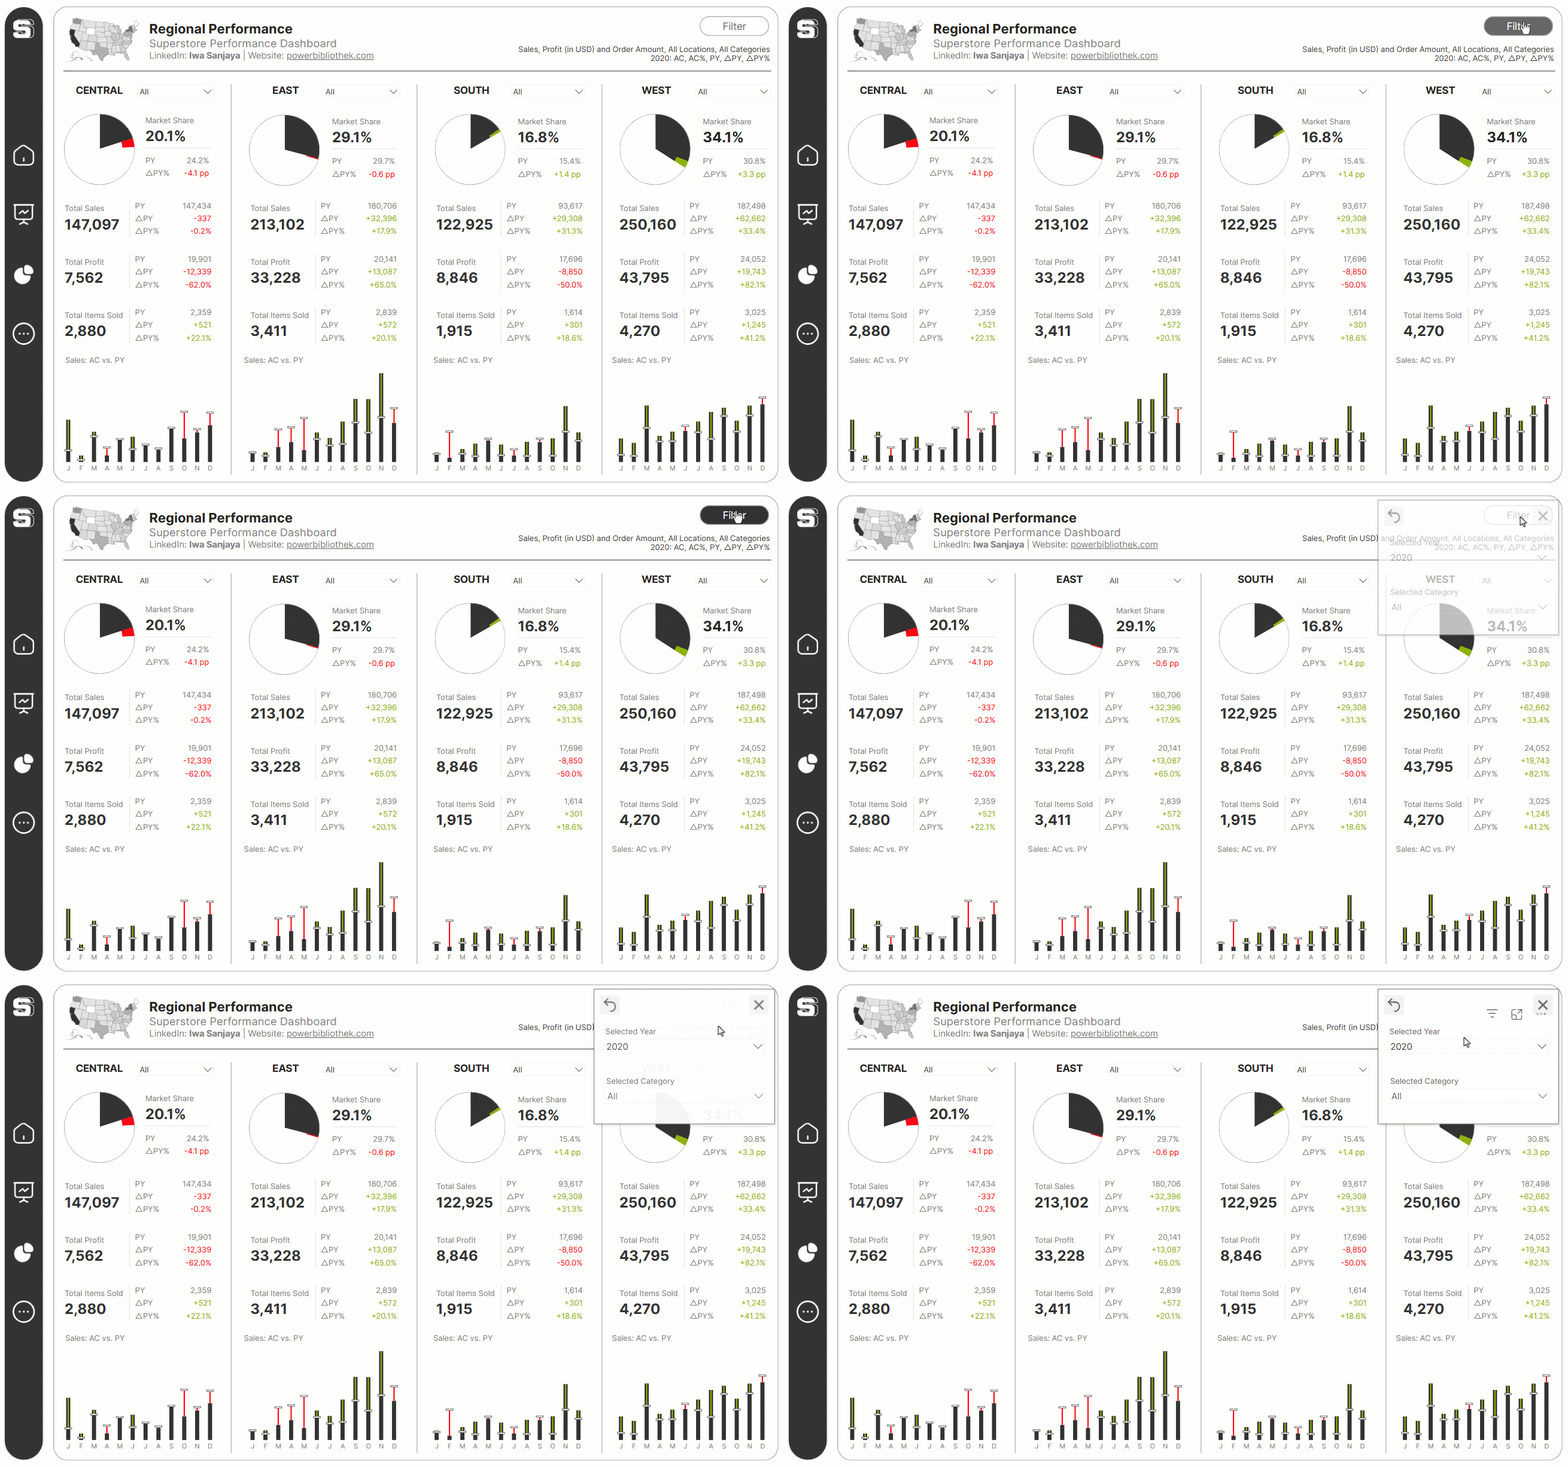
The visual above illustrates an experimental application of IBCS standards using pie charts. It presents market share by product and country, where pie size corresponds to market size, and each pie chart includes market share percentages (%) and year-over-year growth.
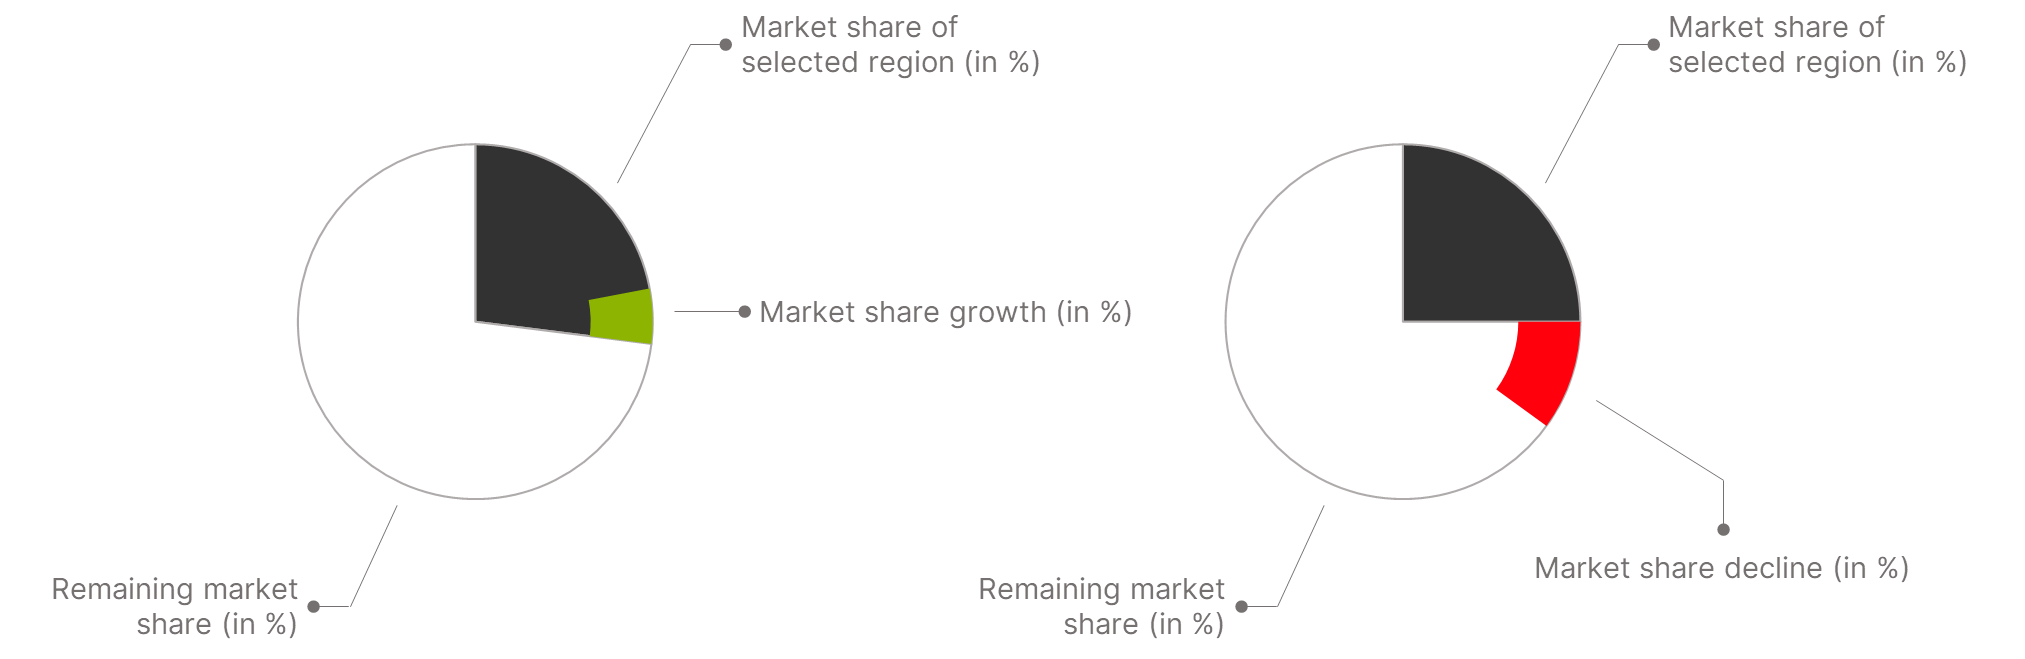
We will implement these visualizations in Power BI, ensuring dynamic data updates based on slicer selections. To achieve the desired dynamic adjustments of market share and growth, we will define several DAX measures.
In this study, we will use pie charts to display regional market share across four regions: Central, East, South, and West. Each pie chart will show the current year’s sales market share and the market share growth compared to the previous year. This will be accomplished by utilizing a pie chart for the selected region’s sales market share and an overlapping donut chart to visualize the previous year’s growth.
Step 2: Displaying Regional Sales Market Share for the Current Year
_01 Selected Region Market Share (AC%) =
VAR TotalAC = CALCULATE(
    [Total Sales AC],
    ALL('Sample - Superstore_Orders'[Region], 'Sample - Superstore_Orders'[State])
)
RETURN
DIVIDE([Total Sales AC], TotalAC, 0)
This measure calculates the market share of the selected region(s) as a percentage of the total sales across all regions and states. It first calculates the total sales for all regions and states, ignoring any filters. Then, it divides the total sales for the selected region(s) by the total sales for all regions and states. The result is the market share percentage. If the total sales across all regions are zero, the measure returns zero to avoid errors.
This measure would be used in a report to show how much of the total sales are coming from the currently selected region(s). For example, if we select “Central” in a region slicer, the measure will show the percentage of total sales that came from the Central region.
_02 Remaining Market Share (AC%) = 1 - [_01 Selected Region Market Share (AC%)]
This measure calculates the percentage of the total market that is not represented by the currently selected region(s).
-
If the selected region has a 30% market share, this measure will return 70%.
-
If no region is selected (meaning all regions are included), the selected region’s market share will be 100%, and this measure will return 0%.
It will be used in combination with the _01 Selected Region Market Share (AC%) measure to create a donut chart or other visual that shows the breakdown of the market into “selected region” and “remaining market share.”
To display the defined measures in a pie chart, we need to create a separate disconnected table. We can use the “Enter Data” feature to manually create a table with the “Category” column and the values “Selected Region” and “Remaining Market.”
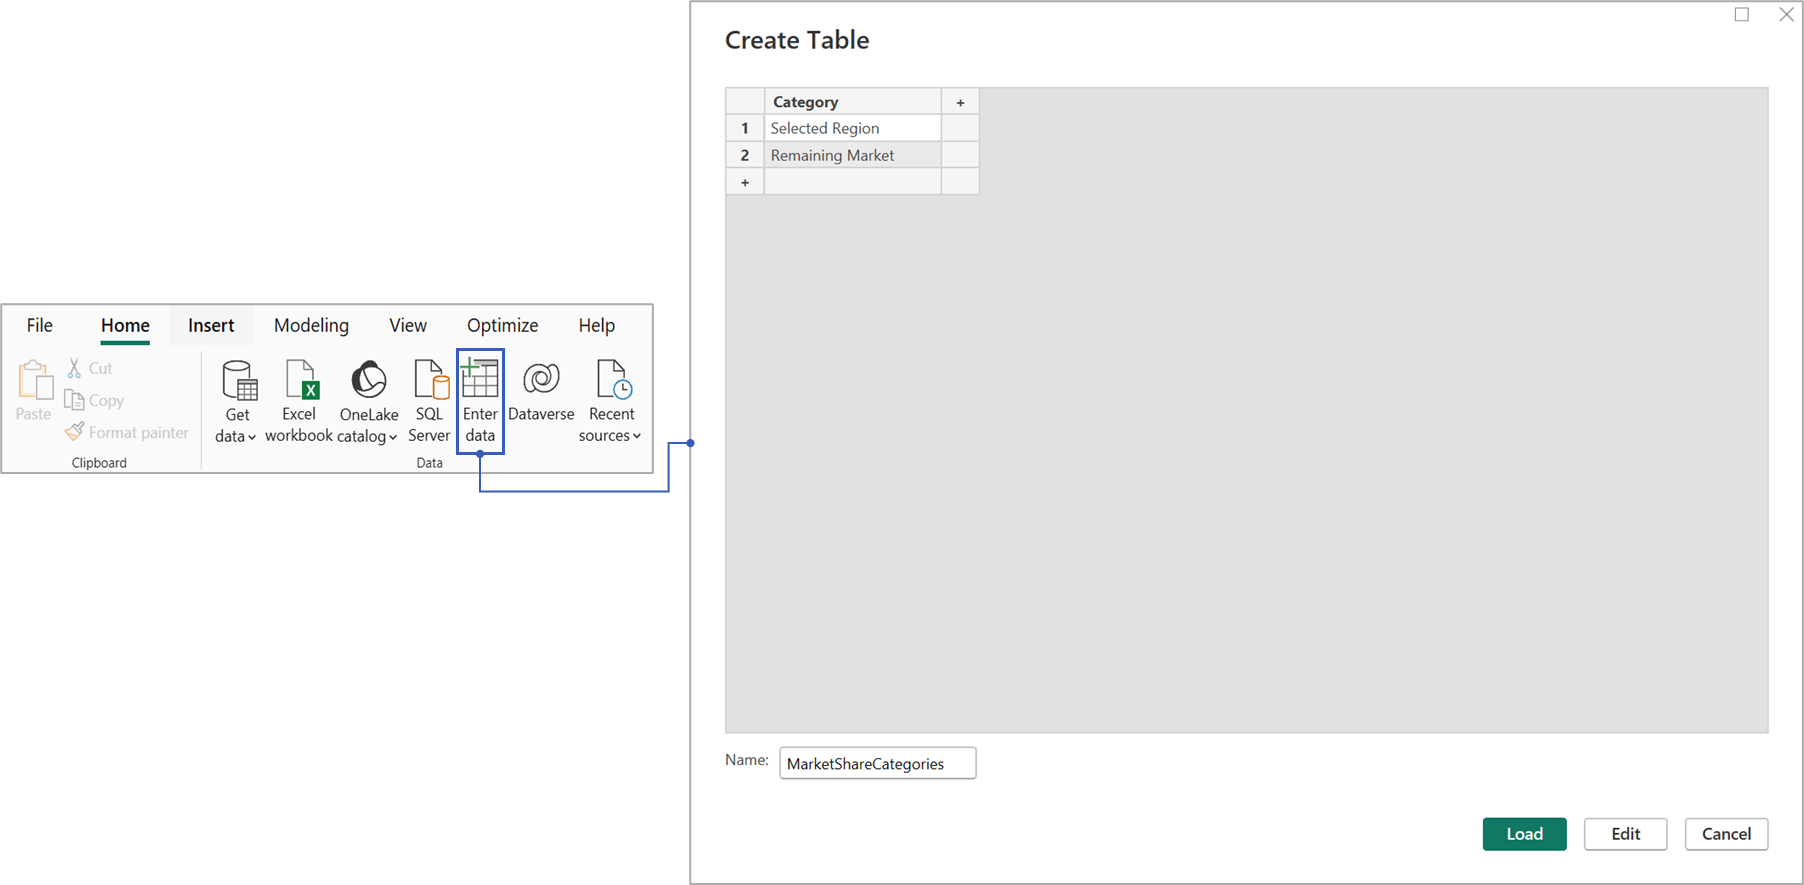 Creating a Disconnected Table for Market Share Display
_03 Market Share Value =
SWITCH(
    SELECTEDVALUE(MarketShareCategories[Category]),
    "Selected Region", [_01 Selected Region Market Share (AC%)],
    "Remaining Market", [_02 Remaining Market Share (AC%)]
)
This measure dynamically chooses which market share value to display based on the selection in a slicer or filter that uses the MarketShareCategories[Category] column.
-
If “Selected Region” is chosen, it shows the market share of the selected region(s).
-
If “Remaining Market” is chosen, it shows the market share of the rest of the market (not the selected region).
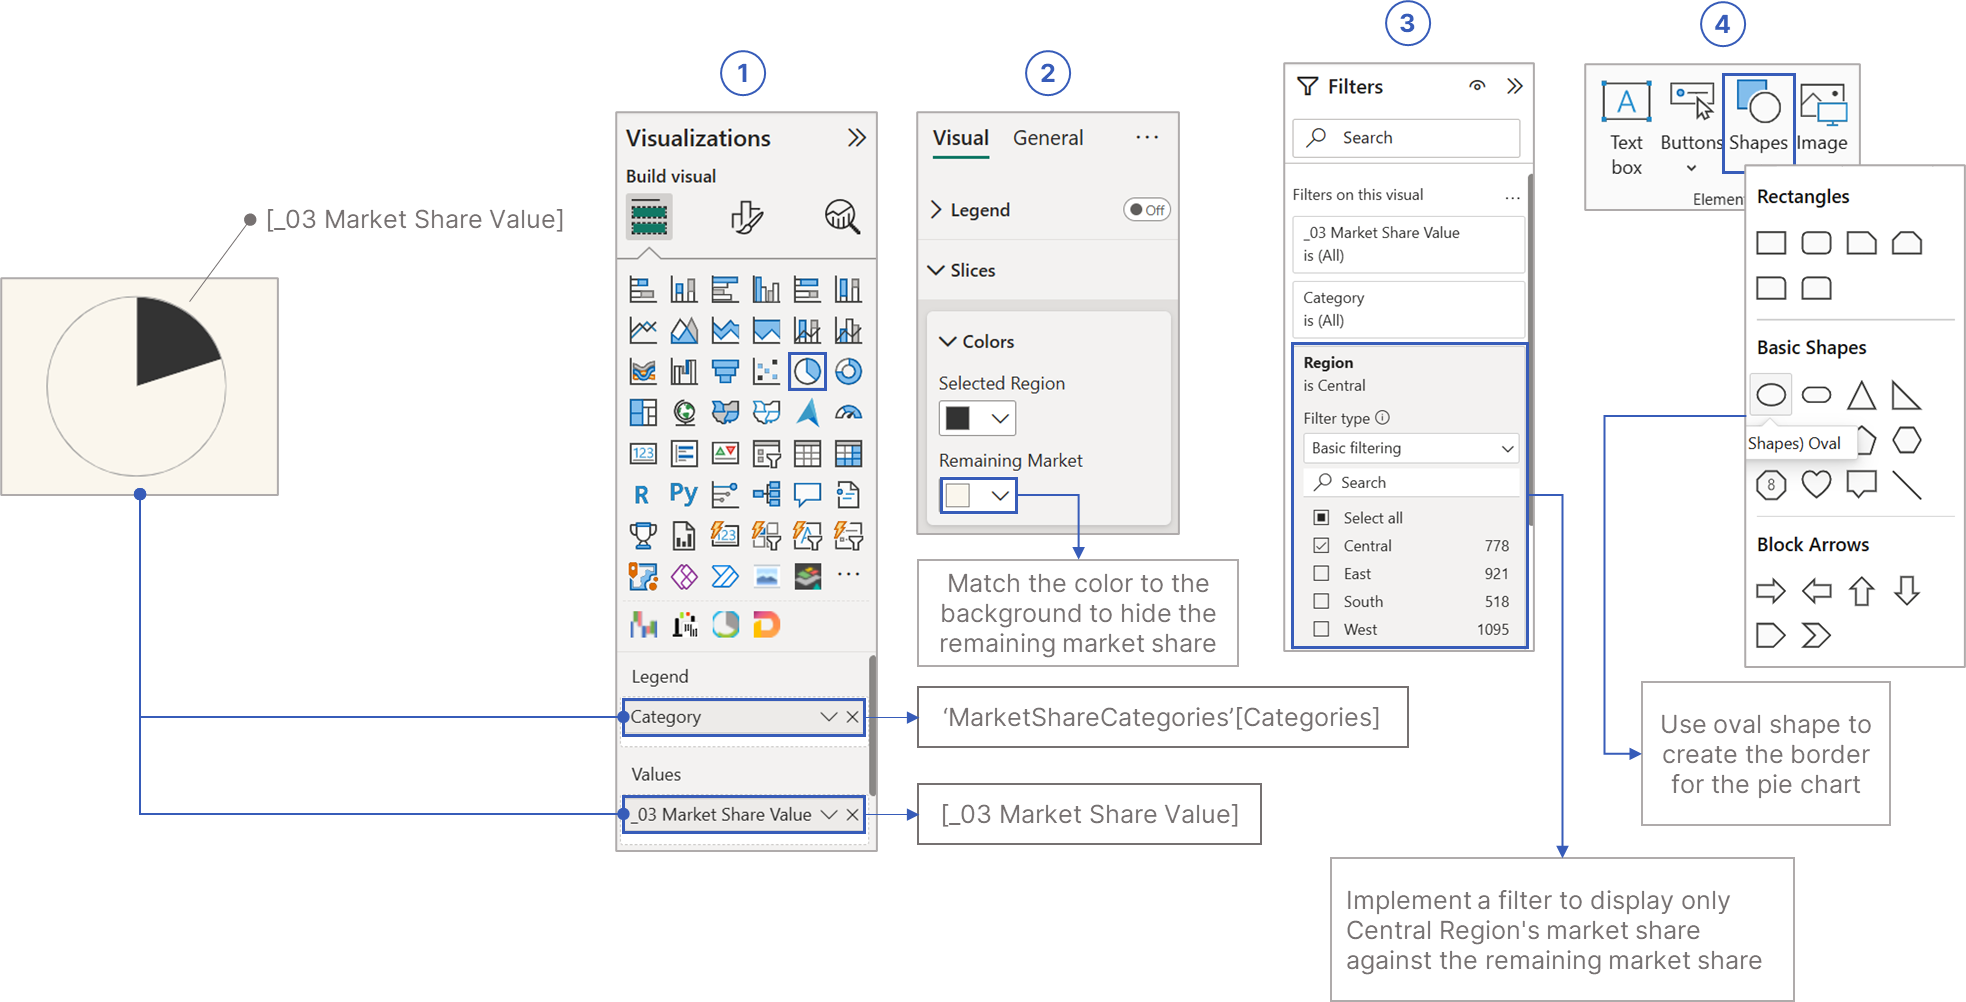 Constructing the Initial Layer of an IBCS-Compliant Pie Chart
To display East, South, and West regions, follow the same approach and select each region to show its market share on the pie chart.
Step 3: Displaying Year-Over-Year Market Share Growth
With the current regional sales market share visualized on the pie chart, we will proceed to generate the second layer, a year-on-year market share growth representation, utilizing a donut chart. To accomplish this, we will begin by defining a DAX measure to calculate the previous year’s regional sales market share.
_04 Selected Region Market Share (PY%) =
VAR TotalPY = CALCULATE(
    [Total Sales PY],
    ALL('Sample - Superstore_Orders'[Region], 'Sample - Superstore_Orders'[State])
)
RETURN
DIVIDE([Total Sales PY], TotalPY, 0)
This measure calculates the market share of the selected region(s) for the Previous Year as a percentage of the total sales across all regions and states for the Previous Year. It first calculates the total sales for all regions and states for the Previous Year, ignoring any region or state filters. Then, it divides the total sales for the selected region(s) for the Previous Year by the total sales for all regions and states for the Previous Year. The result is the market share percentage for the previous year. If the total sales across all regions are zero, the measure returns zero to avoid errors.
Following the calculation of the current and previous year’s total sales market share, we will proceed to define a DAX measure that calculates the market share growth or decline by finding the difference between the two calculated measures.
_05 Market Share Variance (Growth/Decline) =
[_01 Selected Region Market Share (AC%)] - [_04 Selected Region Market Share (PY%)]
To effectively display market share growth, we must first understand the chart’s construction. The goal is to show only the growth or decline on the donut chart, hiding remaining values by matching their colors to the pie chart’s background. We will differentiate growth and decline using green and red, respectively. Growth will be displayed when the variance is positive, and decline when it is negative.
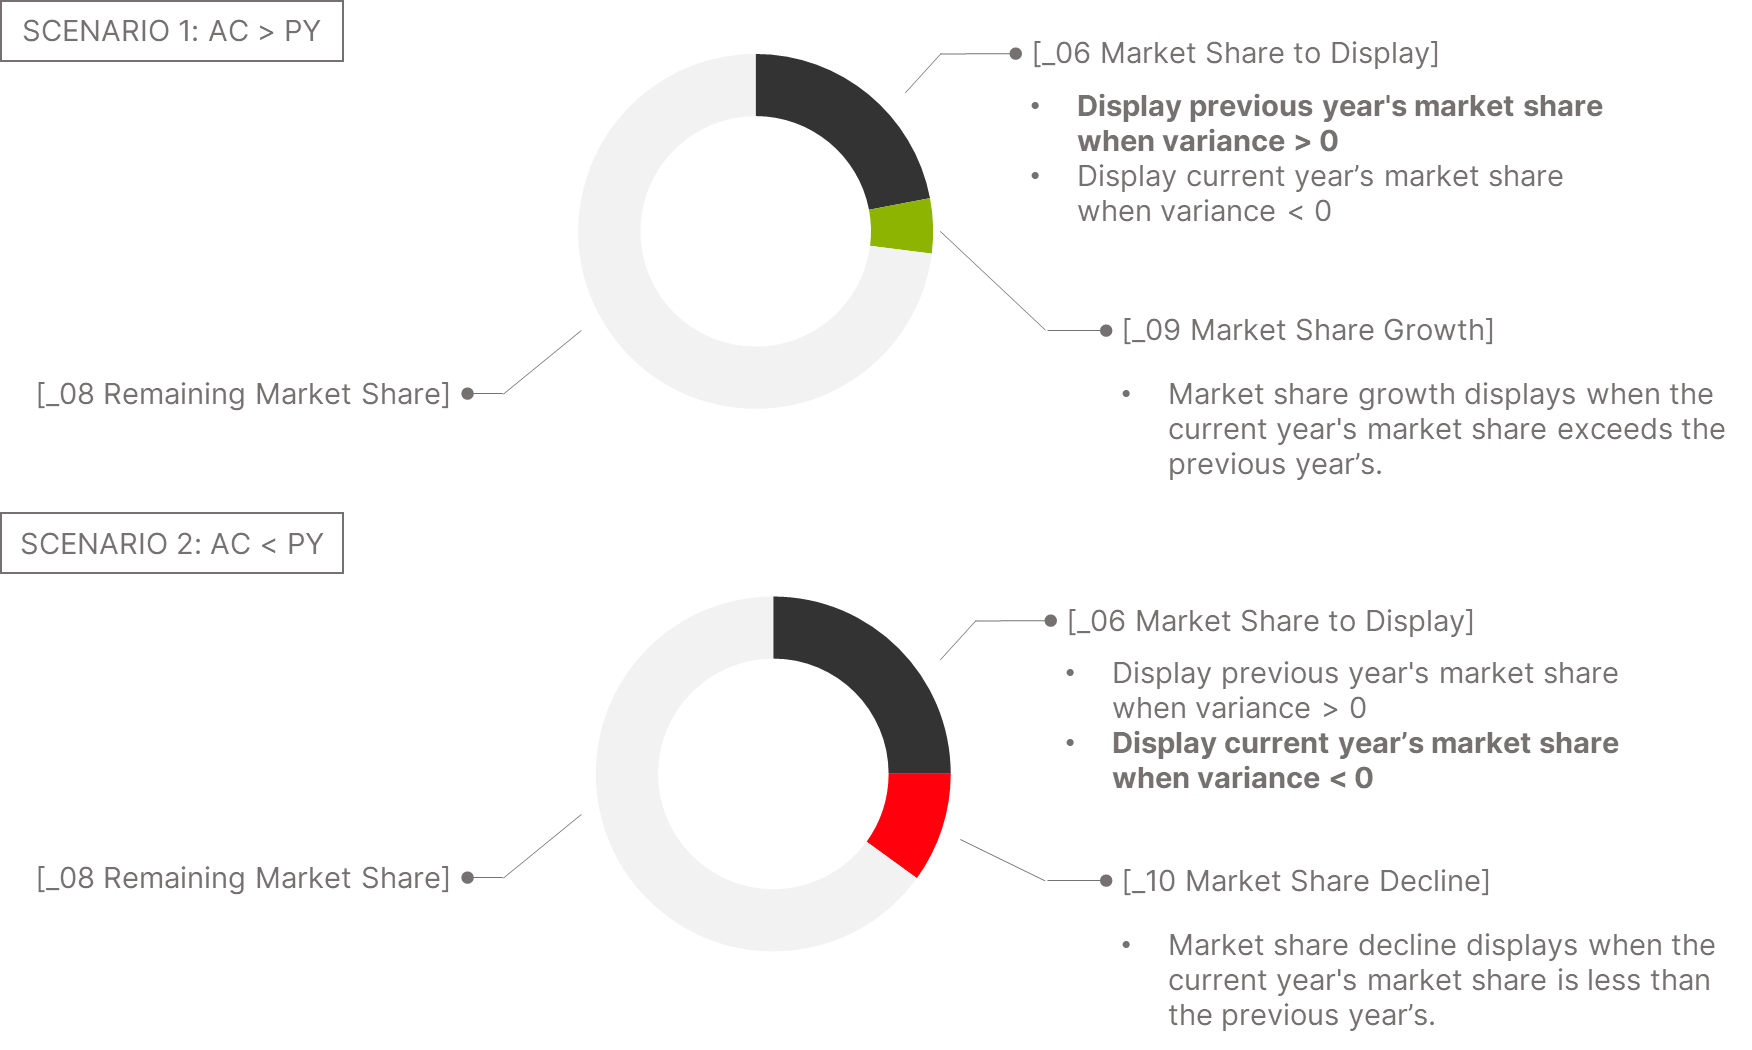 Measures Necessary to Create a Donut Chart Displaying Market Share Growth
_06 Market Share to Display =
IF(
    [_05 Market Share Variance (Growth/Decline)] < 0,
    [_01 Selected Region Market Share (AC%)],
    [_04 Selected Region Market Share (PY%)]
)
This measure determines which market share value to display based on whether there was a growth or decline in market share:
-
If there was a decline (variance < 0): The measure returns the current year’s market share.
-
If there was growth or no change (variance >= 0): The measure returns the previous year’s market share.
Because the donut chart requires positive values, we need to ensure the market share variance is always positive. Therefore, we will define the following DAX measure:
_07 Market Share Variance (Absolute) =
ABS([_05 Market Share Variance (Growth/Decline)])
This measure is used to ensure that the market share variance is always a positive value, regardless of whether there was growth or decline.
Now that we have the required measures, we can define a DAX measure to calculate the remaining market share to be visualized in the donut chart.
_08 Remaining Market Share =
1 - [_06 Market Share to Display] - [_07 Market Share Variance (Absolute)]
This measure calculates the remaining portion of the market share that is not represented by the displayed year’s market share or the market share variance. Imagine a donut chart representing 100% of the market. [_06 Market Share to Display] shows a part of the donut, representing either the current or previous year’s market share. [_07 Market Share Variance (Absolute)] shows another part, representing the growth or decline.
The concluding step involves defining DAX measures to conditionally display market share growth or decline. Growth will be shown when the variance exceeds zero, and decline when it is less than zero, with all values returned as positive.
_09 Market Share Growth =
IF(
    [_05 Market Share Variance (Growth/Decline)] > 0,
    [_05 Market Share Variance (Growth/Decline)]
)
_10 Market Share Decline =
IF(
    [_05 Market Share Variance (Growth/Decline)] < 0,
    ABS([_05 Market Share Variance (Growth/Decline)])
)
Generate a donut chart and assign the defined measures to its values, specifically: [_06 Market Share to Display], [_09 Market Share Growth], [_10 Market Share Decline], and [_08 Remaining Market Share].
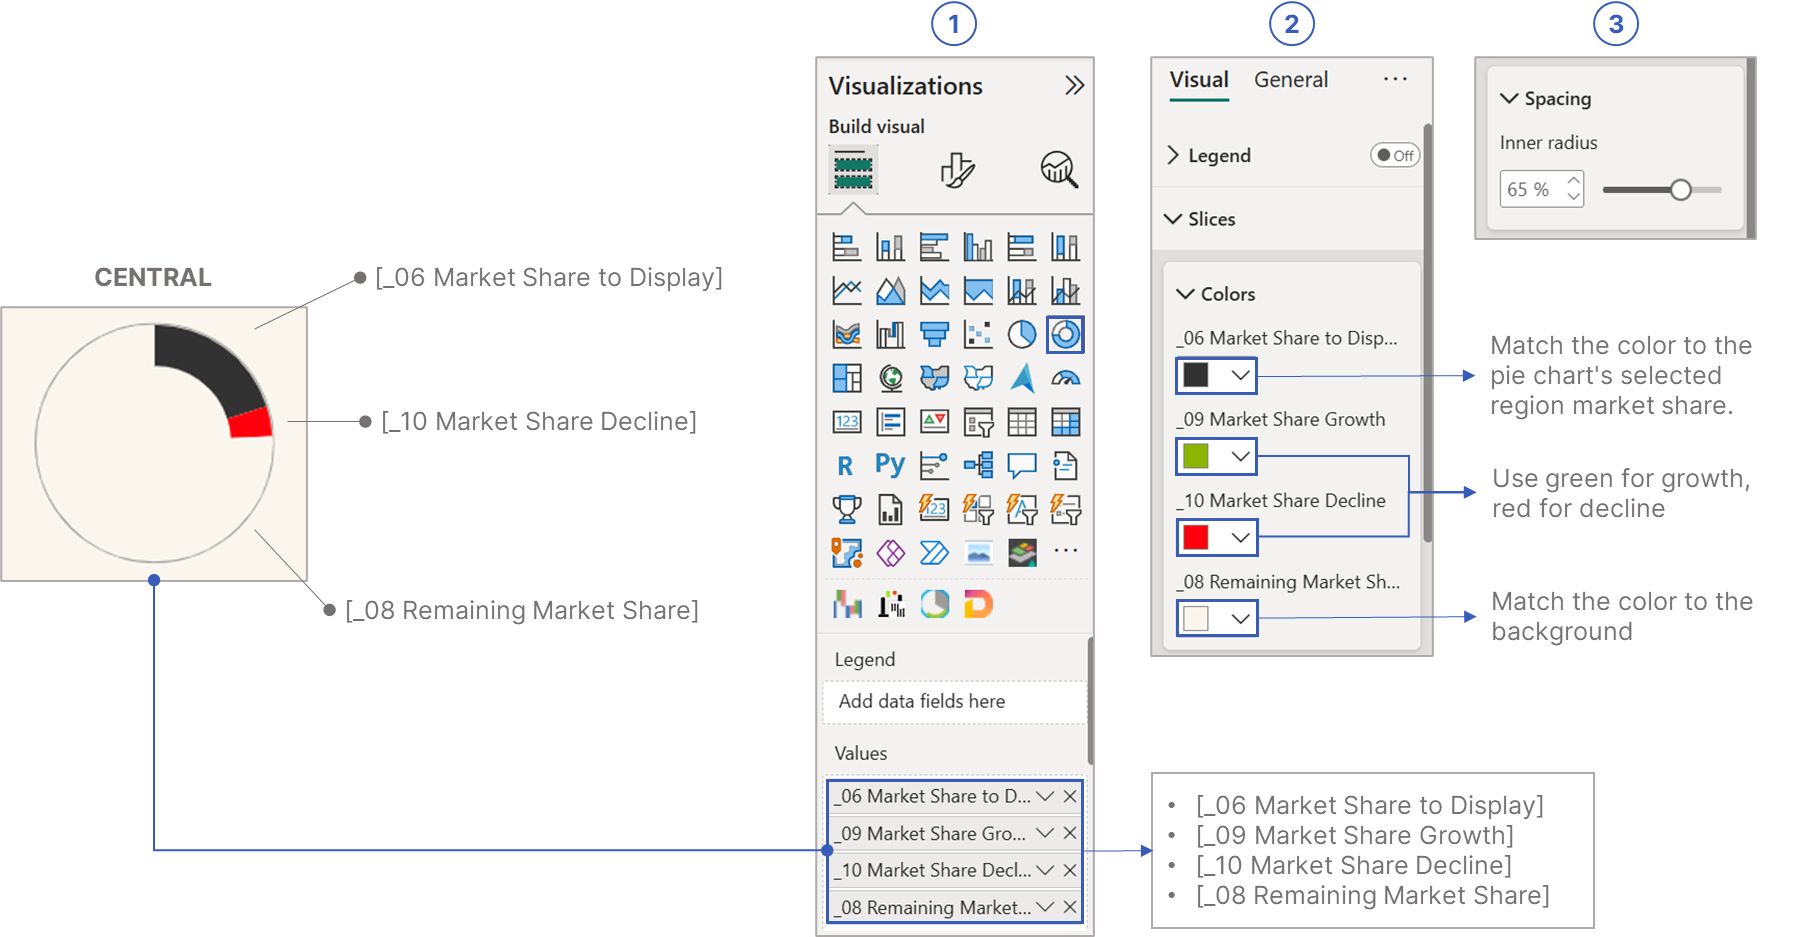 Constructing the Second Layer of an IBCS-Compliant Pie Chart